The model represents each storey of the building by a two degree of freedom ... outlined by Park (1992:280), but put simply capacity resistant design enables the ...
USE OF ADVANCED ANALYSIS TECHNIQUES TO DETERMINE THE COLLAPSE LOADS OF BUILDINGS SEAN WILKINSON * AND ROB HILEY* *Department of Civil Engineering University of Newcastle
ABSTRACT A material non-linear stick model is presented capable of analysing high-rise buildings subjected to earthquake forces. The model represents each storey of the building by a two degree of freedom beam element. This element is capable of replacing all vertical elements in a storey with a single element while simultaneously allowing the floors of each storey to undergo plastic deformations. Each storey can have multiple redundancies and the elements within a storey are assumed to be perfectly elastic, perfectly plastic. The model can perform static, free-vibration and time-history analysis. A verification example is presented and the results from a static pushover analysis are compared with time-history results from the simplified model. The results verify that the stick model is capable of performing non-linear time history analysis on high rise buildings. Keywords Advanced analysis, Dynamic analysis, Earthquake engineering 1 INTRODUCTION Because of the nature of earthquakes, a dual design philosophy has been adopted for the design of buildings in earthquake prone regions. The first design criteria is to ensure that little or no damage is suffered during an earthquake that can reasonable be expected to occur during the life-time of the structure. The second is that the building does not collapse during the maximum probable earthquake that could occur at that site. The corollary of this is that if the building is to remain cost effective, criteria number two will make it necessary to design the building inelastically. It is for this reason that all buildings designed in regions where earthquakes pose a serious threat to infrastructure are in some way designed inelastically. Presently there are three main methods to analyse buildings subjected to earthquakes. These are: 1.
Time history analysis
2.
Response spectra analysis
3.
Quasi static method.
Time history analysis is potentially the most accurate but it has two problems associated with it. The first problem is that it can be difficult to choose an appropriate earthquake to use as the loading, while the second problem is that it is generally too computer intensive to be practical – especially if inelastic analysis is considered. The computer resources required to perform a time history analysis on an inelastic finite element model are prohibitive. The most commonly employed method is the quasi-static method, as it is simplest, requires only static analysis and calculates the response of the structure subjected to an ensemble of earthquakes. The response spectra method is identical to the quasi-static method except that it considers more than just the fundamental mode of vibration. Most codes require that enough modes of vibration are considered to account for 90% of the modal mass (EC8:1994, UBC:1985, SANZ:1992) For the quasi-static method and the response spectra method the earthquake forces are divided by a behaviour factor (also known as a structural response factor). This factor accounts for the reserve strength of the building after the formation of the first plastic hinge and is the ratio of ultimate load to the load producing the first plastic hinge. It allows a pseudo inelastic design to be achieved without complicating the analysis. The only extra requirement to account for inelastic behaviour is for the designer to choose an appropriate building behaviour factor. Typically, this is done by choosing a
1
value, from a table, in a relevant earthquake code. This is a simple and reasonably effective way of achieving this but it is overly conservative. The various ductility factors have been arrived at empirically based on past experience of structural behaviour during earthquakes and based on generalised analysis of simple models of various building types. Recently the New Zealand code (SANZ) has tried to improve the selection of the building ductility factor by introducing capacity design. The philosophy adopted in capacity design is best outlined by Park (1992:280), but put simply capacity resistant design enables the designer to choose what building ductility factor they want, they must then ensure that the elements and connections have sufficient ductility to achieve the ultimate load. This procedure has led to push-over analysis. Push-over analysis subjects an inelastic building model to a static loading. This load is increased until the collapse capacity of the building is achieved. The rotations of all the plastic hinges are calculated and the joints detailed to ensure that these rotations can be achieved. Typically designers don’t actually perform an inelastic analysis but rather use successive elastic analyses, placing pinned connections at the positions of the plastic hinges. Although effective, for a multi-storey building, this procedure can be tedious and some doubt has been raised about its accuracy. The inelastic capacity of a building will depend on the distribution of earthquake forces. These forces are applied up the building in proportion to the mass of each storey and the fundamental mode shape of the building. When designing high-rise buildings it is often necessary to consider more modes than the fundamental in order to account for 90% of the modal mass. This means that the inelastic capacity of a building may be misrepresented by a push-over analysis. The accuracy of inelastic response spectra methods is still in doubt. Berg (1989) quotes an example of non-conservative error of 300% when response spectrum is used. Part of the reason for this is that the response spectra method uses mode superposition to combine the responses of the individual modes. Mode superposition is only applicable to linear analysis only and so the method of using building response factors is not strictly correct. Presently this is not a great a problem as the building response factors are crude and conservative; however, as capacity design becomes more widely used the effects of inelastic analysis may become more important. To combine the best of all models some researchers have looked at stick models. These models replace each storey of a building with a single element. This makes the problem sufficiently simple to allow time history analysis. As plastic hinges are formed in the building the stiffness of each element can be altered to reflect the reduced stiffness. One such model is derived here. Many simple models have been developed to perform time history analysis in the inelastic range 2
MODEL D EVELOPMENT
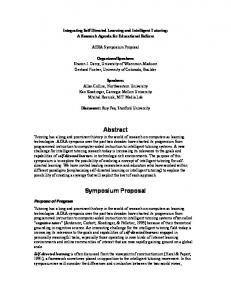
Thambiratnam and Thevendran (1992) proposed a 5 degree of freedom model to analyse high-rise buildings. Wilkinson and Thambiratnam (1997) extended this model to consider more accurately the rotations at the columns. The subsequent floor stiffnesses were modified by a factor to account for the contribution of horizontal elements and the configuration and variation of columns. In this paper an adaptation of this method is presented. Instead of a factor being added to the final stiffness matrix a torsional spring (with stiffness Kβ) is added to the top and bottom of each column. Theses torsional springs will be successively modified as plastic hinges are formed. The stiffness matrix for the beam element is shown in figure 1 is given in equation 1.
2
u1 Kb1
β1
β0
Kb0
u0
Figure 1 Five Degree of Freedom Prismatic Beam 12 EI Y 3 L 6 EIY L2 [k i ] = - 12 EI Y 3 L 6 EIY L 2
6 EIY L
- 12 EIY
2
3
L - 6 EI Y 2 L 12 EIY 3 L - 6 EI Y 2 L
4 EI y
+ Kβ 0 L - 6 EIY 2
L 2 EIY L
2 L 2 EIY L - 6 EIY 2 L 4 EI y + K β1 L 6 EIY
...(1)
The stiffness of each floor is given by summing the stiffness of each individual beam element at that level n
[ K oi] = ∑ [ki ]
...(2)
i =1
where n is the number of columns in that storey 0. The mass matrix simply lumps the mass of each storey on the leading diagonal of the degrees of freedom pertaining to deflection.
[ M i] {w && oi } = [mi] {&u& oi}
...(3)
Because the structure stiffness matrix has two extra degrees of freedom per floor The stiffness matrix is assembled and condensed in a similar fashion to that done by Thambiratnam and Thevendran (1992) and is repeated here for completeness. The 4 x 4 floor stiffness matrix is divided into 4, 2 x 2 sub-matrices as shown in equation 4
Koi11 Koi12 [ Koi] = 21 Koi22 Koi The sub-matrices are used to assemble the structure stiffness matrix, [Ko ], as shown in equation 5:
3
...(4)
11 0 0 K12 ( K22 o1 + K o 2 ) o2 K 21 22 11 12 ( Ko 2 + K o 3) 0 Ko 3 o2 [ K o] = 11 0 ( K22 K21 K12 o3 o 3 + K o 4) o 4 21 0 0 Ko 4 K22 o 4
...(5)
The structure stiffness matrix is rearranged so that the degrees of freedom common to both the mass and stiffness matrices (i.e. terms pertaining to u) appear first. Thus, the corresponding displacement vector becomes: {D0 }T =
u o1 , 1, uo2 , . . . , u on , βo1 , βο2 , . . . , βon
{wo1 }T, . . . , {won }T, {γo1 }T, . . . , {γon }T
...(6) ...(7)
where {wo1 }T =
u o1
{won }T =
u on
...(8)
{γo1 }T =
βo1
{γon }T =
βon
...(9)
and the rows and columns of the structure stiffness matrix are rearranged to correspond to their respective degrees of freedom as shown in equation:
Koww Ko w γ [ Ko] = γ w K oγγ Ko
...( 10)
Using this rearranged stiffness matrix the equation of motion is expanded to equation and:
[ M o] {w && o} + [K oww ] {wo } + [ Kow γ ] {γ o} = {Po (t)}
...(11)
[ Koγ w] {wo} + [K oγγ ] {γ o} = 0
...(12)
Combining equations and results in the reduced system:
[ M o] {w && o} + [ Ko]* {wo} = {P o (t)}
...(13)
Where the condensed matrix K* o is calculated from equation
[ K o*] = [K o ww] - [ K oγ w ]T [ K o γγ ]-1 [K o γ w]
...(14)
The rotations at the top of the origin vertical member (i.e. {γo }) can be determined from equation .
{γ o} = - [Ko γγ ]-1 [ Koγ w] {wo}
…(15)
Free vibration analysis was achieved by performing eigenvalue analysis on equation 13 with the forcing function set to zero. Time history analysis was achieved by solving equation 13 and 15 using a Runge Kutta fourth order numerical integration scheme. Accuracy was ensured by comparing displacements and velocities at each time step with displacements and velocities calculated using two half time steps. Inelastic analysis was incorporated by considering each vertical member to be perfectly elasticperfectly plastic. While this is not the most accurate relationship for the behaviour of connections, is more than one column yields the overall behaviour of the floor will be multi-linear and will include Bauschinger effects.
4
3 V ERIFICATION EXAMPLES 3.1. EXAMPLE 1 The three-storey plane frame, shown in Figure 3 has been analysed using a commercially available structural analysis package. All structural elements are beam elements and their section and material properties are shown in Table 1. The frame was subjected to successive elastic static analyses (pushover analysis). After each analysis the location of plastic hinges and associated loads required to develop them were calculated. The collapse sequence and final collapse mechanism are displayed in Figure 4 together with the first three periods of vibration and loads required to form the plastic hinges. In addition to the analysis by a commercially available structural analysis package a push-over analysis and time history analyses were performed using the simplified model. To model the push-over analysis by the simplified model it is necessary to assume perfectly elastic-perfectly plastic material behaviour. While this is not the most appropriate relationship for the analysis of structures subjected to earthquake loading it is convenient for verifying the accuracy of the model. It is also convenient to use this relationship to study the appropriateness of push-over analysis when higher order modes of vibration become significant in the overall response of the structure. For non-linear behaviour of real buildings material models such as Takeda, Sozen, and Nielsen (1970) could be used for reinforced concrete or Krawinkler, Bertero and Popov (1971) for steel frames. Since this frame is very simple the values of Kβ are simple to calculate and are given in equation 16. Kβ = 12E Is /Ls ...(16) The loading chosen for this analysis was a cosine-wave that had been displaced by half of its amplitude as shown in Figure 5. To simulate static loading a cosine-wave loading with a period that was very long compared to the natural period of the structure (10 seconds) was chosen. The shape of the wave was chosen also to minimise the dynamic effects. The derivative of the cosine-wave (which is proportional to velocity in this analysis) at the start of the analysis is zero. The base shear - deflection, base shear - rotation and base shear - moment relationships for the pushover analysis are shown in Figure 6. P3
Is3
M3 h3
P2
Is2
M2 h2
P1
Is1
M1 h1
Ls V
Figure 3 Example 1
5
P3
Is3
P3
Ic3 P2
h3
Ic3
Is2
P2
Ic2 P1
Is3
Is2
h2
Ic2
Is1
P1 Ic1
FEM 0.375 0.0860 0.0367
P3
Ic1
h1
Simplified Model 0.374 0.0860 0.0367
Period (s) T1 T2 T3
FEM 0.608 0.0863 0.0374
P3
Ic3
Is3
Ic3 P2
Ic2
Ic2 P1
FEM 0.902 0.100 0.0375
h2
Is1 Ic1
h1
Ls Period (s) T1 T2 T3
h3
Is2
h2
Is1 Ic1
Simplified Model 0.6077 0.0861 0.0374
h3
Is2
P1
h1
Ls
Is3
P2
h2
Is1
Ls Period (s) T1 T2 T3
h3
h1
Ls Τ=∞
Simplified Model 0.902 0.100 0.0375
Figure 4 Collapse Mechanisms Storey
Height (h) (m)
Mass (M) (kg)
Column second moment of area (Ic) (m4 )
Beam second moment of area (Ic) (m4 )
Load (P) (kN)
Plastic Moment (Mp) (kN-m)
1
3
62500
5.208x10⁻³
5.208x10⁻³
134
1000
2
3
62500
5.208x10⁻³
5.208x10⁻³
350
1000
3
3
62500
5.208x10⁻³
5.208x10⁻³
516
1000
6
2
Modulus of elasticity for all members = 200 x 10 kN/m , Ls = 10m Table 1 Frame Parameters
6
Applied Base Shear (kN)
1200
Base Shear Vs Time
1000 800 600 400 200 0 0
2
4
6
8
10
Time (secs.) Figure 5 Applied Base Shear
The time history analysis was terminated when the plastic hinge in the top storey was reached (this represents collapse of the structure and occurred at V= 846.8kN compared to 839.6kN for the pushover analysis).
Base Shear Vs Rotations
Base Shear Vs Displacements 900 800 700 600 500 V (kN) 400 300 200 100 0
0
0.01
0.02
900 800 700 600 storey 1 push-over V (kN) 500 storey 2 push-over 400 storey 3 push-over 300 storey 1 time-history 200 storey 2 time-history 100 storey 3 time-history 0 -0.007 -0.006 0.03 0.04 0.05
storey 1 push-over storey 2 push-over storey 3 push-over storey 1 time-history storey 2 time-history storey 3 time-history -0.005 -0.004 -0.003 -0.002 -0.001
Displacements (mm)
(a) Force Deflection Relationship
Rotations (rads)
(b) Force Rotation Relationship
Base Shear Vs Moment
900 800 700 600 500 V (kN) 400 300 200 100 0
storey 1 push-over storey 2 push-over storey 3 push-over storey 1 time-history storey 2 time-history storey 3 time-history 0
200
400
600
800
1000
1200
Moment (kN-m) (c) Force Moment Relationship Figure 6 comparison of push-over analysis with time-history analysis From Figure 6, it can be seen that the two analyses are in very good agreement. The collapse loads calculated by the two analyses are within 1% of each other. Furthermore the time-history of the
7
0
second analysis follows the static analysis very closely. The only parts of the graphs that do not match very closely are those located directly after yielding (indicated with markers). The reason for this is that because of the perfectly plastic behaviour assumed for the analysis, after yielding there is a sudden loss of stiffness. This loss in stiffness results in the frame accelerating in the direction of loading which in turn produces inertia forces. These forces result in the small differences between the graphs. 4
CONCLUSION
An efficient simplified model for the analysis of high-rise buildings has been presented. This model can analyse nominally symmetric structures using only 2 degrees of freedom per floor. Furthermore before solution the stiffness matrix is condensed to only one degree of freedom per floor. This makes it particularly attractive for non-linear time history analysis. The model presently incorporates a multilinear moment rotation relationship for the beam to column connections, but any suitable relationship could be incorporated. A verification example has been presented. In this example, the model was shown to be capable of analysing simple structures to within less than 1% of the results obtained by finite element analysis. For complicated structures the model could be calibrated against a static finite element model and then used for non-linear time history analysis. The model accurately predicts higher modes of vibration and therefore can be used to consider the influence of these on the collapse of buildings. Use of non-linear time-history analysis enables the collapse load of high-rise buildings to be determined much more accurately. 5
R EFERENCES
Berg, G.V. (1989) “Elements of Structural Dynamics”, Prentice Hall, Englewood Cliffs, New Jersey. Eurocode No 8, EC(1994), “Common Unified Rules for Structures in Seismic Regions.” Commission of European Communities. Krawinkler, H., Bertero, V. and Popov, E. (1971) “Inelastic Behaviour of Steel Beam to Column Subassembleges”, Report No EERC 71-7, University of California, Berkley Park, R. (1992) “Capacity Design of ductile RC building structures for Earthquake Resistance.” The Structural Engineer, Vol. 70, No. 16/18, August, pp. 279-289. SANZ - Standards Association Of New Zealand (1992) “New Zealand Standard Code of Practice for General Structural Design and Design Loadings for Buildings, NZS 4203:1992” Takeda, T., Sozen, M. and Nielsen, N. (1970) “Reinforced Concrete Response to Simulated Earthquakes” Journal of Structural Engineering, ASCE pp. 2257 – 2573. Thambiratnam, D. P. and Thevendran, V., (1992), "Simplified Analysis of Asymmetric Buildings Subjected To Lateral Loads", Computers and Structures Vol. 34, No. 5, pp. 873-880. Wilkinson, S. M. and Thambiratnam, D. (1997) “Analytical Model For Buildings Subjected To Earthquakes”, second International Conference on Computer Applications Research and Practice, Bahrain, 6-8th April 1996. UBC - Uniform Building Code (1985), International Conference of Building Officials.
8