Estimation of temperature lapse rate in Beas river basin of western Himalaya using Landsat 8 satellite remote sensing Gopinadh Rongali*, A. K. Keshari, A. K. Gosain & Rakesh Khosa Department of Civil Engineering, Indian Institute of Technology Delhi, India. (Corresponding Author E-mail:
[email protected])
RESULTS AND DISCUSSION
ABSTRACT
Land Surface Temperature (° C)
Elevation (m)
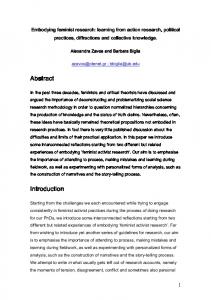
Figure 3: Scatter plots showing the temperature–elevation relationship (ASTER DEM vs. LST map derived from Landsat 8 images) at four different dates of year 2013.
INTRODUCTION
Land Surface Temperature (° C)
Quantification of variation of temperature with elevation (temperature lapse rate, TLR) in Himalaya is important for accurate hydrological modelling and for understanding of long term cryospheric changes. However such evaluation is a challenging task due to unavailability of long term temperature data and regional complex climatology combined with rugged topography. In such mountainous regions dense network of metrological observatories are required to efficiently represent the regional temperature variation with respect to elevation.
STUDY AREA The area selected for the present study is high range mountain landscape of Beas river basin located on the state of Himachal Pradesh, India (Figure 1). The study area stretches between the latitudes of 31°N to 32°N and longitudes of 77°E to 78°E covers an area of 5383 Km2 and elevation range varies from 857 m to 6582 m.
Elevation (m)
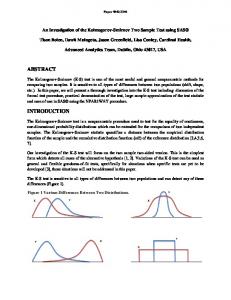
Figure 4: Scatter plots showing the temperature–elevation relationship (ASTER DEM vs. LST map derived from Landsat 8 images) at four different dates of year 2014.
Land Surface Temperature (° C)
DEPARTMENT OF CIVIL ENGINEERING
IITD
Commonly, Temperature Lapse Rate (TLR) in rugged terrain regions is estimated based on the in-situ air temperature data collected in sparsely located metrological stations. These in-situ temperature recordings are point data and are collected manually. Satellite remote sensing provides an alternative to above stated issues, as satellite data is continuous providing synoptic viewing and represents potentially unbiased recordings. In the present study the monthly TLR was simulated for Beas river basin using satellite remote sensing inputs. Inter-seasonal and inter-annual variation in the TLR was assessed using LANDSAT 8 (formerly the Landsat Data Continuity Mission, LDCM) and ASTER (Advanced Space borne Thermal Emission and Reflection Radiometer) sensor data. Land Surface Temperature (LST) values retrieved from Landsat 8 were correlated with the values from ASTER Digital Elevation Model (DEM) which showed a strongly correlated, inverse relationship. The results show that the TLR in Beas river basin ranges from –0.47 to –0.93°C/100m with strong inter-seasonal variation. Keywords: Beas, LANDSAT 8, ASTER, DEM, Temperature lapse rate (TLR), Remote Sensing
Figure 1: ASTER DEM of Beas basin up to Pandoh dam with location of meteorological stations.
DATA USED The data used in the study is shown in Table 1. Data type Landsat 8 LST products
Details 2012-13, 2013-14 and 2014-15 with spatial
Source https://earthexplorer.usgs.gov/
resolution of 100 m ASTER (GDEM V2) DEM Product
Spatial resolution 30 m
https://earthexplorer.usgs.gov/
Air temperature data of
Daily air temperature data from Beas river
http://www.mosdac.gov.in/
Beas river basin
basin
LANDSAT 8 (formerly the Landsat Data Continuity Mission, LDCM) ; ASTER - Advanced Spaceborne Thermal Emission and Reflection Radiometer; GDEM V2 - Global Digital Elevation Model Version 2; LST – Land Surface Temperature; DEM- Digital Elevation Model.
Elevation (m)
Figure 5: Scatter plots showing the temperature–elevation relationship (ASTER DEM vs. LST map derived from Landsat 8 images) at four different dates of year 2015.
CONCLUSIONS In the present study, R2 values between 0.5761 and 0.8789 were obtained in the case of LST from LANDSAT 8 images. The slope of the equation (Figures 3 -5) is equal to the lapse rate. The results show that TLR, estimated for the study area from LST and DEM is in the range 0.47–0.93°C/100m for the LANDSAT 8. The range of lapse rate obtained from the present study can be used with confidence in snowmelt runoff and other studies.
METHODOLOGY The methodology followed for estimation of TLR is shown in Figure 2.
Figure 2: Flowchart showing various steps involved in lapse rate estimation.