The revised-Methodology automatic, user-independent tool ... stakeholders was to keep the procedure simple and based on widespread data, so to make it ... Daily presence of dust over any PM10 monitoring site of the network is flagged over ...
Appendix to the paper by Barnaba et al., Atm. Env., 2017 http://dx.doi.org/10.1016/j.atmosenv.2017.04.038
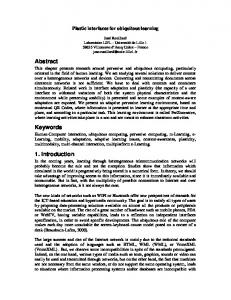
APPENDIX D: The revised-Methodology automatic, user-independent tool In designing the revised-Methodology we took care in addressing the needs of the expected final users of such methodology. During DIAPASON, some potential users were identified within the Italian regional Environmental Agencies community, and were active during the Project in providing feedbacks and suggestions. In particular, two requests from this stakeholder community drove important choices in shaping the revised-Methodology tool. A first request from the stakeholders was to keep the procedure simple and based on widespread data, so to make it adaptable to different regions and usable by operators having different skills. The desert dust quantification phase of the EC-Methodology already has the important advantage of being simple, and essentially based on Eq. 1 in Section 2.2. Therefore, apart from the modifications widely discussed in Section 2.3, this approach was kept in the revised-Methodology. An important request from the stakeholders was to provide them with a procedure which could be as much as possible ‘automatic’ and ‘user-independent’ (i.e., objective and reproducible). This represents an important difference with respect to the tool developed to implement the EC-Methodology (Section 2.2 and Appendix A), which still requires a constant (day-by-day) user evaluation of a large set of desert dust-related information, thus suffering from some subjectivity in the selection of dust-affected dates and, in turn, on its final outcome. This required embedding an automatic procedure to flag dust events within the revised-Methodology. The choice was to minimize the information to be collected and evaluated, without loosing much of the capability to correctly flag dust-affected days. From the experience gathered in previous studies (e.g., Gobbi et al, 2013) and within DIAPASON (in which the EC-Methodology was applied and tested in parallel with ‘real’ desert-dust detection by 3 Polarization-Lidar Ceilometers - PLCs, Gobbi et al., 2017), we selected the dust model forecasts as the main tool able to discriminate between Saharan and non Saharan conditions. In fact, even though model forecasts are affected by errors and can obviously fail (e.g., Kishcha et al., 2007; Basart et al., 2012b), when compared to the PLC observations, these resulted to be rather accurate at correctly predicting timing of dust plumes reaching Rome (Italy), and much more informative than all the others datasets suggested by the EC-Methodology (satellite images, back-trajectories, wind patterns). Several desert-dust transport models operationally provide dust forecast maps/images, however we needed direct access to the numeric data format to our purpose. In this work we used the dust concentration data (desert-dust PM10 at the surface) from the BSC-DREAM8b model (daily provided by BSC, Basart et al., 2012b), since these revealed a good timing correlation with the DIAPASON lidar detections of dust advections. Still, growing availability of ensembles of dust model forecasts will represent the best way to ‘objectively flag’ the presence of Saharan dust in the future. Note that the automatic tool developed to implement the revised-Methodology in fact uses the model forecasts uniquely to ‘flag’ presence of dust over a given monitoring site (a minimum threshold of 5 g/m3 in the model daily value of desert-dust-PM10 at surface was set to minimize the impact of false positives). Daily presence of dust over any PM10 monitoring site of the network is flagged over each site of the monitoring network using the nearest neighbor approach between model grid cells and PM10 stations, the model having about 30 x 30 km2 resolution. Figure D1 shows the model grid (yellow lines) over Central Italy (DIAPASON Pilot Area) and position of the Latium region PM10 monitoring sites (green points). Overall, the tool implementing the revised-Methodology requires: 1) the modeled desert-dustPM10 field over the region/for the period under investigation and 2) the measured PM10 values at the monitoring sites within the region under investigation (and their relevant geographical 1
Appendix to the paper by Barnaba et al., Atm. Env., 2017 http://dx.doi.org/10.1016/j.atmosenv.2017.04.038
coordinates). The output of the whole procedure is a day-by-day and site-by-site value of the estimated desert dust-contribution to the measured PM10.
Figure D1: Example of the BSC-Dream8b model spatial grid over Central Italy (yellow lines) and position of the 37 PM10 monitoring sites (green points) within the Latium region.
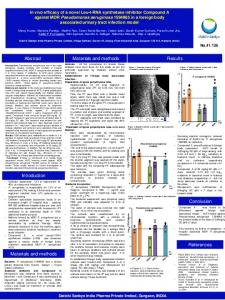
The graphical interface of this developed tool is shown in Figure D2. Being the procedure fully automatic, no specific interface would in principle be needed. This has been however preferred to: 1) let the user define some parameters (e.g., start and end date of the requested analysis, output path of the results) and 2) have a direct framework to quickly visualize the results and the relevant statistics (plots and tables). Apart from the improvements discussed in the main text (Section 2.3), main advantages of the procedure are: 1) it is fully automatic and user-independent (i.e., the same output is derived independently on the user running it), providing a rapid data processing; 2) by relying on model-based desert-dust flags, it eliminates the problem ‘doubtful dust’ cases, a major drawback of the EC-Methodology implementation (see Section 2.1 and Appendix A).
Figure D2: Graphical User Interface of the tool developed to implement the revised-Methodology
2
Appendix to the paper by Barnaba et al., Atm. Env., 2017 http://dx.doi.org/10.1016/j.atmosenv.2017.04.038
References (additional to those included in the main text): Kishcha P., P. Alpert, A. Shtivelman, S.O. Krichak, J.H. Joseph, G. Kallos, P. Katsafados, C. Spyrou, G.P. Gobbi, F. Barnaba, S. Nickovic, C. Perez, and J.M. Baldasano, Forecast errors in dust vertical distributions over Rome (Italy): Multiple particle size representation and cloud contributions Journal of Geophysical Research, 112, D15, doi: 10.1029/2006JD007427, 2007.
3