Não posso deixar de agradecer a Sanna Mättä pela amizade e ... lower
abstraction levels does not provide the required support to find out the most
efficient ...
PONTIFÍCIA UNIVERSIDADE CATÓLICA DO RIO GRANDE DO SUL FACULDADE DE INFORMÁTICA PROGRAMA DE PÓS-GRADUAÇÃO EM CIÊNCIA DA COMPUTAÇÃO
ABSTRACT MODELS OF NOC-BASED MPSOCS FOR DESIGN SPACE EXPLORATION
LUCIANO COPELLO OST
TESE
APRESENTADA COMO REQUISITO PARCIAL À OBTENÇÃO DO GRAU DE DOUTOR EM CIÊNCIA DA COMPUTAÇÃO NA PONTIFÍCIA UNIVERSIDADE CATÓLICA DO RIO GRANDE DO SUL
ORIENTADOR: PROF. DR. FERNANDO GEHM MORAES CO-ORIENTADOR: DR. LEANDRO SOARES INDRUSIAK
PORTO ALEGRE, BRASIL 2010
Dados Internacionais de Catalogação na Publicação (CIP) O85a
Ost, Luciano Copello Abstract models of NoC-based MPSoCs for design space exploration / Luciano Copello Ost. – Porto Alegre, 2010. 99 p. Tese (Doutorado) – Fac. de Informática, PUCRS. Orientador: Prof. Dr. Fernando Gehm Moraes. 1. Informática. 2. Arquitetura de Redes. 3. Simulação e Modelagem em Computadores. I. Moraes, Fernando Gehm. II. Título. CDD 004.6
Ficha Catalográfica elaborada pelo Setor de Tratamento da Informação da BC-PUCRS
AGRADECIMENTOS Primeiramente, gostaria de agradecer aos meus pais Eugenio Ost e Maria Bernadett Copello Ost pelo apoio recebido em todas as etapas de minha vida (ambos sabem, ou pelo menos deveriam saber, o quanto sou grato). Obrigado por todos os ensinamentos e valores, os quais levarei por toda minha vida. A minha querida mana Lilian Copello Ost (a Lica, meu porto seguro). Aos meus orientadores e amigos Fernando Gehm Moraes e Leandro Soares Indrusiak (apesar de ser colorado). Ambos tiveram e, certamente, ainda terão muita influência na minha formação profissional e pessoal. Ambos sabem que sou muito grato (pelo menos eu espero que sim :-) e que estou em divida (algum dia pagarei :-). Obrigado pela paciência, conselhos, incentivos e dos puxões de orelha durante minha formação (talvez eu não merecesse alguns, mas tudo bem :-). VALEU!!! Ahhh, eu fui o orientando mais serelepe de vocês né ??? Cabe agradecer ao professor Ney Calazans que diversas vezes me auxiliou durante o desenvolvimento dessa Tese. Valeu!!! Aos meus amigos e colegas Ricardo Czekster (apesar de colorado um grande amigo - hoje tu deve escutar U2 todos os dias né ), Edson Moreno (um cara que admiro muito – apesar de ser colorado), Leonel Tedesco (uns dos caras que conheço que mais sabe de futebol – e um dos caras que mais gosta de Dave Matthews Band também - valeu tche), Ewerson Carvalho (mesmo tendo algumas opiniões divergentes sei que ele sempre gostou de apreender a jogar bola comigo - valeu tche), Thaïs Webber (valeu pela força), Rafael Iankowski Soares (tudo bem é colorado, mas um cara show de bola que sabe tudo de horário de train ), Alexandre Amory (que me atirou um copo d’agua – marquei na paleta – valeu pela ajuda tche), Julian Pontes (que aprendeu muito a jogar bola comigo ), Carlos Petry (sempre sábio em suas colocações) e o Cesar Augusto Missio Marcon (que adorava tomar dribles ). Pessoal valeu pelas inúmeras “bagunças” (e.g. jogos, parada para café, churrascos, viagens, jantas, saídas – despedidas/reencontros). Aos meus amigos e afilhados Leandro Heleno Möller e Laura Artoni Möller que me aturaram durante o período que passei em Darmstadt (tá bom não foi só no período em Darmstadt, é é é deixa assim ). Devo destacar as discussões, o trabalho desenvolvido e o aprendizado adquirido com o Möller. Möller levarei muita coisa comigo. Também não posso esquecer-me dos excelentes momentos passados extra-laboratório, onde se incluem discussões filosóficas, viagens, as cantorias do Möller no laboratório (é esse não tão extra-laboratório assim e o Möller não canta tão bem) e, claro, as jantas lideradas pela Laura . Não poderia deixar de agradecer a Giuliana (Indrusiak’s wife) pela ajuda durante o mesmo período em Darmstadt (valeu mesmo, sei que incomodei um pouco e estou em divida). Não posso deixar de agradecer a Sanna Mättä pela amizade e colaboração no trabalho desenvolvido. Valeu Sanna sempre me diverti muito contigo, mesmo quanto estávamos discutindo coisa de trabalho (CABUMMM ). Devo agradecer ao casal de amigos Osmar Marchi dos Santos (tudo bem ele gosta de escutar Lionel Richie - mas ninguém é perfeito né) e a Simone Regina Ceolin (quanta paciência , agora tu pode falar “nem parece um Dr.” ), por me agüentarem tantos anos, valeuuuuuu!!! Resumindo, todos vocês vão ter que me agüentar ainda . Agradeço ao meu amigo de longa data Leandro Galvão (ELE) pela força e amizade de anos. Obrigado mesmo pela paciência e ajuda, principalmente, durante o período que dividimos o apartamento (e.g. período da escrita dessa Tese). Todas as conversas e cervejadas me ajudaram muito. Valeeeeeu mesmo!!! Devo agradecer a Denise Oliveira dos Santos que durante um bom tempo do doutorado esteve do meu lado me dando força. Agradeço também a Giselle Duarte por ter me ajudado algumas vezes durante o doutorado. Valeu!!! Agradeço também aos demais colegas do GAPH pela convivência e discussões. Destaco o Guilherme Guindani (que ajudou muito durante o trabalho), Thiago Raupp da Rosa, Marcelo Mandelli e Matheus Trevisan. Devo ainda agradecer ao Thiago Lingener, Regis Silva, Sandra, e o Zé Carlos - funcionários da FACIN - que inúmeras vezes me ajudaram. Agradeço ainda o suporte financeiro advindo do CNPq na forma da bolsa de fomento do Programa Nacional de Microeletrônica (PNM). Não agradeço as seguintes pessoas... ahhh é palha mencionar então deixa assim.
ABSTRACT MODELS OF NOC-BASED MPSOCS FOR DESIGN SPACE EXPLORATION
RESUMO MPSoCs baseados em NoCs podem fornecer alto desempenho em um único circuito integrado, atingindo centenas de bilhões de operações por segundo através do emprego de múltiplos elementos de processamento que se comunicam através de uma NoC operando a uma freqüência que excede 100 Tbps. Tais dispositivos podem suportar a execução simultânea de múltiplas aplicações (e.g. HDTV, múltiplos padrões de comunicação sem fio, tocadores multimídia, jogos), devido a características como alto desempenho, flexibilidade e eficiência em termos de consumo de energia. Devido a quantidade de alternativas inerentes ao grande espaço de projeto, a avaliação de MPSoCs baseados em NoCs em baixo níveis de abstração não prove o suporte necessário para encontrar a melhor arquitetura para a NoC considerando métricas de desempenho (e.g. latência, potência) de uma dada aplicação nas fases iniciais de projeto. Dessa forma, o projeto de MPSoCs baseados em NoCs requer modelos simples e precisos em alto nível de abstração, os quais possam gerar resultados precisos de desempenho, de cada alternativa de projeto, em um tempo de projeto razoável.
Neste contexto, a presente Tese tem duas
contribuições principais: (i) desenvolvimento de modelos de NoC abstratos, e (ii) integração dos modelos propostos dentro de um fluxo de projeto baseado em modelos, permitindo assim a exploração do espaço de projeto de MPSoCs baseados em NoCs nas fases iniciais do fluxo projeto.
Palavras chave: NoCs, orientação a atores, modelagem em alto nível de abstração, modelagem de estimativa de potência de NoCs.
ABSTRACT MODELS OF NOC-BASED MPSOCS FOR DESIGN SPACE EXPLORATION
ABSTRACT NoC-based MPSoCs can provide massive computing power on a single chip, achieving hundreds of billions of operations per second by employing dozens of processing cores that communicate over a packet-switched network at a rate that exceeds 100 Tbps. Such devices can support the convergence of several appliances (e.g. HDTV, multiple wireless communication standards, media players, gaming) due to their comparatively high performance, flexibility and power efficiency. Due to the vast design space alternatives, evaluating the NoC-based MPSoCs at lower abstraction levels does not provide the required support to find out the most efficient NoC architecture considering the performance constraints (e.g. latency, power) of a given application at early design process stages. Thus, NoC-based MPSoCs design requires simple and accurate high level models in order to achieve precise performance results, of each design alternative, in an acceptable design time. In this context, the present Thesis has two main contributions: (i) development of abstract NoC models, providing accurate performance evaluation; and (ii) integration of the proposed models into a model-based design flow, allowing the design space exploration of NoC-based MPSoCs at early stages of the design flow.
Keywords: MPSoC, NoC, Actor Orientation, High Level Modeling, NoC Power Estimation Model.
LIST OF FIGURES
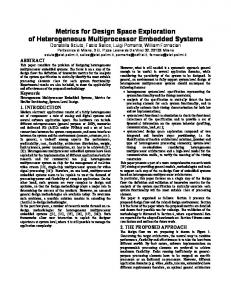
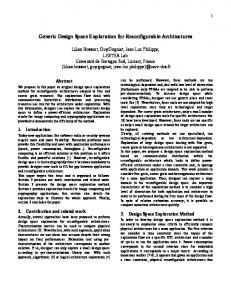
Figure 1 – Examples of expected 4G applications for future portable systems. Figure extracted from [KRE08b]. .................................................................................................................. 18 Figure 2 – Proposed model-based design flow. ............................................................................... 21 Figure 3 - (a) Pyramid of abstraction levels that comprises a system design from the specification to a possible optimal solution. Figure extracted from [KIE99]. (b) Proposed approach location according to the pyramid’s classification. ........................................................................ 24 Figure 4 - Calibration of architectural simulation models. Figure taken from [PIM08]. ......................... 25 Figure 5 – Structural view: actor-oriented model and its hierarchical abstraction. ............................... 26 Figure 6 - Generic structure of the actor (a), example of actor parameters (b) and its pseudo XML description (C). ........................................................................................................... 27 Figure 7 - Actor behavior execution flow during simulation time. Figure based on definitions presented in [LEE03]. ..................................................................................................................... 27 Figure 8 - Proposed design flow. Figure obtained from [PES04]. .......................................................... 32 Figure 9 – Methodology proposed by Xu et. al. Figure obtained from [XU05]. ..................................... 33 Figure 10 - (a) energy model extraction methodology, (b) energy-aware validation flow. Figures extracted from [CHA05]. .............................................................................................. 35 Figure 11 – Example of a CDCG. Figure taken from [MAR05b]. ......................................................... 36 Figure 12 – NoC design flow proposed by Xi. Figure taken from [XI06]. ............................................. 36 Figure 13 - Modeling the MPSoC processing element into a computational graph; (a) Typical microprocessor architecture block diagram; (b) Microprocessor modeled as a computational graph. Figure taken from [EIS06]. ................................................................................. 37 Figure 14 - (a) traffic distribution graph (TDG) example and (b) its corresponding traffic distribution matrix (λ). Figure extracted from [ELM09]. .................................................................... 39 Figure 15 - (a) Y-chart design space exploration flow, and (b) Sesame's model layers. Figures obtained from [PIM06] and [PIM08], respectively. ........................................................................ 43 Figure 16 – A 3 x 4 direct Mesh NoC topology and a generic router architecture. ................................ 48 Figure 17 - Adopted approach for NoC modeling and design space exploration. ................................. 50 Figure 18 - UML sequence diagrams depicting interactions between components of the HERMES NoC. Figure extended from [IND08]. ..................................................................................... 50 Figure 19 - Example of packet flit difference between HERMES and RENATO models. ......................... 51 Figure 20 - Implemented Round-Robin method. ............................................................................ 52 Figure 21 - (a) JOSELITO's packted structure and (b) buffer state machine. ...................................... 53 Figure 22- Unblocked (in the left side) and blocked packet transmission situations. ............................ 53 Figure 23 - Estimated release times regarding blocking-free delivery scenario. ................................... 55 Figure 24 - Packet forwarding situation regarding header blocking. ................................................... 56 Figure 25 - Packet forwarding situation regarding header and trailer blocking. .................................... 57 Figure 26 - ATLAS design exploration flow. ................................................................................... 58 Figure 27 - Latency difference in clock cycles between JOSELITO and HERMES for 3 different traffic distributions: (a) uniform, (b) normal, and (c) pareto on-off and NoC sizes (2x2, 3x3, 4x4 and 5x5), 16 flits packets. .................................................................................................. 59 Figure 28 - Evaluated end-to-end communications (sent communications from node 00 to other NoC nodes). For simplicity only the node 00 is illustrated in the figure. ..................................... 60 Figure 29 - Latency difference between a 4x4 JOSELITO and a 4x4 HERMES for 3 different traffic distributions (uniform, normal and pareto on-off) and 3 different packet sizes (16, 50 and 100 flits). ......................................................................................................................... 62 Figure 30 - Extension of rate-based power estimation flow. ............................................................. 64 Figure 31 - 5x5 NoC and the PowerScope. .................................................................................... 67 Figure 32 – An example of a unified model representation. Figure extended from [MÄÄ10]. ................. 74 Figure 33 - Proposed model-based design flow. ............................................................................. 77
Figure 34 – (a) Example of an application with 4 application blocks. (b) Example of a pseudo C code for the application block A, where the m1 data size constraint of A defines the LENGHTH_X (line 14). ........................................................................................................................... 79 Figure 35 - Resulted mapping of VOPD, automotive, MPEG4 and HDTV applications, according 4 heuristics: SA, Taboo Search, GI and Random. ............................................................... 81 Figure 36
- Average NoC power dissipation (a) and energy consumption (b), for different mapping heuristics and link switching activity. ............................................................................. 81
Figure 37 - Relative power distribution according to the four defined intervals for: (a) 30 %, (b) 40%, and (c) 50% of link switching activity. ........................................................................... 82 Figure 38 - Power values in interval 4 with 50% of link switching activity, during 1 second of simulation. ................................................................................................................................. 83 Figure 39 – Local analysis of hotspot communication zones at the peak power value (SA - 476,03, Figure 38). ........................................................................................................................... 83
LIST OF TABLES
Table I - Comparison of power dissipation (mW) between ORION 1.0 and ORION 2.0. Table taken from [KAH09]. .................................................................................................................... 38 Table II - Related works in NoC-based MPSoCs Power Estimation. .................................................... 41 Table III - Average latency (“L” - clock cycles) and throughput (“T” - % of the relative channel bandwidth) values for two NoC models: HERMES (“H” - RTL model) and JOSELITO (“J” - actororiented model). ......................................................................................................... 60 Table IV - Average (Av.), Standard Deviation (S.D), Minimum (Min.) and Maximal (Max.) end-to-end communication latency values for HERMES and JOSELITO models. Number of packets (# Pkts). ......................................................................................................................... 61 Table V - Speed up of JOSELITO in comparison to RENATO. ............................................................ 63 Table VI - Average power dissipation results using a commercial power estimation tool (PrimePower), rate-based model, and volume-base model (NoC frequency: 50MHz). ................................ 65 Table VII - Average power dissipation results using a commercial power estimation tool (PrimePower), rate-based model, and volume-base model (NoC frequency: 50MHz). ................................ 66 Table VIII - Average Power Dissipation difference between Model RTL and JOSELITO, using random (R) and complement (C) traffic distribution. T1, T2, T3 means 100, 1000 and 10,000 packets with 32 and 64 flits............................................................................................................. 68 Table IX - Average Energy Consumption difference between Model RTL and JOSELITO, using random (R) and complement (C) traffic distribution. T1, T2, T3 means 100, 1000 and 10,000 packets with 32 and 64 flits............................................................................................................. 69 Table X - Speed up of actor-oriented power model in comparison to RTL power model for 3 traffic distributions with 100 packets. ...................................................................................... 69 Table XI - Number of detected hotspots for each power interval, varying mapping, injection rate (30 and 60 fps) and link switching activity (sw. act.). .................................................................. 82 Table XII - VOPD end-to-end communication latency results for different mapping heuristics. Application (A), maximum (Max.), minimum (Min.) and average (Av.). .............................................. 84
LIST OF ABBREVIATIONS APD BCA CABA CDCG CT DE DSP DivX EFSM FSM FPGA GALS GI HDTV IDCT IP IPD KPN LSE LUT MID MMS MoC MPSoC NAM NI NoC PAT PE RPD RTL SA SDF TDG TLM TM VOPD
Average Power Dissipation Bus Cycle Accurate Cycle Accurate Bit Accurate Communication Dependence and Computation Graph Continuous Time Discrete Event Digital signal processing Digital Video Express Extended Finite State Machine Finite State Machine Field Programmable Gate Array Globally Asynchronous Locally Synchronous Greedy Incremental High-definition Television Inverse Discrete Cosine Transform Intellectual Property Instantaneous Power Dissipation Kahn Process Network Liberty Simulation Environment Look Up Table Mobile Internet Device MultiMedia System Model of Computation Multiprocessor System on a Chip Network Animator Network Interface Networks-on-Chip Payload Abstraction Technique Processor Element Relative Power Dissipation Register Transfer Level Simulated Annealing Synchronous Dataflow Traffic Distribution Graph Transaction Level Modeling Timed Multitasking Video Object Plan Decoder
TABLE OF CONTENTS
1. INTRODUCTION.................................................................................................................. 17 1.1 GOALS ........................................................................................................................... 19 1.2 CONTRIBUTION ................................................................................................................ 19 1.3 ORIGINALITY OF THIS THESIS ................................................................................................ 20 1.4 OUTLINE OF THIS THESIS ..................................................................................................... 20 2. ABSTRACT SYSTEM MODELING AND ACTOR ORIENTATION ................................................. 23 2.1 TERMINOLOGY AND BASED CONCEPTS.................................................................................... 23 2.2 ACTOR ORIENTATION ........................................................................................................ 25 2.2.1 Actors.......................................................................................................................... 25 2.2.2 Actors Behavior .......................................................................................................... 26 2.3 DE MODEL OF COMPUTATION ............................................................................................. 28 2.3.1 Discrete Event (DE) ..................................................................................................... 29 3. STATE-OF-THE-ART IN NOC-BASED MPSOC MODELING ....................................................... 31 3.1 NOC MODELING .............................................................................................................. 31 3.1.1 NoC Modeling - Closing Remarks ............................................................................... 33 3.2 NOC-BASED MPSOCS POWER ESTIMATION MODELING ............................................................. 34 3.2.1 NoC-based MPSoCs Power Estimation Modeling - Closing Remarks ......................... 40 3.3 MPSOC APPLICATION MODELING AND MAPPING ..................................................................... 42 3.3.1 MPSoC Application modeling and mapping - Closing Remarks ................................. 45 4. PROPOSED MODELS ........................................................................................................... 47 4.1 NOC BASIC CONCEPTS ........................................................................................................ 47 4.2 HERMES REFERENCE MODEL .............................................................................................. 48 4.3 RENATO MODEL ............................................................................................................. 49 4.4 JOSELITO MODEL ............................................................................................................ 52 4.4.1 Scenario I: Blocking-free delivery ............................................................................... 54 4.4.2 Scenario II: Header Blocking ....................................................................................... 55 4.4.3 Scenario III: Header and Trailer Blocking ................................................................... 56 4.5 EVALUATION OF THE PROPOSED MODELS ................................................................................ 57 4.5.1 Experimental Setup .................................................................................................... 58 4.5.2 JOSELITO Latency and Throughput Evaluation .......................................................... 59 4.5.3 JOSELITO End-to-end Communication Evaluation ..................................................... 60 4.5.4 Limitation of the PAT .................................................................................................. 61 4.5.5 Comparison Between JOSELITO and RENATO Models ............................................... 62 4.6 DEBUGGING AND NOC POWER ANALYSIS USING SCOPES ............................................................. 63 4.6.1 Rate-based Power Model ........................................................................................... 63 4.6.2 Comparison of Power Estimation Models.................................................................. 65 4.6.3 Actor-oriented Power Model ..................................................................................... 66 4.6.4 Comparison between RTL and Actor-Oriented Models for Power and Energy Estimation .............................................................................................................................. 68 4.7 CHAPTER 4 – CLOSING REMARKS .......................................................................................... 70
5. MODEL-BASED DESIGN FLOW FOR NOC-BASED MPSOCS .................................................... 73 5.1 APPLICATION MODEL LAYER ................................................................................................ 73 5.2 PLATFORM MODEL LAYER ................................................................................................... 75 5.3 MAPPER MODEL LAYER ..................................................................................................... 75 5.4 UNIFIED MODEL EXECUTION FLOW ....................................................................................... 76 5.5 MODEL-BASED DESIGN FLOW .............................................................................................. 77 5.6 CASE STUDY .................................................................................................................... 80 5.7 CHAPTER CLOSING REMARKS ............................................................................................... 84 6. CONCLUSION AND FUTURE WORK...................................................................................... 87 6.1 THESIS CONTRIBUTIONS ...................................................................................................... 87 6.2 PUBLICATIONS ................................................................................................................. 87 6.3 FUTURE WORKS ............................................................................................................... 88 REFERENCES ............................................................................................................................. 91
17
1. INTRODUCTION Due to increasing demands on performance (high data rates that continue to go up) several embedded applications (e.g video processing, HDTV, multiple wireless communication standards, gaming) are frequently implemented on multiprocessor systems-on-chips (MPSoCs) [WOL04][KAN06]. MPSoCs increase system performance by employing multiple processors to execute system application tasks1. MPSoCs comprise many processor elements (PEs), like embedded processors, memories, dedicate hardware components, interconnected by a communication infrastructure. Networks-on-chip (NoCs) are employed as the communication infrastructure able to handle MPSoC communication requirements due to its scalability, power efficiency, and support to globally asynchronous locally synchronous (GALS) paradigm [WOL04][PAN05][BJE06]. NoCs2 are composed of cores connected to routers, and routers interconnected by communication channels [BEN02]. However, the adoption of NoCs includes new challenges to the MPSoC design flow, such as choosing a suitable routing algorithm, NoC topology, buffering strategy, flow control scheme, or reducing power dissipation. Due to the vast design space alternatives that these challenges may impose to the final application and its required performance, the evaluation of NoCs become a mandatory step in the MPSoCs design flow [PAN05][BEN06]. The evaluation of NoCs is required to establish a good trade-off between the NoC architecture characteristics and the requirements of the given application. NoC-based MPSoCs are a trend for future portable systems that require high performance while maintaining low power dissipation. Fourth generation systems are examples of mobile internet devices (MIDs) with limited power budget (battery operated), which must be efficiently used for executing several performance demanding applications [BER10]. Figure 1 shows some of the expected 4G applications for future portable systems, such as: (i) three dimensional and holographic gaming, (ii) 16 megapixel smart cameras and (iii) high-definition camcorders. In this scenario, the impact of the power dissipation by the NoC interconnect becomes a critical challenge in the design space exploration3 of such systems [ATI07b][BER10]. For example, NoC infrastructure of two real systems reported by [LEE09] and [KAH09] are responsible for 36% and 28% of the total power dissipation, respectively. Such applications are composed of several tasks running simultaneously. The increasing number of application tasks drives the investigation of more efficient mapping heuristics, which is another challenge in design space exploration of MPSoCs. Task mapping consists of finding the
1
In the context of this Thesis, a task is a behavioral entity (defined according to a set of operations) that compose
2
The main concepts of the NoC are defined in the Chapter 4 of this Thesis.
3
It is defined in Chapter 2 of this Thesis.
18
best placement for the application tasks, in order to fulfill a set of requirements (e.g. minimizing the traffic congestion) [MAR05][HU05][RUG06]. Task mapping is classified as static or dynamic, according to the moment it is defined. In the static approach, tasks are mapped onto PEs at design time. In turn, dynamic mapping defines each task placement at runtime [CAR09].
Figure 1 – Examples of expected 4G applications for future portable systems. Figure extracted from [KRE08b].
Due to the vast number of alternatives in the design space of NoC-based MPSoCs, fast and accurate performance evaluation approaches can result in earlier - and often better - design decisions. Modeling at higher abstraction levels is a common practice to increase and simplify development and validation of complex systems, as MPSoCs [JAN03]. The simulation speed, the improved observability, and debugging capabilities provided by higher-level models reduce design space exploration time [ZEN10]. In this work, modeling is defined as the practice of implementing or modifying a model (system description) or even part of it, using some formalism (e.g. programming languages) with respect to a given specification4. A model is a simplification of another entity, which can be a physical thing or another model (that can be a simplification of the previous model). As defined in [JAN03], a model has to include exactly those characteristics and properties of the modeled entity that are relevant for a given purpose (e.g. prediction of the worst-case execution time of an application). In this context, model-based design was introduced recently as an efficient way to develop complex systems (e.g. automotive systems) by combining models, tools and design methodologies resulting in earlier design decisions that are necessary to respect the time-to-market frame5 of these systems [KRE08][NIC09][ZEN10].
4
As defined in [BLA04], the system specification is the top technical document for designing a system. The system specification is language-independent and it has to provide, for instance, behavioral and temporal properties of the system.
5
The time interval between the product concept generation and its introduction in the market.
19
In this perspective, the most promising technique to explore the complex design space of NoC-based MPSoC platforms is to build simpler, more abstract models of applications and platform components, and to evaluate the impact of alternative compositions on, for example, performance and power dissipation. The accuracy and speed of such evaluation must be high, and the effort to build and compose such models must be very low, so that they can provide meaningful results early on the design flow. The foregoing context provides the motivation for this Thesis, which aims at integrating a set of tools and actor-oriented models into a model-based methodology developed into the Ptolemy II framework. The proposed methodology flow enables flexible modeling and joint validation of application and platform models under different constraints, mappings, and configurations, allowing the design space exploration of NoC-based MPSoCs at early stages of the design flow.
1.1 Goals The strategic goal of this Thesis is to propose a semi-automated model-based design flow that allows early performance analysis of different design alternatives of NoC-based MPSoCs6, focusing on homogeneous processor platforms only. To accomplish this strategic goal, the following specific objectives should be fulfilled: propose accurate actor-oriented NoC architecture models; define a validation7 metric in order to compare the accuracy of the proposed NoC models with the adopted reference RTL model; support the joint validation of applications mapped onto the platform model; support the use of static mapping heuristics; support an accurate NoC power estimation at early stages of the MPSoC design flow; propose an integrated design flow by providing semi-automated and easy to use toolset that enable design space exploration of NoC-based MPSoCs;
1.2 Contribution This Thesis has two main contributions: (i) development of abstract NoC models, providing accurate performance evaluation; (ii) integration of the proposed models into a model-based design flow. As a summary, such contributions can be detailed as follows: Modeling contributions: 1. simple and flexible NoC architectures modeling providing accurate performance estimation results (e.g. latency and throughput) when compared to RTL models;
6
It is important to mention that the present work is performed on homogeneous processor platforms only.
7
Here, validation means the process of comparing the model results with a reference model.
20
2. a technique that can be applied to wormhole packet switching NoCs to reduce the simulation time, with high accuracy of latency, throughput and power estimation; 3. increased observability, allowing the analysis of different performance metrics over simulation time using actor-oriented monitor models attached to a graphical interface; Design flow contributions: 1. integration and extension of an accurate power estimation model into an abstract and parameterizable actor-oriented NoC model; 2. integration of mapping heuristics that can be used to define the most power/latencyefficient placement of applications onto the MPSoC platform; 3. modeling and validation of real applications using the actor-orientation and UML; 4. automatic transformation of application models (using actors and UML) to graph description (used for mapping purpose) and to pseudo C code (used for traffic injection purpose) that can be executed by HEMPS platform;
1.3 Originality of this Thesis The originality of this Thesis is in how the applications and platforms are jointly modeled and validated. Figure 2 summarizes the present work, proposing a complete NoC-based MPSoC validation flow. Application modeling includes actors and executable UML sequence diagrams, to enable the description of actual embedded applications (A). The application representation can be automatically converted to pseudo C code (used for traffic injection purpose) and to graph description (used for mapping purpose) (B) (C). Platforms, also described with actors, enabling fast design exploration and system debugging by using scope actors that are responsible to monitor some performance figures (D). Performance figures are generated during the joint validation of application model mapped onto the platform model (E), keeping the accuracy of lower abstraction levels (F).
1.4 Outline of this Thesis This Thesis is organized as follows. Chapter 2 presents basic concepts related to high level modeling and actor orientation. In sequence, related works in NoC-based MPSoC modeling approaches are presented in Chapter 3. Chapter 4 presents the development and the validation of the proposed abstract NoC models, as well as the integration of a NoC power estimation model into an actor-oriented model. Chapter 5 presents the integration of the proposed models into a model-based design flow. Finally, Chapter 6 points out conclusions and directions for future work.
21 Application Model with actors and UML Diagrams m1
(A)
AB1
AB4 internal view
Application Modeling
AB1
m2
AB2
T2
AB3 T1
AB2 m1
m6
m5
AB4
m6
m5
M 1
m1 m2 m3
m4 m5
m4
m6
m6
m5
AB1.c
AB2.c
AB3.c
AB4.c
M 2
3 M
AB1
AB4
Pseudo C Description
CWM Graph Description
Application graph and C code Generation
AB3 UML Sequence m3 Diagram
m2
m4
m4
AB3 A
3s
m
AB2
M 5
(B)
Director
m3
AB4
CAFES´ Mapping AB3
AB1
NoC
AB2
AB4
NoC Characterization
(D)
Platform and Scopes Selection
NoC
Scopes
NoC Dimesion
PowerScope
Buffer depth
ChannelScope
Number of Virtual Channels
BufferScope
Control Flow
Point2pointScope
HopSpotScope
Vergil (PtolemyII Interface)
(E)
Calibration
(C)
Mapping Files
Mapping heuristics (CAFES)
Hemps Mapping File
Unified Model Simulation (Ptolemy II)
NoC Dimension 2x2 [allocated tasks] AB4.c router 00 .. .
Pseudo C code #include "../../task.h" Message m4, m5, m6 m4.lengh = 128; .. . Receive(m4, AB3); .. .
Hemps Editor
(F)
Reports and Analysis Results
Constraints ok?
AB
Figure 2 – Proposed model-based design flow.
22
23
2. ABSTRACT SYSTEM MODELING AND ACTOR ORIENTATION High level abstraction modeling of NoC-based MPSoCs is an emerging approach to handle the vast design space alternatives of such systems. However, the terminology and some concepts are not well established. The following Sections present the terminology that is used in this Thesis, as well as define the basic concepts and features related to abstract system modeling and actor orientation.
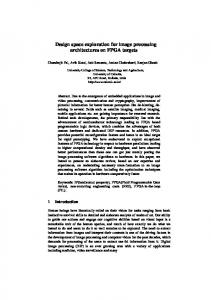
2.1 Terminology and Based Concepts System-level modeling has been used to increase the design productivity of NoC-based MPSoCs. In this context, modeling and simulation at high abstraction levels are used to increase and to simplify the development and the validation of NoC-based MPSoC, since not suitable alternative designs can be disqualified (design space reduction) in a shorter time [CAI04][JAN04][KOO08]. According to Mohanty e.t al. [MOH02], design space exploration is the process of analyzing several implementation alternatives to identify an optimal solution. Such alternatives are not identical but they have to perform the same functions and to provide the same utility. As defined in [KIE99], the design space exploration is a trade-off between three issues: modeling effort, evaluation speed, and accuracy of the obtained results when compared with a reference model. Figure 3 (a) illustrates the abstraction pyramid that represents the three issues in performance modeling8, which are organized in different abstraction levels according to the modeling and evaluation cost. The high level modeling activity is a trade-off between level of details and model confidence [BRO96]. The level of detail refers to the structural and behavior abstraction of the system components. The structural abstraction means the granularity of a data storage and the number of included components and their interconnects. The behavioral abstraction includes how and when the components update their internal state and concurrently interact with other components (e.g. how the memory is accessed by a processor). The model confidence means how useful the model is for a particular purpose for instance in terms of accuracy when compared to a reference model. Figure 3 (b) places the proposed approach (which is detailed in Chapter 4 and 5 of this Thesis), according to the pyramid internal structure. As shown in Figure 3 (b), the proposed approach allows flexible modeling, by employing accurate and abstract executable models that can be used to design space exploration of NoC-based MPSoCs before it goes down to the RTL execution (HEMPS), which is then used to identify the optimal design solution. It should be clear that design space exploration discussed in this Thesis is not restricted to the architecture
8
A detailed description of each issue in performance modeling can be found in [KIE99].
24
modeling, as proposed in [KIE99], it refers to the space of application-mapping-NoC platform from an overall system design point of view.
Specification
Specification
High
High Low
cycle accurate models
optimal solution
alternative realizations
(a) abstraction pyramid
abstract executable models executable application models executable mapper model executable NoC platform models cycle accurate results
Proposed approach
cycle accurate models
synthesizable RTL models Low
High
Explore
optimal solution (HEMPS execution)
Cost of Modeling/Evaluation/ Level of detail
abstract executable models
estimation models Opportunities/Abstraction
estimation models
synthesizable RTL models Low
Low
Explore
Cost of Modeling/Evaluation/ Level of detail
Opportunities/Abstraction
not suitable alternative
High
alternative realizations
(b) proposed approach location
Figure 3 - (a) Pyramid of abstraction levels that comprises a system design from the specification to a possible optimal solution. Figure extracted from [KIE99]. (b) Proposed approach location according to the pyramid’s classification.
In addition to modeling aspects mention above, model calibration and model validation have received more attention [PIM08]. The model calibration process provides the connection between the high level model and the lower levels of design abstraction, in order to achieve accurate performance results. The model calibration is fundamental to adjust the model’s parameters (e.g. router arbitration time), since accurate system modeling becomes especially important to the design of complex systems like NoC-based MPSoCs [ZEN10]. In turn, model validation is the process of comparing the model results with a well known datasheets, documentation (e.g. data) or even a reference model, usually implemented in a lower level [BRO96][PIM08]. Figure 4 shows the relation among model calibration, model validation, and model simulation. In terms of model simulation, a set of simulation-based environments have been proposed, such as: Metropolis [BAL03], MESH [PAU05], Ártemis [PIM06], SIMULINK [MAT08] and Ptolemy II [LEE03], adopted in this Thesis. These environments can be very useful to the design space exploration of complex systems, since they allow capturing the behavior of the system components and their interactions at a high level of abstraction [PIM08]. Such environments, with exception of SIMULINK, are described and classified in [GRI04] considering different modeling aspects. It is out of the scope of this Thesis to investigate and to present a review of simulationbased environments characteristics. Documents like [GRI04] and [DEN06] can be used for such purpose.
25
Model Parameters
(system-level) simulation model
calibration
performance estimates
Datasheets/ Documentation
validation
Low-level simulator
(Prototype) Implementation
Figure 4 - Calibration of architectural simulation models. Figure taken from [PIM08].
Ptolemy II has been chosen because previous works used in this Thesis (e.g. supporting a set of directors to include the possibility of co-simulate UML sequence diagrams) were already implemented under this environment [IND07][IND07b]. Besides, Ptolemy II is an open-source component-based design tool that can be extended to support addition components and features, as done in this Thesis. As defined in [LEE03], Ptolemy II consists of a set of Java packages that provide a framework for modelling, simulation, and design of concurrent systems, implementing an actor-oriented design methodology.
2.2 Actor Orientation Actor orientation design is a component methodology, which separates the functionality concerns (modelled as actors) from the component interaction concerns (modelled as frameworks) [LEE03]. Actor orientation is a widely accepted paradigm in system level design and its main components are actors [LEE04]. 2.2.1 Actors Actors are classified as atomic or composite. An atomic actor is a simple capsule that executes a sequential computation (Java class). Atomic actor cannot contain other actors, while composite actors are those composed of other actors, allowing different models of computation (MoCs) to be specified at different levels in the hierarchy. Figure 5 illustrates a basic actor-oriented model, which consists of two levels of interconnected actors that are managed by different directors (director 1 and 2). In this context, each director manages the execution of its MoC, defining the flow of control and the actors’ communication semantics. The upper part of Figure 5 shows the top model that is composed of two actors (A and B), where the composite actor A represents an abstraction of its internal functionality (model at the bottom of the hierarchy).
26
Director 1
input ports
tokens type
type
type
Atomic actor B
Composite actor A Action Methods
channel
Action Methods
Actor D
Director 2
Action Methods external input ports
output ports
external output port
Actor C Actor E
Action Methods relation
Action Methods
Figure 5 – Structural view: actor-oriented model and its hierarchical abstraction.
As shown in Figure 5, the communication between actors A and B is based on data tokens exchange through channels, which establish the relation among the actors connecting their input and output ports. The tokens transmitted among actors can encapsulate a single value (e.g. int type), as well as tokens that contain different tokens types identified by a name (so-called record tokens). Figure 6 (a) represents a generic structure of an actor composed of a set of input and output channels used to pass tokens to other ports. In addition to ports, actors may have parameters. Figure 6 (b) shows the set of parameters of the TLMBuffer actor, for instance its storage capacity (capacity parameters defined to have 8 positions, period and delay). In addition in Figure 6 (c), a pseudo XML description of TLMBuffer actor is illustrated.
2.2.2 Actors Behavior The actor behaviour execution is defined according to the action methods, which are public methods of the actor that implement its functionality as a part of a simulation. The execution of these methods has a sequential order during the model simulation, to provide preparation, data processing and finalization to the actor’s workflow into the simulation. Figure 7 illustrates the sequential order that such action methods are invoked during the model simulation. The sequential order is organized in three main periods: (i) initialization – 1 occurrence during the simulation, (ii) iteration - multiple occurrences during the simulation, and (iii) finalization - that occurs only one time at the end of model simulation.
27 ACTOR CHANNEL
PORT ACTOR PORT TOKEN
PORT
DATA
ACTION METHODS Unpackage Data
Package Data
Process Data
PARAMETERS
(b)
(a)
1. 2. 3. 4. 5. 6. 7. 8. 9. 10. 11. 12. 13. 14. 15.
(c)
Figure 6 - Generic structure of the actor (a), example of actor parameters (b) and its pseudo XML description (C).
ACTOR BEHAVIOR
Actor
Director preinitialize()
initialize ()
prefire ()
Model simulation time
fire()
posfire()
wrapup()
1 occurrence INITIALIZATION begins the simulation
Multiple occurrences ITERATION process data during simulation run
1 occurrence FINALIZATION ends the simulation
Figure 7 - Actor behavior execution flow during simulation time. Figure based on definitions presented in [LEE03].
28
2.2.2.1
Initialization
The initialization period is composed of two execution methods: preinitialize() and initialize(). The initialization period starts with the preinitialize() method call, which is often used to set type constraints and to analyse the model consistency (e.g. type inference, checking for deadlock [GOD09]). This method is called exactly once before any other behaviour method is called. The initialize() method is invoked next, and is typically used to initialize state variables (generally depending on type resolution) in the actor. After the initialize() method, multiple iterations can occur according to the model characteristics. 2.2.2.2
Iteration
Initially, an iteration is defined as exactly one occurrence of prefire(), some occurrences of fire(), and at most one occurrence of postfire(). Finally, the actor execution ends with a call to wrapup(). Prefire() method is used to verify the condition for firing of the actor. If the Actor is ready, it returns a Boolean true. The prefire() method can also be used to perform an operation that will happen exactly once per iteration (e.g. read a file with some data that is sent from an actor to another one). The fire() is not called until the prefire() returns true. The fire() method is the main point of an actor execution and is generally responsible for reading input tokens from input ports and, if necessary, producing tokens to outputs ports [GOD09]. Another possibility is reading parameter values to apply to input tokens or even generated an output depend on them. The postfire() method determines whether the execution of an actor is complete. The return value of postfire() is a Boolean that indicates to the model director whether execution of the actor is complete. In case, the model director will not call prefire(), fire(), or postfire() again during this execution of the model. 2.2.2.3
Finalization
The wrapup() method is typically used for displaying final results. It is called exactly once for each actor to finish the execution of a workflow.
2.3 DE Model of Computation A MoC is defined in [LEE03], as a set of rules that guide the interaction among actors, defining how concurrency and time affect the way actors communicate and behave. The most important differences between MoCs are the way they deal with concurrency, the way the components communicate with each other, and finally how time is modeled. Examples of MoCs implemented in Ptolemy II include: (i) continuous time (CT), (ii) finite-state machine (FSM), (iii) synchronous dataflow (SDF), (iv) timed multitasking (TM), and (v) discrete-event (DE), which is briefly described here. A detailed description, classification and more comprehensive discussion of
29
MoCs can be found in [JAN03], as well as in documents offered by Edward Lee and his team in the Ptolemy II manuals9. 2.3.1 Discrete Event (DE) The DE is a well known MoC for specifying digital hardware and for simulating telecommunications systems. A large number of simulation environments for digital hardware description and simulation follow a predefined DE MoC (e.g. Modelsim). In DE MoC actors communicate through sequences of events placed in time, along a real-time line. Actors under this MoC communicate by triggering events, where one event is understood as the pair formed by a token and a time stamp. The DE scheduler processes the events chronologically according to the time stamp by firing those actors whose available input events are the oldest – the token with the earliest time stamp. Time stamp is defined as a numerical value that is interpreted as the time at which the communication occurs [GOD09]. The current time in the executable model is referred as the model time. The DE Director increments the model time when all events with time stamps equal to the model time have been processed. From the actor point of view, the DE Director calls fire() every time that a valid Token is in the input. When no more tokens are available to be passed, meaning that all events have a time stamp earlier than the model time, the Director stops the simulation and calls the wrapup() method. Simultaneous events are those with the same time stamp. This implementation handles simultaneous events systematically and deterministically, supplying an important characteristic by prioritizing such events. As defined in [JAN03], another important characteristic of this MoC is the efficient structure of the global event queue, which minimizes the overhead associated with handling a large number of events.
9
Available at: http://ptolemy.eecs.berkeley.edu/ptolemyII/index.htm.
30
31
3. STATE-OF-THE-ART IN NOC-BASED MPSOC MODELING This Chapter surveys the state-of-the-art in NoC-based MPSoC modeling approaches, according to different criteria: (i) high level NoC modeling, (ii) NoC-based MPSoC power estimation, (iii) application modeling and mapping. This survey gives special attention in the development of high-level models/approaches that can be easily employed for early-stage NoCbased MPSoCs design space exploration purposes.
3.1 NoC Modeling As defined in [PAN05] [BJE06], modeling NoC interconnects through abstract models is the first means to approach and understand the required architecture and the impact of the traffic within it. This Section surveys these approaches while Section 3.1.1 discusses them. In this context, some research groups try to adapt generic network simulators to the intra-chip environment, while others propose tools/frameworks and techniques to specify, simulate and generate NoCs. Examples of generic network simulators used in this context are NS-210 and OPNET11. NS-2 is a general purpose network simulator that gives support to describe the network topology, the communication protocols, routing algorithms, and traffic (e.g. random traffic) [SUN02]. NS-2 provides simulation traces for interpreting results and a graphic aid to observe network message flows called NAM (Network AniMator). NS-2 is open source, allowing code modification in order to add new protocols and functionalities. The NS-2 is also used in [ALI06], where the authors present some pros and cons for the use of NS-2 network simulator for simulating NoCs. One limitation of using NS-2 is the fact that it does not support the power estimation, an important cost function of the NoC design. OPNET is also a general purpose network simulator used to simulate NoC-based architectures [XU04]. OPNET presents some disadvantages to model NoCs, including: (i) it does not allow setting a time unit smaller than 1 second; (ii) distance between nodes in the network is measured in meters only; (iii) OPNET assumes only asynchronous communication. Specific tools/frameworks have been proposed to describe, generate, verify and evaluate NoC components, taking into account their specificities (e.g. network interface, NI). The developed tools also allow traffic modeling and generation for different traffic scenarios, which can be defined by the designer. Examples of specific tools/frameworks for design exploration of NoCs, available in the literature, include: (i) Kogel’s framework [KOG03], (ii) NoCGEN [CHA04], (iii) OCCN [COP04], (iv) Pestana’s approach [PES04], (v) Xu’s methodology [XU05], and (vi) NetChip synthesis
10 Available in: http://www.isi.edu/nsnam/ns/. 11 Available in: http://www.opnet.com.
32
flow [BER05]. Kogel et al. [KOG03] propose a modular framework for system level exploration of the onchip interconnection architecture using TLM abstraction. The framework has a library of different network modules with configurable topologies and arbitration protocols, which can be used to define the NoC architecture that will be simulated. Besides, it allows capturing performance metrics as latency and throughput of different NoC configurations. However, the accuracy of such results was not discussed in this work. NoCGEN creates VHDL NoC descriptions used for simulations and synthesis [CHA04]. This tool uses a set of parameterizable templates to build routers, varying the number of ports, routing algorithms, data width and buffer depth. Besides NoC parameterization, it uses a mixed SystemC/VHDL simulation environment. The evolution of this work was presented in [CHA08], which describes the NoCGEN integration into a design methodology for generating optimized application specific NoC topologies. The OCCN framework proposed by [COP04] enables the creation of NoC architectures at different abstraction levels, protocol refinement, design exploration, and NoC component development and verification based on a communication API. The OCCN methodology has been adopted by Dumitrascu et al. [DUM06] in order to analyze the effectiveness of inter-module communication and for components adaptation. In this approach, the communication architecture performance evaluation is based on cycle-accurate co-simulation. Pestana et al. present in [PES04] a NoC design flow, illustrated in Figure 8, which uses a NoC simulator described in SystemC. Applying the proposed flow, the designer specifies in three files NoC topology, IP to NoC mapping and detailed interconnections. These files are used by a XML parser to instantiate the NoC-based system (VHDL description), which will be simulated. The simulator also allows describing traffic generators to evaluate the performance metrics (e.g. throughput) of NoC instances. A case study, in which different synthetic traffic workloads are injected in the NoC, was described in [PES04] to demonstrate the main steps of the proposed design flow.
Figure 8 - Proposed design flow. Figure obtained from [PES04].
33
Xu et al. [XU05] present a low-level methodology for modeling, designing and analyzing different NoC architectures based on the application communication behavior. Due to its low level abstraction (RTL and gate-level), this approach can accurately estimate the performance, power, and area of several NoC architectures. This work uses the following tools: OPNET, Design Compiler, and SPICE. Due to the use of SPICE, electrical simulation, modeling and simulation are time consuming, which is not appropriated for rapid design space exploration.
Figure 9 – Methodology proposed by Xu et. al. Figure obtained from [XU05].
Bertozzi et al. [BER05] propose the NetChip synthesis flow, which allows the exploration of different NoCs topologies (such as mesh, torus, hypercube, Clos, and butterfly). The NetChip flow is composed of three phases: (i) NoC topology mapping, (ii) selection, and (iii) generation (SystemC model that can be simulated at a cycle and signal accurate level). Additionally, an input core graph, obtained with the SUNMAP tool, is used in the mapping phase [MUR04]. Then, the SUNFLOOR tool is used to synthesize the most power and performance efficient NoC topology that satisfies the application requirements [MEL06]. 3.1.1 NoC Modeling - Closing Remarks Making an overview of the NoC modeling researches, it is possible to verify that the NS-2 and OPNET network simulators do not consider some particularities that are necessary to the NoC design. High-level abstract models of NoCs are proposed with different buffering strategy, flow control, arbiters and virtual channels. Besides NoC architectures, an important effort was done to provide faster analyses of performance metrics of NoCs, which is a mandatory step to find out the best trade-off between architecture and data rates. Most proposed techniques or tools allow the emulation of the NoC in different abstraction levels, considering different architectures (e.g topology, router) and traffic conditions. In many cases, the simulation occurs in TLM (transaction level model) style, which demands less design and simulation time compared to RTL descriptions. However, the accuracy of those high level models is
34
influenced by the structural and behavioral abstractions. One contribution of the proposed work, when compared to the reviewed NoC modeling works, is a novel technique that can be applied to wormhole packet switching NoCs to reduce the simulation time, with high accuracy of latency, throughput, and power estimation. This technique is described in Chapter 4.
3.2 NoC-based MPSoCs Power Estimation Modeling This Section surveys the state-of-the-art in NoC-based MPSoC power estimation models, which are discussed and compared in Section 3.2.1. This survey focuses on high-level models that can be used for design space exploration at early stages of the design flow. Hu et al. [HU03] present an energy estimation model based on the traffic flow in the NoC's building blocks (routers and interconnection wires). The authors make use of the bit energy concept [YE02], which represents the amount of energy consumed in the transmission of a data bits throughout the NoC (in its routers and interconnection wires). This model evaluates the energy consumption in an end-to-end transmission only. Equation (1) describes the model energy consumption estimation, for a single data transmission between two points of the NoC.
Ebithops
nhops
ESbit
(nhops 1) E Lbit
(1)
In Equation (1), ESbit is the energy consumption in one router; ELbit is the energy consumption of the interconnection wires; and nhops is the number of routers used in the data bit transmission. This work was extended in [CHA05b], which evaluates the average energy consumption while sending a data bit from point ti to point tj. The energy consumption is given by the summation of the energy spent in the routers and communication wires that link these two points through a given route. Banerjee et al. [BAN04] present a set of power models of NoC's components. To build this model, the authors synthesize the RTL NoC description, which contains the routers and the interconnection wires. SPICE simulation is used to compute the power consumption for each basic block. Adding the contribution of each block, they obtain the power consumption of each module. The router power consumption is then obtained with the summation of the modules that compose its structure. Wolkotte et al. [WOL05] present simple energy models based on the average energy per bit that cross through the router. The power dissipation of packet-switched and circuit-switched routers (synthesized VHDL-designs) are estimated using Synopsys Power Compiler according different scenarios (variable number of concurrent data-streams with a variable load between 0% and 100%). The router power dissipation is calculated based on four parameters: (i) the average load of every data stream; (ii) the amount of bit-flips in the data stream; (iii) the number of concurrent data streams; and (iv) the amount of control overhead in a router. Authors use a linear
35
model based on [WOL05b], to calculate the link power dissipation when transporting a single bit between routers. Finally, a comparison between the energy consumption of the two NoCs and a bus based system is presented. Results show the benefit, in terms of energy consumption, when using NoCs for a larger number of processing tiles. For example, for 25 tiles the energy consumption for the bus is more than 30 pJ/bit, while a packet-switched NoC is less than 10 pJ/bit. Chan et al. [CHA05] describe an energy macro-model extraction methodology for a NoC packet switched router, called NoCEE and illustrated in Figure 10 (a). NoCEE employs linear regression to define a macro-model (relationship between NoC events and energy consumption). Thus, regression analysis requires both the dependent variables (energy consumption values extracted from technology libraries and gate-level power simulation) and the independent variables (macro-model parameters), as well. Different input traffics (varying the injection rate) extracted from synthetic application traces are applied to the resulting NoC macro-models in order to calculate the energy consumption of a NoC router from simulation (steps 8 and 9 in Figure 10 (a)). Results show an average error of 5% when compared to PrimePower tool (Figure 10 (b)).
(a)
(b)
Figure 10 - (a) energy model extraction methodology, (b) energy-aware validation flow. Figures extracted from [CHA05].
Marcon et al. [MAR05][MAR05b] propose an energy estimation model based on the computation and communication dependencies in the cores of a NoC. Authors make use of the Hu et al. [HU05] assumption, which states that the energy consumption of an application can be reduced up to 60% by applying different application mapping algorithms in the network. In this work, applications are modeled as a directed graph called the communication dependence and computation graph (CDCG), where: the set of nodes P have all the packets exchanged by any pair of communication cores during the application. There are two special nodes called Start and End (as illustrated in Figure 11). The set of edges D has all communication dependencies in the application. The elements of P are quadruples with the form of Pabq c a , cb , t aq , wabq , where ca, cb C, and Pabq is the q-thiest packet sent from ca to cb. This packet has wabq bits and is transmitted after a computational time taq in the source core (ca). The set of all transmitted packets form ca to cb is called Pab. The CDCG represents the computation and communication of an application composed of any number of cores. In this graph, the direction of the edges represents a
36
communicational dependency between the two communicating nodes.
Figure 11 – Example of a CDCG. Figure taken from [MAR05b].
Xi et al. [XI06] present the integration of mathematical power/energy models of NoC components (e.g. input buffers) into a SystemC transaction level NoC simulation framework. During the simulation, each corresponding mathematical model receives the number of transactions occurred in the router or among then, in order to calculate the dynamic and leakage power of each one. Different traffic patterns (e.g. burst period from 10us to 15us) are applied on the same mesh-NoC to evaluate its power dissipation. Experiments on eight deep sub-micron CMOS processes (from 180nm to 45nm), were used to validate the proposed flow, illustrated in Figure 12. Authors did not mention the accuracy of the NoC components power models.
Figure 12 – NoC design flow proposed by Xi. Figure taken from [XI06].
Eisley et. al. [EIS04][EIS06] employ a framework that takes as input message flows, and derives a power profile of the network fabric. The authors map the CPU datapath as a graph, and the application as a set of messages that flow in this graph, as illustrated in Figure 13. Those mapped CPUs are connected into the network fabric, mapping the entire MPSoC as a network. The
37
authors make use of a network power estimation tool, called LUNA, to evaluate the power dissipation of the entire MPSoC.
Figure 13 - Modeling the MPSoC processing element into a computational graph; (a) Typical microprocessor architecture block diagram; (b) Microprocessor modeled as a computational graph. Figure taken from [EIS06].
Atitallah et al. [ATI07][ATI07b] use a stack of abstract models. The higher abstraction model, named Timed Programmer View (TPV), omits details related to the computation and communication resources. Such abstract model enables designers to select a set of solutions, to be explored at lower abstraction levels. The second model, CABA (Cycle-Accurate Bit-Accurate), is used for power estimation and platform configuration. Results present an error of 8% in power estimation compared to a physical measure and 17% of simulation speed-up. Beltrame et al. [BEL07] develop a SoC power estimation method based on SystemC TLM modeling strategy. It adopts multi-accuracy models, supporting the switch between different models at run-time according to the desired accuracy level [BEL06][BEL08]. The authors validate their model using the STBus NoC, and an analytical power model of this NoC. An MPEG4 application was tested, achieving up to 82% speed-up compared to TLM BCA (bus-cycle accurate) simulation. Wang et al. [HAN02] present ORION, a NoC simulator that enables the evaluation of performance and the power dissipation of different NoC architectures. ORION was built upon the Liberty Simulation Environment (LSE) framework [VAC02]. In the LSE framework, hardware blocks are modeled as logical functional modules that send data through ports. Each functional module is composed of parameters and input/ouput ports. For example, considering a FIFO buffer as a functional module, the buffer size can be a parameter and it can be composed of read and write
38
ports. The NoC component power models are defined from a set of equations that are calibrated using HSPICE and the Berkeley Predictive Technology Model12. An extension of ORION 1.0 was later implemented by Kahng et al. [KAH09]. The ORION 2.0 was developed to improve the accuracy of the original ORION 1.0 power models, including new subcomponent power models (e.g. clock and link power models), area models (e.g. detailed router floorplanning13), and updated technology models (e.g. designs beyond the 65nm technology). The Intel 80-core Teraflops chip and the Intel Scalable Communications Core (Intel SCC) were used as case studies in order to validate the new NoC power models of the ORION 2.0. As presented in Table I, ORION 2.0 presents a small difference when compared to two recent NoC prototypes (e.g. 11% of the corresponding total power value for the Intel SCC, while the difference using ORION1.0 is 202,4%).
Table I - Comparison of power dissipation (mW) between ORION 1.0 and ORION 2.0. Table taken from [KAH09]. Intel 80-core %difference (total power)
Intel SCC
ORION1.0
ORION2.0
ORION1.0
ORION2.0
-85.3
-6.5
202.4
11.0
Koohi et al. [KOO08] present a NoC power and performance analysis with different traffic models, using analytical models. The authors targeted a NoC with a mesh topology. The employed traffic models are: (i) uniform, (ii) local, (iii) hot-spot and (iv) matrix transpose. Results were compared to Synopsys Power Compiler and Modelsim, showing an error of 2% for power estimation and 3% for throughput. Matsutani et al. [MAT08] propose a NoC power estimation model based on commercial power estimation tools. The Authors synthetize the evaluated NoC using the Synopsys Design Compiler tool, then the Synopsys Astro tool is used to design the NoC clock distribution tree. The NoC Verilog netlist is simulated using the Cadence Verilog-XL tool and a circuit value change dump (VCD) file is obtained. The authors use the Synopsys Power Compiler tool to perform the NoC power estimation. Elmiligi et al. [ELM09] propose a topology-based methodology that explores the impact of the NoC topology on system power dissipation. It uses a partitioning algorithm that aims to achieve minimum inter-partition traffic. This methodology uses graph-theoretic concepts (e.g. connectivity matrix) to acquire the optimum NoC topology that reaches the lowest power dissipation for a given application. NoC topology is modeled as traffic distribution graphs (TDGs), G = (V, E, Ψ), where each node vi V represents a PE (as illustrated in Figure 14). E is a set of edges
12 Available at: http://ptm.asu.edu/. 13 Clein [CLE00] defines floorplanning as a process that is used to identify structures that should be placed close together, and to allocate space for them in such a manner as to meet the sometimes conflicting goals of available space (cost of the chip).
39
that represent the logical communication channels between PEs. Ψ is the graph mapping incident function Ψ : E → V x V, which maps an edge onto a pair of vertices (vi ,vj). Each edge eij E has a weigh factor λij that represents the average number of packets per time step transmitted from vi to vj, 1 ≤ i; j ≤ n; where n is the number of PEs. Results show the impact of the number of ports and buffer depth on the total router power dissipation. A MPEG4 application was used to verify the efficiency of the proposed methodology.
Figure 14 - (a) traffic distribution graph (TDG) example and (b) its corresponding traffic distribution matrix (λ). Figure extracted from [ELM09].
Lee et al. [LEE09] propose a power estimation framework for SoCs, using power profiles to produce cycle accurate results. The SoC is divided in its building blocks (e.g. processors, memories, communication and peripherals) and the power estimation is based on the RTL analysis of each component. The authors validate the framework using an ARM926EJ-S CPU and the AMBA AXI 3.0 as NoC. Results have a maximum error of 10% compared with a gate-level power evaluation, and an average error of 5%. Speed-up compared to a gate level simulation is in average 100 times faster. Milojevic et al. [MIL09] describe the 3MF MPSoC, a NoC-based MPSoC platform for lowpower video coding applications (e.g. HDTV, AVC/H.264, MPEG4). The 3MF MPSoC platform is composed of 13 IPs (e.g. six ADRES processors [VER05], one ARM and 4 memories) interconnected by the Artemis NoC infrastructure [PIM01]. The power dissipation of three different implementation scenarios of the platform (e.g. application mapping, arbitration) were evaluated. Results show that the difference in the power dissipation can achieve 26% due to the application mapping (comparing the worst and the best case application mapping). Anagnostopoulos et al. [ANA10] propose a systematic methodology to reduce the NoC overall temperature, employing three different techniques: (i) power-aware routing algorithms, (ii) buffer sizing and (iii) direct connection. This methodology can be applied to both 2D and 3D NoC designs. The temperature optimization is achieved by mapping the application to the selected NoC architecture, using a bandwidth-constraint mapping algorithm. The next step in the proposed methodology is to obtain thermal profiles for the mapped NoC, using a high-level NoC simulator.
40
In this step, three different power-aware routing algorithms can be selected, different buffer sizes and direct connection links between two highly communicative routers can be implemented. The thermal profiles of these NoC architectures are obtained using a HotSpot tool (a gate-level thermal estimation tool). The authors present some results regarding the mapping of three DPS applications (VOPD, MPEG-4 and MMS) onto a 8x8 2D and a 4x4 3D mesh NoCs. Results show that the proposed methodology achieved an average temperature reduction of 13 ºC for the 2D NoCs and 22 ºC for the 3D NoCs, respectively, without performance penalty. 3.2.1 NoC-based MPSoCs Power Estimation Modeling - Closing Remarks The detailed estimation of NoC power dissipation at transistor or gate level is timeconsuming due to the NoC’s high component count and complexity. Thus, authors proposed abstract models of NoC-based MPSoCs to accelerate and to optimize the power estimation analysis while coping with the complexities of the interconnect architecture and implementation. In this context, TLM is adopted by Atitallah [ATI07b], Lee [LEE09], Beltrame [BEL07] and Xi [XI06]; algorithmic descriptions by Elmiligi [ELM09], Marcon [MAR05][MAR05b], Hu [HU03], Eisley [EIS06] and Koohi [KOO08]. Most of the approaches in Table II calibrate their high-level models using a reference design model to achieve more accurate power estimation (fifth column). For instance, [ELM09] and [MAT08] use RTL/gate-level power estimation by commercial tools from Synopsys. The remaining approaches in Table II (Kahng [KAH09], Milojevic [MIL09] and Matsutani [MAT08]) obtain power estimations directly from commercial tools, providing a better accuracy when compared to the high-level models. On the other hand, the simulation time and the amount of memory required by these commercial power estimation tools is too high, making their use infeasible when exploring a large design space [LEE09][KAH09]. Finally, most of the reviewed approaches employ volume-based power models (sixth column). Such models do not include low-level effects such as congestion and burstiness that are essential to verifying the occurrence of hot-spots. In turn, hot-spots can impact the performance of the whole system and even reduce its reliability and life-time. The proposed actor-oriented power model considers the effects that can lead to hot-spots by abstracting inter-task communication by their rates rather than their volumes, which is one contribution of this Thesis when compared to the reviewed NoC-based MPSoCs power estimation modeling (this contribution is explored in Chapter 4). Another contribution, described in Chapter 5, is the possibility of joint validation of applications (modeled as UML sequence diagrams) mapped onto the actor-oriented NoC model, considering power constraints early at the design process. Finally, to the best of our knowledge, the present work is the first NoC power estimation model that allows accurate power analysis using a simplified NoC model based on actor-orientation.
41
Table II - Related works in NoC-based MPSoCs Power Estimation. (POWER DISSIPATION ESTIMATION=PDE, NOT AVAILABLE = NA)
Work
Platform
Application / Traffic benchmarks and MultiMedia System (MMS) video application uniform traffic distribution (random destinations)
Abstraction Level
Reference Model (error/speed-up)
NoC Power Model
Description
algorithmic
Synopsys design compiler but no comparison regarding PDE error was reported
volume-based model
NoC PDE based on bit energy concept [YE02], in order to explore the problem of energy-aware mapping
RTL
SPICE evaluation
gate-level model
Synopsys Power Compiler tool
gate-level model and volume-based model (links)
Hu 2003 [HU03]
generic wormhole 2D mesh NoC
Banerjee 2004 [BAN04]
generic 2D mesh NoC
Wolkotte 2005 [WOL05]
generic packet and circuit switching NoC architectures
Marcon 2005 [MAR05]
Hermes NoC
VOPD, MMV, MPEG4
algorithmic
SPICE evaluation
volume-based model
Chan 2005 [CHA05]
packet switching NoC architectures available in NoCGEN libraries [CHA04]
E3S benchmark [E3S10]
algorithmic and RTL
absolute average error is 5% when compared to PrimePower tool
volume-based and gate-level model
authors propose energy model extraction methodology for a NoC packet switched router based on linear regression
Eisley 2006 [EIS06]
PEs and NoC represented as a graph
messages that represents a traffic behavioral
algorithmic
average error of 9,1% in PDE and 7% of average simulation speed-up when compared to the Raw CMP BTL
volume-based model
high-level power analysis framework for multi-core chips based on LUNA tool
Xi 2006 [XI06]
generic packetswitching NoC
synthetic traffic
TLM
Berkeley Predictive Technology Models
gate-level model
Penolazzi 2006 [PEN06]
Nostrum NoC
synthetic Traffic
RTL
average error of 5% in PDE when compared to Synopsys Power Compiler
volume-based model for link and gate-level for router
authors propose a SystemC transaction level NoC simulation framework, which uses a mathematical power model for the routers, input buffers and links this paper presents a study of the Nostrum power dissipation comparing the proposed NoC power model with the Synopsys Power Compiler tool
Beltrame 2007 [BEL07]
STbus NoC and abstract PEs
MPEG4 , PI, VMUL, Sort
TLM
NA
volume-based model
it adopts multi-accuracy power models, according to the desired accuracy level
Atitallah 2007 [ATI07b]
NoC and abstract components (PEs, memories)
parallelized version of H.263 encoder
TLM
error of 8% in PDE compared to a physical measure and 17% of simulation speed-up
volume-based model
integration of MPSoCs components power models into a framework/simulator at the Timed Programmer View level
Koohi 2008 [KOO08]
2D Mesh NoC
different traffics distributions (e.g. uniform, local, hot-spot)
algorithmic
error of 2% for PDE and 3% for throughput when compared to the Synopsys Power Compiler and Modelsim
volume-based model
high abstraction power model for different traffic rate parameters
Matsutani 2008 [MAT08]
generic wormhole NoC
NAS Parallel Benchmark
RTL
Synopsys Power Compiler tool
gate-level models
Elmiligi 2009 [ELM09]
generic NoC
MPEG4
algorithmic
Synopsys Power Compiler
volume-based model
Kahng 2009 [KAH09]
Intel 80-core Teraflops chip router & Intel Scalable communications Core router
Video Processing and Video Decoding
RTL
Intel 80-core => 636,05% better then ORION 1.0 Intel SCC => 1840% better then ORION 1.0 [HAN02]
gate-level models
Lee 2009 [LEE09]
NePA platform (PEs, MIT Raw NoC)
SPLASH-2 benchmark
TLM
average error of 5% when compared to the Synopsys PrimeTimeTM PX tool (gatelevel)
Milojevic 2009 [MIL09]
Artemis NoC, PEs and memories
multiple video coding (MPEG4, H.264, SVC)
RTL
Synopsis Prime Power tool and Magma BlastPower tool
gate-level model
8x8 2D and a 4x4 3D mesh NoCs
VOPD, MPEG-4 and MMS
RTL
NA
gate-level model
Hermes NoC and abstract PEs
VOPD, MPEG4, HDTV and automotive
TLM
error of 0% for PDE when compared to the RTL model and 5% when compared to Synopsis Prime Power
rate-based model
Anagnostopoulos
2010 [ANA10] Proposed work 2009
streaming RTL (NoC) and applications (DVB, Algorithmic MPEG-4) (links)
volume-based model
propose of dynamic, and leakage power estimation of NoC's components by extracting SPICE net-list for each component. it uses the PDE (average energy per bit to traverse on single router) for the spatial mapping tool (SMIT) to optimally map the on-chip communication stream proposes a communication dependence and computation model (CDCM) to capture the volume and the timing of applications for energy-aware mapping exploration
it uses a run-time power-gating technique into the NoC router structure, enabled by a look-ahead algorithm proposes a topology-based methodology based on connectivity matrix concept (graph-theoretic) for PDE of an application specific NoC-based systems the NoC components power models of ORION1.0 (e.g. addition of clocking model and link power model) were improved, in order to increase the results accuracy presents a framework for router PDE that uses the number of flits passing through a router power model of individual NoC components, which are used for power analysis of three different mapping on a MPSoC platform proposes three techniques to reduce the NoC temperature: (i) power-aware routing algorithms, (ii) buffer sizing and (iii) direct connection simplified actor-oriented model that allows accurate power/energy analysis of applications mapped onto a NoCbased MPSoC platform
42
3.3 MPSoC Application Modeling and Mapping Ha et al. [HA08] proposed a model-based framework for MPSoC software development, called HOPES. HOPES allows to model applications by using UML 2.0 and PeaCE model [HA07]. In PeaCE the application model is based on actor-orientation and it can be specified with three different MoCs: (i) on the top level, a process network is used to specify execution condition of each task and to define the interaction between them, (ii) synchronous piggybacked dataflow (SPDF - that is an extension of SDF MoC, proposed in [HA06]), which is used to specify signal processing tasks [PAR02]; (iii) FSM extension called flexible FSM (fFSM), proposed in [KIM05], which is used to specify control tasks. Once the application model is defined, it is manually partitioned into the abstract PEs that compose the hardware platform [HA08]. The hardware platform is separately specified in a block diagram (described in an xml-style file). Each block diagram has a set of architectures parameters (e.g. processor name, memory type), as well as constraint parameters (e.g. task period and task name) that must be defined by the designer regarding the application behavior. Besides, the communication and synchronization requirements between tasks must be defined as well. A Divx (Digital Video Express) composed of three tasks (Avi Reader, MP3 player e H263 decoder) was used to validate the framework and its flow. Pimentel et al. [PIM06][PIM08] present the Sesame (Simulation of Embedded System Architectures for Multilevel Exploration): a modeling and simulation environment for system-level design, based on the Y-chart design approach [KIE02]. The Figure 15 (a) illustrates Y-chart design space exploration flow, which allows to model the application and the system architecture separately. The application model can be mapped onto the platform model but both are cosimulated14 via trace-driven simulation [PIM08]. Thus, Sesame does not support the joint simulation of multi-applications mapped onto the platform model. Essentially, the application model is not executed in the architecture model. Instead, during the application model simulation traces of events (e.g. task communication) are generated and used as stimulus to the architecture model, which captures and evaluates their performance constraints. The Figure 15 (b) shows the three model layers supported by Sesame: (i) application model, which uses Kahn Process Network (KPN) to implement the functional behavioral of the application(s); (ii) mapping layer that is composed of abstract PEs, abstract components (e.g. memories) and buffers for communication between the PEs (illustrated as virtual processors in Figure 15 (b)). This layer supports the application events traces mapping onto the PEs (applying dataflow graphs), as well as the scheduling of application events when multiple Kahn processes are mapped onto a single PE; and (iii) architecture model that defines architecture resources and captures their performance constraints according to the computation and communication events generated by an application model. The designer can use Perl or SystemC to implement the architecture model (respecting the characteristics of the DE MoC), which is simulated in
14 As described in [AND05], co-simulation is defined as two or more heterogeneous simulators executing together in order to produce a complete simulation result.
43
transaction level [PIM06]. As defined in [PIM08], each PE is parameterized with a table of operation latencies (e.g. table of processor 1 with latency values for the operations X, Y and Z, as shown in Figure 15 (b)). The operation latency values are extracted from SimpleScalar ISS [AUS02] simulation and used to statically calibrate the architecture model components. In [PIM06] and [PIM08], the calibration of communication infrastructures or memory model components is not addressed. A case study of a Motion-JPEG (M-JPEG) encoder application was used to verify the efficiency of the proposed environment.
(a)
(b)
Figure 15 - (a) Y-chart design space exploration flow, and (b) Sesame's model layers. Figures obtained from [PIM06] and [PIM08], respectively.
Kempf et al. [KEM05] present a SystemC-based framework that enables the evaluation of application mapping onto the virtual PEs (following the Y-chart design approach [KIE02]) by means of an executable performance model, which is defined by an XML description. The XML configuration file defines: the configuration of the timing model (e.g. the number of required cycles per task execution), the number of available PEs and number of supported concurrent threads per PE, application mapping onto the PEs, parameterization, instantiation, and interconnection of communication nodes, address memory mapping.
An extension of this work was reported in [KEM06]. This extension describes a framework targeted to MPSoC software development, verification, and evaluation, which already starts from the beginning of the design cycle instead of starting the software design after the platform is already designed. Software can be developed in four different levels of abstraction that vary in
44
accuracy and simulation speed. The framework uses SystemC for simulation and XML to describe task mappings and timings. Keinert et al. [KEI09] describe the SystemCoDesigner framework, which allows automatic design space exploration (from application modeling to automatic platform synthesis) of MPSoCs by integrating simulation and behavioral synthesis tools. The SystemCoDesigner flow comprises: (i) application modeling that is described by an abstract actor-oriented modeling using a particular subset of SystemC (SystemMoC library, presented in [FAL06]). In this approach, each application module or task (for instance, a Huff Decode) is represented as an actor; (ii) hardware generation, in this step from the described SystemMoC actors, hardware and software modules are generated by code transformations. The hardware generation consists of three steps, (i) transformation of SystemMoC actors into SystemC modules, (ii) behavioral synthesis using the Forte Design Systems Cynthesizer15, and (iii) generation of Verilog gatelevel netlists using Synplify Pro from Synplicity16; (iii) performance parameters definition (e.g accepted communication latency between two modules, required memory resources), which are used for (iv) design space exploration, (v) automatic platform synthesis that generates an FPGA17 configuration file by interconnecting the previously generated modules and PEs. For example, for each allocated PE, a MicroBlaze subsystem (memory and bus resources) is instantiated. A case study of a Motion-JPEG encoder application was used to verify the efficiency of the proposed environment. The proposed environment consider only bus architectures. Kangas et al. [KAN06] present a design flow that allows automatic design space exploration and synthesis, called Koski. Koski and SystemCoDesigner present some similarities in certain aspects, for example, its cover the design phases from system-level modeling to FPGA prototyping. Koski allows application and platform modeling using an UML 2.0 extension, targeting embedded real-time system design. The UML application model is defined according to a Kahn process network, previously described, which are refined using Statecharts (asynchronous communicating extended finite state machines – EFSM - [GNE02]). The architecture model, in turn, is defined in UML composite structure diagrams (hierarchical descriptions that represent interconnected instances collaborating over communications links) according to the application model definitions. The proposed design flow has a set of features (e.g. back- annotation, UML profiler), allowing the
15 16 17
Available at: http://www.forteds.com. Available at: http://www.synplicity.com. Monmasson et al. [MON07] define FPGA as a matrix of configurable logic blocks (CLBs), interconnected by a reprogrammable network.
45
architecture exploration based on the system optimization (e.g. application). This approach uses a mapping model, based on the UML profiles, which defines the relationship between the application and the architecture models. Before the application mapping, task are grouped in blocks that are manually mapped (or pure random selection) onto the target architecture. Both, the application and the platform model are separately validated by functional simulations. 3.3.1 MPSoC Application modeling and mapping - Closing Remarks As the reviewed works, the proposed actor-oriented approach considers an abstract application model and supports designers on analyzing and comparing different platforms that can efficiently execute that application. To support the design space exploration, at an early design phase, the application should be mapped onto a multiprocessor platform model, which should support an analysis of the functional and non-functional requirements of the application. The proposed approach combines actors and UML, modeling the concurrent behavior of the application. The main advantage of the proposed method is on the layered models of communication-centric multiprocessor platforms. Instead of generating customized platforms out of the system-level model, the proposed approach jointly executes application models and existing platform models, allowing an accurate performance estimation.
46
47
4. PROPOSED MODELS This Chapter addresses one of the main contributions of this Thesis, the development and the validation of abstract NoC models. The Chapter starts with presenting basic NoC concepts (Section 4.1), emphasizing the most important building blocks. Furthermore, the adopted NoC reference model (Section 4.2) and two proposed models are described (Sections 4.3 and 4.4). Finally, both proposed NoC models are described and some results, including their accuracy when compared to the reference model are presented (Section 4.5).
4.1 NoC basic concepts As mentioned before, NoCs are likely to replace traditional on-chip interconnection architectures due to its performance characteristics, such as dedicated wires and shared busses in future MPSoCs [BJE06]. Dedicated wires present poor reusability and flexibility, while shared busses transmit only one word per clock cycle and offer limited scalability. As defined in [MAR09], the NoC communication paradigm consists of exchanging packets of information among nodes. Each node is composed of an IP core18 (e.g. PEs, memory blocks), which is connected to a router through the network interface (NI), as illustrated in the bottom left side of Figure 16 (a). The main NoC component is the router, which handles the packets exchange among the nodes [BEN02][YE03]. Routers usually have switching control and input and output ports, which can have buffers for temporary storage of information, as shown in Figure 16 (b). The switching control defines how packets move through the router, by defining the connection between input and output ports, and it comprises routing and arbitration logic. The routing logic implements an algorithm that defines the path that each incoming packet will follow by connecting the input port to the correct output one. The arbitration logic is the mechanism that resolves (as fairly as possible) the contention among incoming packet requests desiring a common output port. The way routers are connected defines the network topology [MOR04]. The choice of topology depends on many factors such as, for example, scalability and power-efficiency. For instance, [DAL01] claims that a mesh topology is more power-efficient than a folded torus topology. Figure 16 (a) shows an example of a mesh architecture, which is the most common NoC topology [MAR09]. High level abstraction modeling of the NoC is needed to accelerate the design space exploration of NoCs. The design exploration at register transfer level (RTL) does not provide the required abstraction to the design space exploration of MPSoCs based on NoC communication architecture. The level of details that have to be modeled and the low accessibility and visibility of the components’ behavior justify this statement.
18 As defined in [GUP97], an IP core is a pre-designed, pre-verified hardware piece that can be used as a building block for large and complex applications on an integrated circuit.
48 IP
IP
IP
IP
NI
NI
NI
NI
Router IP NI
Router
Router
Router
Router
IP
IP
IP
NI
NI
NI
Router
Router
Router
IP
IP
IP
IP
NI
NI
NI
NI
Router
Router
link
Router
generic router architecture
Router
input buffers
X-bar
output buffers
v switching control
node (a)
(b)
The Figure (a) shows a 3 x 4 direct mesh NoC architecture consisting of IP cores, routers and communication links. Each link represents a bi-directional connection between two routers (or even a router and an IP) and it consists of a set of wires. In turn, Figure (b) illustrates a generic router architecture, which is composed of input buffers to temporarily store incoming packets and/or output buffers to temporarily store outgoing packets. In addition to the buffers, the architecture above has a switch control.
Figure 16 – A 3 x 4 direct Mesh NoC topology and a generic router architecture.
The issues mentioned above, combined with time to market pressure, demand high abstraction level modeling and more appropriate debugging capabilities. As mentioned in Chapter 2, the high level modeling activity is a trade-off between level of details and model confidence. In NoC context, the level of details refers to the structure and behavior abstraction of the NoCs’ components. The structural abstraction refers to: (i) the granularity of data storage (e.g. storage for a flit or packet); (ii) the number of components that will be considered or abstracted and how they are interconnected (e.g. the number of wires or a channel). The behavior abstraction includes how and, more importantly, when such components (e.g. arbiter) update their internal state and concurrently interact with other components (e.g. buffer). In turn, the model confidence defines how useful a NoC model is for a particular purpose (e.g. latency evaluation) regarding the accuracy results between the model and its NoC reference model. In this Thesis the HERMES infrastructure, proposed in [MOR04], is adopted as the NoC reference model.
4.2 HERMES reference model HERMES implements a low area overhead packet switching NoC for different topologies, flit sizes, buffer size, routing algorithms, and flow control strategies. It supports the implementation of the three lower ISO-OSI layers, namely physical, data link and network. Initially, HERMES is based on NoCs using only wormhole routing [MOR04]. Its routers have centralized switching control logic and five bi-directional ports (East, West, North, South, and Local). The Local port is used to establish the communication between a router and its local processing element, whereas the others are connected to the neighbor routers. HERMES uses round-robin arbitration for granting access to incoming packets, which are stored in a FIFO buffer. The priority of an input
49
port is a function of the last input port having a routing request granted. If the incoming packet request is granted by the arbiter, the routing algorithm is executed to connect the input port to the correct output port. If the algorithm returns a busy output port, the header flit and all subsequent flits of this packet are blocked. After all flits in a packet are transmitted, the port is released. Two flow control strategies are available: handshake protocol and credit based. When a 4-phase asynchronous handshake protocol is used, the external router interface is composed of six signals: rx, ack-m and data-in for input and tr, ack-tx and data-out for output. When credit based flow control is used, a transmission clock is sent to the receiver and a credit signal is asserted from the receiver to the transmitter indicating available buffer space. Signal ack-m does not exist in this case. This flow control algorithm enables implementing GALS networks. Four main reasons justify the adoption of HERMES infrastructure as the NoC reference model: (i) it was developed in the research group of the proponent of this Thesis, (ii) it is a well known NoC and several instances of HERMES-based systems were successfully prototyped in FPGAs, (iii) the Atlas19 framework provides a set of tools for NoC design space exploration, including a NoC generation [OST05] and verification [TED05], and, finally, (iv) HERMES is the interconnect infrastructure of HeMPS platform [CAR09], which is also used in this work. In order to improve NoC design observability and to accelerate the design space exploration of HERMES-based systems, two actor-oriented NoC models, called RENATO and JOSELITO, were proposed. The development of such NoC models reflects the HERMES functional details such as internal latencies, congestion effects, routing and arbitration delays. The proposed models allow the designer to quickly modify and analyze, early at the design process, different NoC configurations, aiming to satisfy the particular requirements of performance for a great variety of applications.
4.3 RENATO model A common practice in high-level NoC modeling is based on top-down design approach. In this approach the NoC design starts with its specification in the higher hierarchical level, which is successively refined in different models/submodels (where specific issues are more detailed). This process is repeated until an adequate model, in terms of functionality and accuracy (usually, an RTL implementation), is achieved. The design methodology used in this Thesis is based on opposite approach (as illustrated in Figure 17), which is based on identifying each relevant inter-component interaction existing on the RTL model and formalizing it using UML sequence diagrams. As defined in [IND08], by describing a NoC through its inter-component interactions, it was possible to isolate the individual functionality of each conceptual actor in the system, disregarding the fact that many of such actors had been merged in the RTL implementation. For instance, the arbitration and routing procedures were implemented as a single state-machine in the RTL model
19 Available in: http://www.inf.pucrs.br/~gaph/AtlasHtml/AtlasIndex_us.html.
50
for the sake of simplicity and efficiency. However, in the abstract model, such procedures must be implemented separately in order to simplify the design space exploration (e.g. to investigate the positive and negative impacts of using adaptive routing).
actor-oriented NoC model
analyze interactions
complex testbenches debbugging / analysis tools design space exploration, validation
NoC RTL model
Optimized NoC RTL model
Figure 17 - Adopted approach for NoC modeling and design space exploration.
Additionally, the specification of the system in interactions can abstract the notion of discrete time that exists in the RTL model, providing just a partial order of the communication among model components. Such abstract model can be used to show the system functionality or be annotated with actual timing information so that a more accurate timing behavior can be reflected. In this context, two UML sequence diagrams, which describe the interactions of the HERMES router components, were defined as illustrated in Figure 18. The UML sequence diagram, shown in Figure 18 (a), refers to the arbitration request by a particular input buffer and the establishment of a connection between it and an output port. InputBuffer:b1
Controller
Arbiter
Router
OutputPort
InputBuffer:b1
1 requestArbitration(flit)
Controller
Output Port
InputBuffer:b2
1
2
2
sendFlit(flit)
requestArbitration(flit)
3
3
sendFlit(flit)
requestRouting(flit)
sendFlit(flit)
4
4
response
5 isFree()
7 alt
alt
6
[response = true AND flit IS sizeFlit] getPacketSize()
boolean:free
[response = true AND flit IS payloadFlit]
8
[free] arbitration granted
5
decreasePacketSize()
setFree(false) alt
[else] arbitration NOT granted
[packetSize = 0] setFree(true)
9
response alt [response = true] eraseFlit(flit)
(a) (b) Figure 18 - UML sequence diagrams depicting interactions between components of the HERMES NoC. Figure extended from [IND08].
Initially, the input buffer sends the packet header to the routing controller (interaction 1). The routing controller asks the arbiter to choose one of the possible incoming requests that can
51
arrive from any of the five input buffers (interaction 2). After selecting an incoming input buffer request, the arbiter sends the header flit to the router (interaction 3) that executes a particular algorithm (for instance, XY algorithm) to determine which output port the packet should be sent to. Once the routing is done (interactions 4 and 5), the controller verifies if the chosen output port is free (interaction 6). If the output port is free (interaction 7), the input buffer establishes the connection to the output port (interaction 8), otherwise the connection is refused (interaction 9) and the input buffer must start the whole input-output connection requesting process again. The second UML sequence diagram shown in Figure 18 (b), identifies the transmission of a flit from an input buffer to a neighbor router through an output channel. Initially, the controller receives the flit from the local input buffer (interaction 1) and checks which output port is allocated to it (interaction 2). After sending the flit (interaction 3), the controller waits for acknowledgement (interaction 4). A positive acknowledgement removes the successfully sent flit from the source input buffer (interaction 5), while a negative acknowledgement causes a retransmission of the flit. It is important to mention that both UML sequence diagrams consider timing among interactions, which were extracted from the simulation of the HERMES RTL model. The RENATO actor-oriented model was implemented using Ptolemy II, following the interaction descriptions shown in Figure 18. RENATO comprises two main actors: input buffer for temporary storage of packet flits and arbiter. Due to the modeling flexibility, each RENATO's packet flit is modeled as a record token, as illustrated in Figure 19. Typical packet structure TRAILER
PAYLOAD
HEADER
HERMES’ header flit
y
x
RENATO’s header flit (record token representation) source_y source_x timestamp_sent timestamp_ini payload where: x y size payload timestamp_ini timestamp_sent source_x source_y
size
// x target address // y target address // packet size (number of flits) // data // initial packet timestamp // timestamp time that the packet is being sent // source x address evaluation // source y address
y
x
parameters
Figure 19 - Example of packet flit difference between HERMES and RENATO models.
The use of record token increases the range of evaluation parameters (e.g. timestamp time that the packet is sent) that can be included and considered without requiring large code rewriting, for instance the modification of state machines as in RTL approach. The arbiter implements centralized round-robin arbitration (code illustrated in Figure 20) that grants the access to incoming packets. The priority of an input port is a function of the last
52
input port having a routing request granted. If the incoming packet request is granted by the arbiter, the XY routing algorithm is executed to connect the input port to the correct output port. 1. protected int nextRequest() throws IllegalActionException{ 2. if(_debugging) _debug("Request detected, arbiter activated"); 3. if (arbitersel==0){ 4. if (state[1]==REQUESTING && inputreq[1].hasToken(0)) { return 1;} 5. else if (state[2]==REQUESTING && inputreq[2].hasToken(0)) { return 6. else if (state[3]==REQUESTING && inputreq[3].hasToken(0)) { return 7. else if (state[4]==REQUESTING && inputreq[4].hasToken(0)) { return 8. else if (state[0]==REQUESTING && inputreq[0].hasToken(0)) { return 9. } 10. else if (arbitersel==1){ 11. if (state[2]==REQUESTING && inputreq[2].hasToken(0)) { return 2;} 12. else if (state[3]==REQUESTING && inputreq[3].hasToken(0)) { return 13. else if (state[4]==REQUESTING && inputreq[4].hasToken(0)) { return 14. else if (state[0]==REQUESTING && inputreq[0].hasToken(0)) { return 15. else if (state[1]==REQUESTING && inputreq[1].hasToken(0)) { return 16. } 17. else if (arbitersel==2){ 18. if (state[3]==REQUESTING && inputreq[3].hasToken(0)) { return 3;} 19. else if (state[4]==REQUESTING && inputreq[4].hasToken(0)) { return 20. else if (state[0]==REQUESTING && inputreq[0].hasToken(0)) { return 21. else if (state[1]==REQUESTING && inputreq[1].hasToken(0)) { return 22. else if (state[2]==REQUESTING && inputreq[2].hasToken(0)) { return 23. } 24. else if (arbitersel==3){ 25. if (state[4]==REQUESTING && inputreq[4].hasToken(0)) { return 4;} 26. else if (state[0]==REQUESTING && inputreq[0].hasToken(0)) { return 27. else if (state[1]==REQUESTING && inputreq[1].hasToken(0)) { return 28. else if (state[2]==REQUESTING && inputreq[2].hasToken(0)) { return 29. else if (state[3]==REQUESTING && inputreq[3].hasToken(0)) { return 30. } 31. else if (arbitersel==4){ 32. if (state[0]==REQUESTING && inputreq[0].hasToken(0)) { return 0;} 33. else if (state[1]==REQUESTING && inputreq[1].hasToken(0)) { return 34. else if (state[2]==REQUESTING && inputreq[2].hasToken(0)) { return 35. else if (state[3]==REQUESTING && inputreq[3].hasToken(0)) { return 36. else if (state[4]==REQUESTING && inputreq[4].hasToken(0)) { return 37. } 38. return -1; 39. }
2;} 3;} 4;} 0;}
3;} 4;} 0;} 1;}
4;} 0;} 1;} 2;}
0;} 1;} 2;} 3;}
1;} 2;} 3;} 4;}
Figure 20 - Implemented Round-Robin method.
The main features of RENATO are the modeling flexibility and its debugging capacities. Due to the modeling flexibility, different configurations of the same NoC (or even different NoCs with slightly different behavior) can be quickly modeled simply by annotating the timing information for each individual component. Moreover, it presents an improved potential (when compared to RTL model) of observing and debugging the execution of an application running on top of a RENATObased MPSoC, as presented in [MÄÄ08][MÄÄ10] and described in the next Chapter of this Thesis. Following, a simplified NoC model, called JOSELITO, is described. JOSELITO uses the Payload Abstraction Technique (PAT), allowing performance evaluation by combining simulation and analytical methods.
4.4 JOSELITO model JOSELITO is a more abstract platform model than RENATO. However, it uses the same UML interactions defined in Figure 18. The main difference between JOSELITO and RENATO is the JOSELITO's reduced simulation time, caused by decreasing the number of communication events due to the flit by flit packet forwarding. JOSELITO uses the Payload Abstraction Technique (PAT), which is a contribution of this Thesis, previously described in [OST08]. In PAT: (i) the packet is defined as a header and a trailer, as shown in Figure 21 (a), (ii) the buffer is a FIFO structure modeled as the finite state machine illustrated in Figure 21 (b), (iii) packet headers are released
53
from a given router once there is available buffer space at next hop on its route, and (iv) a simple analytical method is used to calculate the packet trailer release time (ptrt). header token received
JOSELITO’s packet structure Header H
Trailer T
empty
header token sent
header
trailer token received
wt
trailer
trailer token sent
(a)
(b)
Figure 21 - (a) JOSELITO's packted structure and (b) buffer state machine.
As shown in Figure 21 (b), the FIFO buffer is modeled as a finite state machine (FSM), with four states: (i) empty, (ii) header, (iii) waiting trailer - represented as wt in Figure 21 (b), and (iv) trailer. In the empty state, the buffer is able to receive a packet header. The received header is stored into the buffer in the header state. After forwarding the packet header, the buffer goes to the waiting trailer (wt) state. When the trailer is received, the FSM goes to trailer state. Once the trailer is forwarded and removed from the buffer, it returns to the empty state. Even if the transmission of the packet payload is abstracted away, the simulation model can still represent both unblocked and blocked packet transmission scenarios, as illustrated in Figure 22. P
C T
Packet Blocked Packet
H
T T
H
T
H H
Router Producer
Network link
P
Consumer C
Blockage
Figure 22- Unblocked (in the left side) and blocked packet transmission situations.
If no resource conflicts occur (unblocked scenario), latency of the packet switching NoCs can be measured with no loss of accuracy [OST08]. In a blocked scenario, when a header packet arrives in an input buffer, two blocking situations can occur: either the desired output port is reserved to another input port or the target neighbor input buffer is not able to receive a header or a trailer of the packet. In such cases, a connection of an intermediate router (for instance, a router between the source and the target PE) can be closed without considering the impact of the blockage to other packets. Even with occurrence of blocking situations throughput and power dissipation of NoCs can be evaluated with no loss of accuracy [OST09]. In this context, the packet trailer release time (ptrt - Equation (2)) is used to ensure correct functionality during packet transfers, allowing the designer to obtain high accuracy latency, throughput and power dissipation results with shorter simulation time in comparison with RENATO. The accuracy of those results also depends on parameters obtained from RTL simulation. One possible alternative for the analytical calculation of ptrt is the Equation (2), presented in
54
[OST08].
ptrt where:
hft
pcksize* ctf
(2)
ptrt is the packet trailer release time, hft is the header forwarding time, pcksize is the packet size (number of flits), and ctf is the number of clock cycles to transmit one flit from one hop to another one.
The header forwarding time depends on the number of clock cycles required to execute the arbitration, the routing algorithm and the successful reception of the header by the neighbour resource (router or consumer). This parameter is obtained from the RTL-NoC simulation. After reaching the packet trailer release time, defined by Equation (2), the packet trailer is sent, following the same path reserved by the header. According the proposed technique, three transmission scenarios are possible: (i) blockingfree delivery, (ii) header blocking, and (iii) header and trailer blocking. As buffer depth is not considered in PAT, the following scenarios assume that the packet size requires 4 input buffers to be fully stored. This means, for example, that when the packet header arrives at the Consumer (C), the trailer (T) must be stored into the input buffer of the Router 3 (3 hops before the consumer location). These scenarios, used to exemplify possible unblocked and blocked situations, consider arbitration/routing requiring 7 clock cycles, payload size equal to 21 flits and credit-based flow control (ctf=1). The packet header (H) arrives at the first router (Router 1) at time 0. 4.4.1 Scenario I: Blocking-free delivery In the blocking-free delivery, there is no loss of accuracy in the latency evaluation, as illustrated in Figure 23. Initially, in the step 1, at cycle 0, the Producer 1 forwards the packet header (H) to the Router 1 and calculates the ptrt value, at the same cycle. In step 2, after the arbitration time (7 cycles best case, considering the routing request granted), the packet header (H) is forwarded to the Router 2 and the Equation (2) is applied by the input buffer of Router 1. Following, in step 3, the Producer 1 forwards the packet trailer (T) according to the ptrt, when the simulation time reaches 21 cycles. At this moment, the connection between Producer 1 and Router 1 is closed. Finally, in step 4, the Router 1 sends the packet trailer (T) to the Router 2 and its connection is released. This is the best case scenario, where the 3 hops between packet header (H) and packet trailer (T) are maintained during the whole packet transmission. This ensures that the trailer will be received by the Consumer 1 at the cycle 56.
55 Consumer 1
Consumer 1
STEP
1
STEP
Router 5
ptrt
0
21
Router 5
Input buffer Router 1
Producer 1
hft
2
Router 4
hft
ptrt
0 7
21 28
Router 4
connection reserved Producer 1 Producer 1
Producer 1 Router 1 H
T
Router 2
Router 3
Router 1
T
Router 2 H
Router 3
Consumer 1
Consumer 1
STEP
3
Router 5
STEP
4
Router 5
H Router 4
Producer 1
hft 0-
ptrt
hft
ptrt
21
028
21 49
Router 4
Router 4
H
connection is released
connection is closed Producer 1
Producer 1
TRouter 1
Router 2
Router 3
Router 1
Router 2 T
Router 3
Figure 23 - Estimated release times regarding blocking-free delivery scenario.
According to [MOR04], in a blocking-free delivery scenario, the latency of a packet (pcklatency) from producer (e.g. Producer 1) to consumer (e.g. Consumer 1) is obtained from Equation (3). pcklatency nhops* arbt + pcksize where:
(3)
nhops: number of hops between P and C arbt: arbitration time pcksize: packet size (number of flits)
Applying Equation (3) using the parameters of the scenario (i), the same 56 clock cycles are obtained. 4.4.2 Scenario II: Header Blocking Figure 24 illustrates a blocking situation at the input buffer of Router 5. In step 1, the packet header (H) is sent by the Producer 2 at the cycle 21. Note that until this moment the 3 hops between packet header (H) and packet trailer (T) are maintained. In the step 2, at the cycle 28, a blocking situation (the header packet is blocked) is detected in the input buffer of the fifth router (Router 5). During the header blocking time (assuming 10 clock cycles), the packet trailer (T) is forwarded one hop further (from Router 1 to Router 2), decreasing the number of hops between the header and trailer (2 instead of 3 hops – as defined before the scenarios description). Consequently, the connection between Router 1 and the Router 2 is closed without considering the impact of the header blocking, which can lead to loss of
56
accuracy on blocking other packets. Following, in step 3, the packet trailer (T) is stored into the input buffer of Router 4 at the cycle 42 but will only be released at cycle 59, considering then the header blocking time. Finally, in step 4, the ptrt of the input buffer actor of Router 5 is calculated (ptrt equal to 66), ensuring that the packet trailer will be delivered to the Consumer 2 ten cycles later (blocking time) when compared to the blocking-free delivery scenario. Consumer 2
1
Router 5
2
Router 5
blocking situation
Router 1
hf hft t 21 0
Consumer 2
ptr ptrt t 28
H
Router 4
Router 4
X cycles of blocking
H connection is released Producer 2
Producer 2 Router 1 T
Router 2
Router 3
Router 1
Router 2 T
Router 3
Consumer 2
3
Router 5
H
Consumer 2
4
Router 5
H
T Router 5
Router 4 Router 4
T
Producer 2 Router 1
Router 2
Router 3
hf hft t 38 0
ptr ptrt t 59
T arrives at Router 4 at cycle 42
Router 4
hf hft t 45 0
ptr ptrt t 66
Producer 2 Router 1
Router 2
Router 3
Figure 24 - Packet forwarding situation regarding header blocking.
4.4.3 Scenario III: Header and Trailer Blocking Initially the header and the trailer are sent as described in the previous scenarios (for the sake of simplicity it is not illustrated in Figure 25). Step 1, at the cycle 28, the header packet is blocked and it remains stored into the input buffer of Router 4. In this moment, the packet trailer (T) is forwarded from Router 1 to Router 2. In step 2, due to the high blocking time (assuming 20 clock cycles) the packet trailer (Router 3) is blocked by its packet header (Router 4) at cycle 42. In this case, the distance between the header and the trailer is just one hop. Therefore, two connections (Producer 3 to Router 1 and Router 1 to Router 2) are released without considering the impact of the header and trailer blocking, increasing the possibility of accuracy loss on blocking other packets. Note that when the trailer is blocked by its header, the Equation (4) is applied to define the new (n_ptrt).
n _ ptrt
current_ time
pcksize* ctf
(4)
57 Consumer 3
Consumer 3
1
2
Router 5
Router 5
header blocked
H
Router 4
H
hf hft t 48 0
Router 4
Router 4
hf hft t 28 0
ptr ptrt t 49
Router 4
connection is released
ptr ptrt t 69
trailer blocked at cycle 42
T Producer 3
Producer 3 Router 1
Router 2 T
Router 3
Router 1
Router 2
Router 3
Consumer 3
Consumer 3
3
Router 5
4
H
Router 5
header received at cycle 62
T
H
trailer received at cycle 83 Router 4
Router 4
Router 3 Producer 3 Router 1
Router 2
Router 3 T
hf hft t 21 0
ptr ptrt t 63
Producer 3 Router 1
Router 2
Router 3
Figure 25 - Packet forwarding situation regarding header and trailer blocking.
Thus, the router Router 3 releases the packet trailer (T) after 21 clock cycles of the header forwarded time (n_ptrt equal to 63), ensuring that the connection between Router 2 and Router 3 is maintained, as illustrated in step 3. Finally, in step 4, the packet trailer is received by the Consumer 3 at cycle 83. It should be clear that the proposed technique is flexible in terms of modification and it is not restricted to the abstractions presented here. For example, different parameters can be added in the Equation (2), improving the accuracy of the technique, which can be applied to any wormhole packet switching NoC. The JOSELITO model can still be optimized to reduce the number of communication events, thus reducing the simulation time. One possibility is to modify the model to not generate negative acks, but sending an ack only when a resource is available. The arbiter can also be modified in order to reduce the number of times the round robin algorithm is called when it is in idle state. The model confidence of both RENATO and JOSELITO models were evaluated according to the ATLAS design exploration flow, as described below.
4.5 Evaluation of the Proposed Models In order to accelerate the validation process of both RENATO and JOSELITO models, the ATLAS framework was adopted. The ATLAS framework supports a set of automated steps related to design exploration of HERMES NoCs. ATLAS flow comprises of 5 main steps: (i) NoC generation, (ii) traffic generation, (iii) NoC simulation, (iv) traffic evaluation, and (v) power evaluation; as illustrated on top of Figure 26.
58 ATLAS Design Exploration Flow NoC generation
Traffic Generation
3
NoC Simulation
Traffic Evaluation
1
traffic analysis module
RTL / Ptolemy II Simulation traffic temporal distribution
Input files
P
4
graphics / reports generation
5
NoC Power Evaluation graphics / reports generation
6
C Output files
R
R
R
R
2 P timestamp target pkt_size source data File internal view timestamp target pkt_size source data timestamp target pkt_size source data (each line represents a timestamp target pkt_size source data timestamp target pkt_size source data packet)
NoC model
C
P: producer C: consumer R: router
Figure 26 - ATLAS design exploration flow.
Step 1 comprises the NoC configuration (e.g. specification of buffer depth, routing algorithm) and generation. In this step two NoC models (with the same configuration) are generated: HERMES (RTL description) and an actor-oriented model (XML description of RENATO or JOSELITO). The MAIA tool is used for HERMES generation [OST05], while the actor-oriented model is generated by a developed tool based on the API JDOM20. Step 2 generates different traffic patterns, for different injection rates and source/target pairs (e.g. random and complement). As described in [TED05], one important concept in traffic modeling is the packet timestamp, which defines the ideal moment that a packet should be inserted into the NoC by the source PE (P in Figure 26). The packet timestamp is calculated according different temporal traffic distribution (e.g. normal and uniform). All generated traffic files (step 2) are interpreted and injected to the NoC by producers (P), in step 3. The HERMES NoC is simulated using ModelSim® (RTL simulation), while actor-oriented NoC models are simulated in Ptolemy II framework. During the simulation, consumers (C) generate output files that are read by the traffic analysis module, when the simulation finishes (step 4). The traffic analysis module verifies if all packets were correctly received, and generates basic statistic data (e.g. a report file and graphics) concerning time to deliver packets (step 5). The report file presents some traffic analysis results, such as: (i) total number of received packets, (ii) average time to deliver the packets, in clock cycles, (iii) total time to deliver all packets, in clock cycles, and (iv) the average, minimal, maximal and standard deviation time to deliver a packet, in clock cycles. The step 6 uses a module called HEFESTUS to generate NoC power results (e.g. power reports). 4.5.1 Experimental Setup This Section presents simulation results of the implemented model obtained according to the validation process described below. The NoC Models (HERMES, RENATO and JOSELITO) are evaluated varying: NoC sizes: 2x2, 3x3, 4x4 and 5x5;
20 Available in: http://www.jdom.org/.
59
traffic distribution: uniform (200 Mbps), normal (minimal rate 150Mbps, maximal rate 250Mbps, and standard deviation 10Mbps), and Pareto on-off (200 Mbps, maximum number of bursts set to 10 packets); number of transmitted packets per producer: 100 packets (T1), 1000 packets (T2), 10000 packets (T3), and 20000 packets (T4). HERMES buffer depth: 8 flits. 4.5.2 JOSELITO Latency and Throughput Evaluation Figure 27 presents the average latency simulation difference (measured in clock cycles) of JOSELITO in comparison with HERMES for 3 different traffic distributions, 4 different NoC sizes and 16 flits per packet. The closer the lines are from the zero latency error, the more alike the latencies obtained for JOSELITO and HERMES are.
(a) Uniform Distribution
(b) Normal Distribution
(c) Pareto Distribution
Figure 27 - Latency difference in clock cycles between JOSELITO and HERMES for 3 different traffic distributions: (a) uniform, (b) normal, and (c) pareto on-off and NoC sizes (2x2, 3x3, 4x4 and 5x5), 16 flits packets.
The worst case average latency error presented is 2.18 clock cycles (Figure 27 (a) - 2x2 100 packets). In this specific worst case, JOSELITO average latency is 3.60% lower than the
60
reference model (according to the average absolute latency results presented in Table III The worst case throughput difference error of JOSELITO in comparison to HERMES is 0.1% when sending 20000 packets per producer in a 4x4 Pareto on-off traffic distribution; configuration which reflects multimedia applications behavior. Table III presents the absolute average latency and throughput simulation results for HERMES and JOSELITO using 16-flit packets (for simplification, the 2x2 results are not presented here, but it can be verified in [OST08]). These similar average throughput and latency results (Table III) between both models show that a high-level model can have high accuracy. Table III - Average latency (“L” - clock cycles) and throughput (“T” - % of the relative channel bandwidth) values for two NoC models: HERMES (“H” - RTL model) and JOSELITO (“J” - actor-oriented model). Uniform Distribution 3x3 L T L T2 T L T3 T L T4 T T1
H 70.99 7.21 70.75 7.29 71.09 7.20 71.22 7.25
J 70.83 7.17 70.81 7.28 71.22 7.20 71.30 7.25
4x4 H 87.68 4.37 85.97 4.55 85.08 4.53 84.93 4.51
Normal Distribution 5x5
J 87.54 4.34 85.96 4.57 85.07 4.53 85.00 4.52
H 113.68 3.1 109.46 3.1 108.31 3.1 107.92 3.11
J 113.85 3.13 110.05 3.13 109.21 3.11 108.94 3.14
3x3 H 63.32 7.28 61.85 7.13 61.10 7.06 61.09 7.09
J 62.64 7.34 61.50 7.13 60.66 7.06 60.62 7.09
4x4 H 73.96 4.37 73.85 4.44 73.31 4.42 73.33 4.45
Pareto On-Off Distribution 5x5
J 73.14 4.38 73.14 4.45 72.47 4.42 72.42 4.46
3x3
H J 92.91 93.7 2.94 3.02 94.91 93.75 3.05 3.05 93.57 93.38 3.07 3.09 93.97 93.67 3.07 3.09
H 55.35 5.30 55.96 6.80 54.71 7.12 54.92 7.02
J 54.44 5.31 55.24 6.81 55.30 7.11 55.44 7.08
4x4 5x5 H J H J 62.62 60.82 69.65 68.22 3.16 3.16 2.71 2.19 62.49 60.80 71.01 69.45 4.32 4.32 2.9 2.9 61.59 61.22 70.8 69.29 4.50 4.40 2.99 3 62.83 61.19 71.51 70.14 4.41 4.41 3.01 3.01
4.5.3 JOSELITO End-to-end Communication Evaluation End-to-end communication latency is an important performance metric, especially for realtime applications, where end-to-end communication time is an important issue. Due to the large number of simulations run (80) and the possible end-to-end communications, for instance in a 4x4 NoC allows 225 end-to-end communications (random spatial traffic distribution), only the end-toend communications presented in Figure 28 were evaluated according to the following scenario. The adopted scenario comprises of all nodes sending 20000 packets to all other nodes in a 4x4 NoC applying random spatial traffic distribution and Pareto temporal traffic distribution. 01
13
23
33
02
12
22
32
01
11
21
31
00
10
20
30
Pareto temporal distribution
Input files
Producer 00
node 00
Figure 28 - Evaluated end-to-end communications (sent communications from node 00 to other NoC nodes). For simplicity only the node 00 is illustrated in the figure.
61
Table VI presents the end-to-end communication latency difference between JOSELITO and HERMES models when 20000 packets are sent from the node 00 to all other possible targets in a 4x4 mesh NoC topology. Table IV - Average (Av.), Standard Deviation (S.D), Minimum (Min.) and Maximal (Max.) end-to-end communication latency values for HERMES and JOSELITO models. Number of packets (# Pkts). S: Source T: Target S T 00 10 00 20 00 30 00 01 00 11 00 21 00 31 00 02 00 12 00 22 00 32 00 03 00 13 00 23 00 33
# Pkts 1308 1325 1356 1303 1337 1350 1331 1377 1410 1334 1329 1324 1323 1314 1279
Av. 47.62 55.87 63.65 49.15 59.02 65.70 71.96 58.46 66.36 74.64 81.02 66.13 73.13 82.72 88.49
Latency HERMES (clock cycles) S.D. Min. 8.20 44.0 9.34 51.0 11.93 57.0 11.55 44.0 15.69 51.0 14.83 57.0 14.10 64.0 14.84 51.0 16.26 58.0 18.26 64.0 16.57 71.0 14.86 57.0 15.61 64.0 17.36 71.0 17.34 78.0
Max. 115.0 167.0 267.0 152.0 199.0 235.0 273.0 152.0 208.0 314.0 259.0 139.0 201.0 216.0 282.0
Av. 45.77 54.42 62.21 47.55 57.36 64.39 70.57 57.07 65.13 73.54 79.66 64.64 71.48 81.57 86.95
Latency JOSELITO (clock cycles) S.D. Min. 8.68 43.0 10.48 50.0 11.92 57.0 12.60 43.0 16.58 50.0 14.60 57.0 14.65 64.0 16.91 50.0 17.21 57.0 17.77 64.0 16.33 71.0 15.34 57.0 14.47 64.0 17.04 71.0 16.59 78.0
Max. 114.0 147.0 178.0 196.0 226.0 184.0 238.0 253.0 231.0 266.0 256.0 189.0 193.0 243.0 275.0
Av. 1.85 1.45 1.44 1.6 1.66 1.31 1.39 1.39 1.23 1.1 1.36 1.49 1.65 1.15 1.54
Difference (clock cycles) S.D. Min. -0.48 1 -1.14 1 0.01 0 -1.05 1 -0.89 1 0.23 0 -0.55 0 -2.07 1 -0.95 1 0.49 0 0.24 0 -0.48 0 1.14 0 0.32 0 0.75 0
Max. 1.00 20.00 89.00 -44.00 -27.00 51.00 35.00 -101.00 -23.00 48.00 3.00 -50.00 8.00 -27.00 7.00
In average 1334 packet are sent from the node 00 to a destination (e.g. node 00 sent 1308 packets to the Router 10, row 3 in Table IV). As shown in Table IV, much of the average (Av.), standard deviation (S.D), and minimum (Min.) end-to-end communication latencies’ difference between JOSELITO and HERMES models are negligible (less than 2%). On the other hand, as JOSELITO does not consider the buffer depth, the maximal end-to-end communication latency difference can be considerable in some cases (e.g. worst case differs by 101 clock cycles when one packet is sent from source 00 to the target 02). As mentioned before, this difference is due to the effect of connections that are released without considering a given blocking impact, increasing the possibility of loss of accuracy on blocking other packets. It is important to mention that the adopted injection rate is high (200 Mbps, maximum number of bursts set to 10 packets), implying in more blocking situations than it happens on real scenarios. 4.5.4 Limitation of the PAT In order to better explorer the impact of not considering the buffer size in PAT for latency evaluation, different packets sizes (16, 50 and 100 flits) were applied in JOSELITO model. The same packet sizes were injected into the HERMES model with 8-flit buffer depth. Figure 29 presents the JOSELITO latency difference in comparison with HERMES when applying different packet sizes inside both NoC models. The worst case difference presented by 100 flits is 6.59 clock cycles (Figure 29 (a), 100
62
packets) in average. In this specific worst case (packet size is 12.5 times bigger than the buffer depth), the absolute average latency to deliver all packets is 379.32 clock cycles in JOSELITO and 385.91 in HERMES. This represents only 1.71% average latency difference in comparison with the same case study in the reference RTL model.
(a) Uniform Distribution
(b) Normal Distribution
(c) Pareto Distribution
Figure 29 - Latency difference between a 4x4 JOSELITO and a 4x4 HERMES for 3 different traffic distributions (uniform, normal and pareto on-off) and 3 different packet sizes (16, 50 and 100 flits).
As can be seen in Figure 29, the latency error increases with increasing the packet size. It is important to remember that the packet size is usually chosen by network interfaces, which is outside the NoC model and can usually be calibrated to any possible size. Besides, applicationspecific NoC-based systems, for instance the 3GPP/LTE [CLE09], tend to employ small packets in order to reduce the communication latency, increasing the applicability of the proposed model. 4.5.5 Comparison Between JOSELITO and RENATO Models When validating the RENATO model, performance results were compared to the results of HERMES (cycle-accurate simulation) using different traffic scenarios and NoC configurations [IND08]. For long-lasting traffic, the error is about 10%, which is a very good figure considering that the actor-oriented model is based on the interactions only and works without a synchronizing clock signal. Note, for the sake of simplicity, the RENATO is compared only as reference model for simulation time, to enable the comparison between both actor-oriented models. Table V shows
63
that JOSELITO is in average 2.3 times faster than RENATO in 88% of the executed case studies. These improvements in simulation time were achieved only by reducing the number of communication events originally caused by the flit by flit forwarding. Currently, JOSELITO (code optimization without losing accuracy) can be 5-6 times faster than RENATO. Table V - Speed up of JOSELITO in comparison to RENATO. Uniform
Normal
Pareto On-Off
2x2 3x3 4x4 2x2 3x3 4x4 2x2 3x3 4x4 T1 2.51 2.41 2.93 5.95 2.00 2.08 2.45 2.34 2.34 T2 2.52 2.09 2.27 2.81 2.01 2.01 2.54 1.52 1.64 T3 2.53 1.78 1.99 1.82 1.39 1.67 1.78 0.72 0.74 T4 4.07 1.38 1.68 1.70 1.14 1.67 4.71 0.60 0.70
4.6 Debugging and NoC Power Analysis using Scopes An important issue in the design of complex system like NoC-based MPSoCs is the debugging. The debugging of such systems is difficult and time consuming because of the intrinsic lack of internal observability and controlability of its components [CIO08]. Thus, more appropriate debugging capabilities to design NoC-based MPSoCs are demanded in order to simplify the development of these systems [MAR06][ZEN10]. In this context, some authors propose the use of monitors, which can be attached to the NoC's components (e.g. router, NI) to increase its observability, as well as to collect internal performance data (e.g. link utilization) [CIO06][VER09]. The collected data can be useful to improve the performance evaluation of a given NoC-based MPSoC, for instance, optimizing the NoC communication usage in order to satisfy the application requirements. In this Thesis an actor monitor, called Router monitor, was developed to increase the NoC model observability and to provide the necessary information to estimate NoC power dissipation. As mentioned before, the power dissipation imposed by the NoC interconnect is a critical challenge in MPSoCs design. As classified in the Chapter 3 of this Thesis, NoC power dissipation is evaluated based on three power estimation models: (i) gate-level, (ii) volume-based model, and (iii) the adopted rate-based model. The NoC power estimation based on the first model (electrical simulation) is accurate when compared to the other two power models. However, it is very timeconsuming due to the number of details that must be considered to estimate the NoC power dissipation. Volume-based models estimate the average power as a function of the total transmitted data. Therefore, these models do not capture low-level effects, such as congestion and burstiness, being simple but inaccurate. In this context, the rate-based power model was proposed to achieve accurate power evaluation by considering those low-level effects. 4.6.1 Rate-based Power Model Rate-based power estimation model, introduced in [GUI08], is a trade-off between volumebased and gate-level power models: data volume is considered, but computed as a transmission
64
rate inside a given sample period; and accuracy is guaranteed from a physical calibration step, which defines the power dissipation for each transmission rate. Rate-based power estimation mode comprises two steps: calibration and application, left-hand side and right-hand side in Figure 30, respectively. The calibration step (1) obtains the relevant power model parameters used in the subsequent step. It starts with the logic synthesis of the RTL description of the NoC router (2), which maps it onto the target technology and generates a netlist. This netlist replaces one router of the original RTL description for a number of simulation runs (3) with different traffic scenarios, each of them with a fixed injection rate (4). The switching activity of each simulation run is analyzed by the Synopsys PrimePower estimation tool (5), which computes the average power dissipation of the components within each router: (i) buffers (responsible for at least 80% of the average power dissipation [PAL07]); (ii) internal crossbar and (iii) control logic. 1 Calibration step
7 Application step
Central router (5 input buffers)
2 Logical synthesis
Application Moddeling HERMES NoC and traffic generation using the ATLAS framework
Central router mapped description
3 Repeat for every injection rate
RTL simulation
8 Actor-oriented Simulation
Injection rate of the input buffers Traffic with fixed injection rate - from 5% to 50% of the available link bandwidth
4
For all routers
Switching activity of the central router (VCD file)
9 Compute the router power dissipation
Power estimation from PrimePower
5 Average power dissipation for a given injection rate
6 Equations derived from the power dissipation obtained from each injection rate
10 Total NoC power dissipation
Figure 30 - Extension of rate-based power estimation flow.
After the calibration phase, a power dissipation table is generated for each injection rate and router element (6). Using linear approximation, an equation that gives the power dissipation as a function of the injection rate is determined for each table. The second step of the proposed model is the application (7), which was adapted to obtain the reception rate at each buffer by simulating an actor-oriented NoC model under different traffic loads (8), for instance, using real applications as explored in the next Chapter of this Thesis. The
65
rates are measured by monitors inserted at each router buffer, counting received flits in a parameterizable sample window. For each reception rate, the associated power dissipation (Pbuffer) is annotated, applying the equations obtained in the calibration step (9). The power dissipation of the control logic (Pcontrol) and the crossbar (Pcrossbar) are obtained using the average buffers reception rate. The power dissipation of a router is given by Equation (5), where m represents the number of sampling periods and n is the number of buffers in this router. The NoC average power dissipation is given by the summation of the dissipation values of every router (10). n
Pbufferki
m i 1
Pavg
n
k 1
Pcrossbar Pcontrol
(5)
Power dissipated by different applications can be obtained without a new calibration. Recalibration is only necessary if some structural parameter changes (e.g. buffer depth, clock frequency). Congestion and burst effects are implicitly taken into account, since these effects change reception rates. Such model is highly customizable, and can be easily applied to different NoC architectures and technologies. 4.6.2 Comparison of Power Estimation Models Two scenarios were used to compare the power estimation models. The first evaluation scenario considers a set of traffic flows that generate congestion in the NoC channels. The experimental setup employs a 3x3 HERMES NoC with 16-bit flit width, 16-flit buffers, and 16-flit packets are injected into the network by every router. Routing adopts the XY routing algorithm. Two different injection rates are applied: (i) 1000 injected packets per router, at 120 Mbps (15% of the maximum link injection rate); (ii) 5000 packets injected per router, at 400 Mbps (50% of the maximum link injection rate). Table VI shows the power estimation values using Synopsys PrimePower, rate-based model and volume-based model.
Table VI - Average power dissipation results using a commercial power estimation tool (PrimePower), ratebased model, and volume-base model (NoC frequency: 50MHz). Traffic PrimePower Rate-Based Volume-Based
1000 packets @ 120 Mbps 283,00 mW 299,30 mW 405,49 mW
5000 packets @ 400 Mbps 288,00 mW 299,91 mW 442,60 mW
This experiment shows that the error induced by the volume-based power estimation model can be superior to 50%, when compared to the Synopsys PrimePower tool. The rate-based model maintains the error below 6% in the same comparison. The rate-based power model
66
presents such a small difference to the reference estimation because it considers blocked packets and burst transmissions, effects due to the congestion over the network. Considering Synopsys PrimePower as reference, Table VII shows the evaluation error between the two models. The second evaluation scenario estimates the execution time of the power estimation models. A similar experimental setup is used, with each processing element transmitting 10,000 packets, random spatial packet distribution, with an injection rate equals to 25% of the available link rate. Total power estimation time was approximately 20 hours with PrimePower, and less than 20 minutes with the rate-based model (Intel Core2 Duo 2.4 GHz, 2GB RAM). For the same traffic scenario, using a 4x4 NoC, the power estimation with PrimePower becomes unfeasible. It is important to mention that the volume-based model computation time is almost zero, since it corresponds to the application of simple equations. However, volume-based model can only be applied in situations with a small number of collisions between packets (absence of congestion), an unrealistic scenario for NoCs.
Table VII - Average power dissipation results using a commercial power estimation tool (PrimePower), ratebased model, and volume-base model (NoC frequency: 50MHz). 1000 packets @ 120 Mbps Rate-Based difference error 5,76% Volume-Based difference error 43,28% Traffic
5000 packets @ 400 Mbps 4,14% 53,68%
4.6.3 Actor-oriented Power Model Due to the advantages presented above, the rate-based model was integrated into the JOSELITO model, aiming to provide an accurate estimation of the power dissipated of NoC-based MPSoCs. Furthermore, the rate-based model was extended in this Thesis, in order to consider the link power dissipation, which is responsible for at least 17% of the router power dissipation [KAH09]. As mentioned before, JOSELITO was developed in Ptolemy II, but other environments supporting actor semantics could be used as well. Besides, Ptolemy II supports application modeling using multiple models of computation (e.g. finite-state machines, process networks, discrete events), allowing applications to be described using time and concurrency primitives that better reflect their nature. This possibility is explored in the next Chapter of this Thesis. To integrate the rate-based power estimation model into JOSELITO model (PAT-based NoC model), a number of equations (2, 4 and 6) were incorporated into the input buffer and arbiter actors. Besides, the PowerScope and a monitor actor were implemented as part of this Thesis. PowerScope is a parameterizable actor developed to display graphically the NoC power dissipation during simulation. The monitor actor, called Router monitor - Figure 31 (a), is used to collect the average
67
reception rate of each input buffer and the switching activity of its associated link. By means of the PowerScope, the total NoC power dissipation (and energy consumption) is calculated and displayed during the simulation, as illustrated in Figure 31 (b). This feature can help designers to detect power hotspots, enabling, for example, different application mapping targeting low-power budget. PowerScope generates graphics (e.g. Figure 38), and a report of energy consumption, maximum, minimum and average power per router. N
Router monitor Scope
W
average reception rate
S
E
L
(a)
(b) Figure 31 - 5x5 NoC and the PowerScope.
PowerScope uses the following power parameters, obtained in the calibration step (Figure 30): (i) switch control base dissipation; (ii) switch control variable dissipation; (iii) buffer base dissipation; (iv) buffer variable dissipation; and (v) link switch activity. During the simulation, i.e. application step (Figure 30), the actor model computes the following values: 1. Each buffer computes its average reception rate avrr according to Equation (6) where: recPkts is the number of received packets in the sample window; flit is the flit size; T is the clock period; and sw the sample window in clock cycles. avrr
recPkts pktSize flit T sw
(6)
2. The power dissipation of the links (LinkPD) is calculated according to the following equations:
link BPD
LinkPD
Cload
linkBPD
fNoC Vcc 2
w
avrr
(7) (8)
where: Cload: represents the total switching capacitance of the wires fNoC: is the NoC frequency w: is the number of the wires used for data transmission α: is the link switch activity
The router monitor collects the average reception rate of each buffer avrr, Equation (6),
68
and the switching activity of its associated link, which are sent to PowerScope at the end of each sample period. The power dissipation is obtained by applying avrr to the individual power equations (6 in Figure 30, Pbuffer, Pcrossbar and Pcontrol). The power dissipation of the router is then computed from Equation (5). 4.6.4 Comparison between RTL and Actor-Oriented Models for Power and Energy Estimation
This section compares two implementations of the rate-based model, using two abstraction levels, RTL (HERMES-HEFESTUS) and actor oriented (JOSELITO-PowerScope). The experimental setup uses a 4x4 2D-mesh NoC running at 50 MHz, with 16-bit flit width, 8-flit buffer depth, XY routing algorithm and handshake control flow. The maximum link rate is 800 Mbps. The following traffic parameters vary: packet size: 32 and 64 flits; temporal traffic distribution: uniform (200 Mbps), normal (minimal rate 150Mbps, maximal rate 250Mbps, and standard deviation 10Mbps), and Pareto on/off (200 Mbps, maximum number of bursts set to 10 packets); spatial traffic distribution: complement and random; number of packets: 100 (traffic T1), 1,000 (traffic T2), and 10,000 (traffic T3). Table VIII presents the difference in the average power dissipation between the JOSELITO model and the HERMES RTL model. Note that the traffic scenarios induce network congestion, which implies in blocked packets. Even with injection rates near to the network saturation point (mesh networks saturate when injection rates are between 20% and 30%) and collision between packets, both implementations of the rate-based model at the RTL and actor-oriented abstraction level present similar results. The clear advantage of the actor-oriented model is its faster construction, validation and debugging, enabling faster population and exploration of the design space. Such accurate power evaluation at higher abstraction level is possible because the estimation model is based on the buffer reception rates, sampled at fixed periods, and it can be properly captured in the actor-oriented model. The difference in the average energy consumption between JOSELITO and RTL model was also evaluated, as reported in Table IX. Applying packets with 32 and 64 flits through the NoC, the worst-case difference is presented when 10000 packets (Pareto on-off distribution), are sent per producer over the NoC. In this case, the difference on the average energy consumption to deliver all packets is only 0,001247 mJ between both models (in practice, an error of 0%). Table VIII - Average Power Dissipation difference between Model RTL and JOSELITO, using random (R) and complement (C) traffic distribution. T1, T2, T3 means 100, 1000 and 10,000 packets with 32 and 64 flits.
69 Uniform Distribution Model RTL JOSELITO Difference (mW) (mW) (mW) 302,35 302,35 3,22E-06
Normal Distribution Model RTL JOSELITO Difference (mW) (mW) (mW) 303,07 303,07 3,64E-06
Pareto Distribution Model RTL JOSELITO Difference (mW) (mW) (mW) 288,77 288,77 1,11E-06
T1 (R)
32 64
303,23
303,23
5,02E-06
303,20
303,20
5,94E-06
289,05
289,05
3,20E-06
T1 (C)
32
311,25
311,25
5,06E-06
311,25
311,25
4,78E-06
292,23
292,23
3,26E-06
64
311,86
311,86
5,65E-06
311,86
311,86
5,89E-06
292,64
292,64
4,50E-06
T2 (R)
32
303,94
303,94
2,81E-06
303,89
303,89
3,45E-06
289,02
289,02
1,85E-06
64
303,86
303,86
4,69E-06
303,93
303,93
5,81E-06
289,65
289,65
3,95E-06
T2 (C)
32
312,88
312,88
5,02E-06
312,75
312,75
4,78E-06
293,70
293,70
4,57E-06
64
312,95
312,95
5,37E-06
312,88
312,88
5,43E-06
293,64
293,64
5,17E-06
32
303,99
303,99
3,06E-06
303,94
303,94
3,48E-06
288,99
288,99
1,89E-06
64
303,99
303,99
4,78E-06
303,96
303,96
5,88E-06
289,61
289,61
3,91E-06
32
313,00
313,00
5,03E-06
312,96
312,96
4,88E-06
293,05
293,05
4,56E-06
64
312,17
312,17
5,26E-06
312,95
312,95
5,38E-06
293,25
293,25
5,09E-06
T3 (R) T3 (C)
Because JOSELITO abstracts the buffer size, increasing the packet size (considering the same buffer depth) leads to a larger error on the average energy consumption. For example, considering Pareto on-off traffic distribution, 8-flit buffer depth and a packet size of 32 and 64 flits, the worst-case difference increases 0,000681 mJ to deliver 160,000 64-flits packets (16 routers delivering each one 10,000 packets). The difference can also be considered insignificant, taking into account that even assuming a packet size 8 times bigger than the buffer depth the error is still in practice 0%. In terms of simulation time, results show the speed-up obtained using the actor-oriented model (JOSELITO-PowerScope), w.r.t the RTL model (HERMES-HEFESTUS) considering traffic with small number of packets (e.g. T1, 100 packets per producer), as demonstrated in Table X. In these simulated scenarios, the actor-oriented model was faster than RTL model.
Table IX - Average Energy Consumption difference between Model RTL and JOSELITO, using random (R) and complement (C) traffic distribution. T1, T2, T3 means 100, 1000 and 10,000 packets with 32 and 64 flits. Uniform Distribution Model RTL JOSELITO Difference (mJ) (mJ) (mJ) 163,27 163,27 1,74E-06
Normal Distribution Model RTL JOSELITO Difference (mJ) (mJ) (mJ) 163,66 163,66 1,96E-06
Pareto Distribution Model RTL JOSELITO Difference (mJ) (mJ) (mJ) 381,17 381,17 1,47E-06
T1 (R)
32 64
321,42
321,42
5,32E-06
321,40
321,40
6,29E-06
745,76
745,76
8,27E-06
T1 (C)
32
168,07
168,07
2,73E-06
168,07
168,07
2,58E-06
385,75
385,75
4,31E-06
64
330,57
330,57
5,99E-06
330,57
330,57
6,24E-06
749,18
749,18
1,15E-05
T2 (R)
32
1562,26
1562,26
1,44E-05
1568,10
1568,10
1,78E-05
3693,74
3693,74
2,36E-05
64
3123,69
3123,69
4,82E-05
3124,46
3124,46
5,97E-05
6974,82
6974,82
9,52E-05
T2 (C)
32
1608,23
1608,23
2,58E-05
1613,81
1613,81
2,46E-05
3489,16
3489,16
5,43E-05
64
3210,88
3210,88
5,51E-05
3216,46
3216,46
5,59E-05
6982,90
6982,90
0,000123
T3 (R)
32
15570,79
15570,79
0,000157
15586,36
15586,36
0,000178
37135,51
37135,51
0,000243
64
31141,22
31141,22
0,000490
31187,08
31187,08
0,000603
70098,26
70098,26
0,000946
T3 (C)
32
16038,35
16038,35
0,000258
16048,84
16048,84
0,000250
36415,41
36415,41
0,000566
64
32778,61
32778,61
0,000553
32108,84
32108,84
0,000552
71859,65
71859,65
0,001247
Table X - Speed up of actor-oriented power model in comparison to RTL power model for 3 traffic distributions with 100 packets.
70 Power model\Traffic
Uniform
Normal
Pareto
RTL - HEFESTUS
45 sec.
45 sec.
49 sec.
Actor-oriented -PowerScope
26 sec.
27 sec.
28 sec.
Speed-up Factor
1,7307
1,6666
1,75
For the traffic scenarios T2 and T3, the simulation of the RTL model is, in average, 2.6 times faster than the actor-oriented model. The number of necessary simulation events to deliver all packets (assuming that one Ptolemy II simulation cycle corresponds to a RTL clock cycle) explains the increased simulation time. This is probably due to the fact that the proposed actor-oriented model is implemented on top of Ptolemy II, which is a Java application running on interpreted mode on top of a virtual machine with restricted heap space and managing memory using garbage collection. All such implementation aspects contribute to the simulation slowdown (the simulation server has to spend much of its processing capacity on memory management rather than on the simulation process itself). This is acceptable as a proof-of-concept, but additional work on compiling Ptolemy II to native code and reducing the memory management overhead is needed to make the proposed technique competitive in simulation time, in comparison with current commercial tools.
4.7 Chapter 4 – Closing Remarks The major contribution of this Chapter is describing a set of modeling techniques that can be used to create simplified NoC models that are easier to design, setup, debug and visualize results when compared to RTL or even TLM. In this context, a contribution is the identification of the elements of a NoC that can be abstracted away (and those that cannot), by applying the payload abstract technique, ensuring accurate performance analysis, such as latency, throughput and power dissipation. The high accuracy achieved is an important contribution, hence accurate system modeling becomes especially important to the design of complex systems like NoC-based MPSoCs [ZEN10]. In addition, presented results prove that the proposed simplified NoC power estimation model can be faster when compared to RTL models, due to the design flexibility, setup and debugging features, without significant loss of accuracy. By using the proposed NoC models, a designer can quickly change NoC configurations (e.g. routing and arbitration algorithms), then simulate the model in Ptolemy II and obtain figures for performance. Other benefits of the proposed model-based approach are the system observability and debugging capacity achieved by using monitors and graphic tools enabling the visualization, for instance, of the power dissipation at run-time. As defined in [IND08], according to the proposed approach, three different levels of debugging are provided: (i) code-level debugging – this level supports the debugging of the internal functionality of the individual actors implemented within Ptolemy II. It can be done with regular programming code debugging tools like Eclipse, and is mainly used to verify if the
71
sequential algorithm within a particular actor (for instance, the routing algorithm implemented in the arbiter actor) works properly; (ii) interaction-level debugging – It uses textual output to inform the sending and receiving of each of the messages denoted in the sequence diagrams along with their timing information. To avoid overflow of information, it is possible to track the activity of any individual actors (for instance, observing only the input buffer of the direction “north” of the router with XY address “11” on a mesh); (iii) system-level debugging – a number of extended observability resources were implemented within the context of this work. They are extensions to Ptolemy II and can be plugged in different parts of the NoC model, working as scopes which collect data from the network, process and display it graphically, for instance the PowerScope presented in this Chapter. Finally, the proposed models are slower, in almost all simulated scenarios (with the exception of results presented in Table X), than the reference RTL model. Having said that, it was expected since the comparison is between a proof-of-concept tool executed over a virtual machine with commercial tools that are compiled to native code and that have been exhaustively optimized over the past decades. In any case, the obtained results point to promising future work on optimizing memory management of the simulator and the further reduction of simulation events (for instance, by abstracting the internals of the arbitration algorithm). Another alternative to solve the memory management problem would be to reimplement this approach using simulation frameworks based on C++, such the multi-MoC extensions for SystemC done in [PAT04][PAT07].
72
73
5. MODEL-BASED DESIGN FLOW FOR NOC-BASED MPSOCS This Chapter presents the second main contribution of this Thesis, the integration of the proposed models into a model-based design flow. This model-based design supports the creation of a unified model, illustrated in Figure 32, which comprises three-layer models: (i) application model, (ii) platform model, and (iii) mapper model. The three-layer models are described in the beginning of this Chapter. Furthermore, a model-based design for NoC-based MPSoCs, is proposed. Finally, to validate the proposed approach, the Chapter includes a case study with the design space exploration of a NoC-based MPSoC running four applications.
5.1 Application Model Layer In this layer, designers specify application blocks, implemented here as a set of communicating application actors (e.g. AB1 and AB2 in the upper part of Figure 32), according to the modeling strategy proposed in [MÄÄ08][MÄÄ10]. Application blocks may contain 1 or more tasks that execute sequentially. For instance, the application blocks represented by AB4 with tasks T1 and T2 (represented as circles in Figure 32). Application actors have input and output ports for sending and receiving messages. UML sequence diagrams (SDs like SD1 and SD2 in Figure 32) are sequencing actors that constrain the order of the messages exchanged by application actors. Application actors are defined as active or passive and are represented as lifelines within one or more SDs (for instance, AB4 is represented in both SD1 and SD2). Active actors (e.g. AB1) are those that initiate a communication, while passive actors (e.g. AB2) react or initiate a communication after receiving a message from an active actor. Taking into account the foundations mentioned above, the application model is formally described. Assuming that A is a set of actors and C is a set of communication links, formally an application model is a directed bipartite multigraph, G (A, C). Given that AB is a set of application actors and SA is a set of sequencing actors, A = AB υ SA. For the example in Figure 32, AB = {AB1, AB2, AB3, AB4, AB5, and AB6}, while AS = {SD1, SD2}. The set EM = {m1, m2, m3, m4, m5, m6, m7, m8, m9} represent the messages exchanged by the application actors in the application model illustrated in Figure 32. Following, C is the vertex set of G and represents all communication links in the application model. C is in fact a set of triples with C AB x AS x EM υ AS x AB x EM. Each communication link is defined by two triples in C. For the example in Figure 32 AB1 and AB2 exchange m1. This is represented in C by the elements AB1, SD1, m1), SD1, AB2, m1). The whole C set for the example in Figure 32 is: C = AB1, SD1, m1), SD1, AB2, m1), AB2, SD1, m2), SD1, AB1, m2), AB1, SD1, m3), SD1, AB3, m3), AB3, SD1, m4), SD1, AB4, m4), AB4, SD1, m5), SD1, AB3, m5), AB3, SD1, m6), SD1, AB4, m6), AB4, SD2, m7), SD2, AB5, m7), AB5, SD2, m8), SD2, AB6, m8), AB4, SD2, m9), SD2, AB6, m9)}.
74
APPLICATION MODEL
Director 1 AB4 internal view
Sequence diagram (SD) m1
AB1
m3
AB2
m2
Director 2 AB1
1
8
m1 m2
m4
AB3
AB2
AB3
T1
m7
Director 4
T2
Sequence diagram (SD)
Director 3 m1
UML Sequence m3 Diagram
AB4
m3
m4 m5 m6
m5
m4
m5
AB4
m5
AB5
m7
m6
m8
m9
3
informations from application model informations from platform model
m9
Mapping table
Mapper Actor
mapping heuristics
notifications to platform model
PE
LIFELINES
00
AB3, AB4
10
AB5
01
AB1 AB2
11
AB6
notifications to application model
6
4
m3
communication link
AB6
7
MAPPER MODEL
PLATFORM MODEL
mapped lifelines
AB2
m8
AB5
notifications from platform model
AB6
AB1
AB5j
m8
par
m9
C link
AB6
m7
m7
m8
message notifications from application model
AB5i
SD2
m9
m6
m2
2
m6
m4
AB4
AB5 internal view
m5
SD1
PE 11 Router 11
PE 01 m3
Router 01
NoC
scope
PACKETS of m3
Router 10 scope
AB5
Router 00
AB3
5
PE 10
AB4
m3
local port
performance metrics capture and analysis
PE 00
Figure 32 – An example of a unified model representation. Figure extended from [MÄÄ10].
Next, sequence actors can be defined according to the UML 2.0 specification, which enables designers to model sequence diagrams by using combined fragments and interaction operators, such as option (opt), and parallel (par). Thus, applications can be specified with communication behaviour that includes parallel, optional, and iterative triggering of messages. For the example in Figure 32, the SD2 supports the parallel execution of both m8 and m9 messages, by using the par interaction operator. It is out of the scope of this Thesis to investigate and to present a review of UML 2.0 specifications features, for such documents like UML 2.0 specification21 can be used.
21 Available in: http://www.omg.org/cgi-bin/doc?ptc/2003-08-02.
75
Each sequencing actor (e.g. SD1) has a director (e.g. Director 2) for controlling its execution (messages' delivery order between application actors). Total order and partial order directors, SDTODirector and SDPODirector respectively, proposed in [IND07][IND07b], are examples of supported directors. As defined in [MÄÄ10], the total order director maintains the order of the messages of a sequence diagram whereas the partial order director maintains the order separately on each lifeline. Such directors are the link between both application and mapper layers (as discussed in the Section 5.4). Once the application model is defined, the designers need a platform model to validate the application functionality and evaluate its performance.
5.2 Platform Model Layer A platform can be seen as a directed graph H = G(P,C), where P is a set of processors and C are the communication channels through which the processors exchange data packets. The platform model layer comprises: NoC models, abstract and scopes, as illustrated in the bottom of the Figure 32. Examples of supported NoC models were described in Chapter 4 of this Thesis. Due to the flexibility of the present approach, the platform model layer is independent from the application model layer. Thus, different communication infrastructure models (e.g. BOÇA NoC model described in [MÄÄ10]) can be integrated without changing the other layers. This flexibility enables the designer to evaluate the performance of an application running over different configurations (e.g. RENATO model varying the buffer depth), or even completely different platforms (e.g. not based HERMES infrastructure NoC models). In addition, PEs implements nonpreemptive first in first served scheduling policy (that is, once a task is running, it is never interrupted), and they only differ according to their control flow. Different scheduling polices could be implemented to evaluate, for instance, the impact of the mapping for real time applications. NoC-based MPSoC designers might be interested in observing a specific component (e.g. central router) or even a particularity of system at (e.g. mapping time at system start-up) or during a specific time (e.g. reception rate at a buffer, during 1 second), considering the traffic load imposed by different applications executing in parallel. Therefore, designers need adequate possibilities of observing and debugging the execution of a set of applications running on top of a NoC model. In this context, the platform model layer includes Scope actors that can be used to check the running status of the system, as well as to collect performance figures that can be used for application/platform model optimization. For instance, the PowerScope is proposed in this Thesis and integrated to the NoCScope framework [MOL09]. The NoCScope is a composition of a set of scopes, such as: BufferScope, InputScope, OutputScope, EndToEndScope, and PointToPointScope.
5.3 Mapper Model Layer The mapper model layer establishes the link between application and platform models, as illustrated in the middle of Figure 32. The main function of this layer is enabling the joint-
76
execution of applications running on top of the NoC-based platform models. The joint-execution enable designers to analyze the impact of a set of applications running in parallel when they are executed on a particular platform. This layer comprises the Mapper actor, which has access to information from both the application (by communication with the directors of sequencing actors) and platform models (by communication with the abstract PEs). A lifeline is the smallest grain of the proposed mapping approach and the Mapper can map one or more lifelines onto one of the available PEs of the platform, defining it as mono or multitask (indicating that more than one lifeline is mapped onto it). For the example in Figure 32, PE 01 (AB1 and AB2) and PE 00 (AB3 and AB4) are considered multitask, whereas PE 10 and PE 11 are mono-processors. The Mapper defines its lifeline mapping table according to the static mapping heuristics that were incorporated into this mapper model layer by integrating the CAFES tool [MAR05b][MAR08]. Other tools could also be used for mapping definition, but CAFES was chosen, since it include several mapping heuristics, such as: exhaustive search (ES), simulated annealing (SA), taboo search (TS), and greedy incremental heuristic (GI) [MAR08], increasing the design space exploration. Therefore, the presented approach is extensible, enabling different mapping algorithms and heuristics to be implemented and integrated into the mapper layer without changing the other layers.
5.4 Unified Model Execution Flow Figure 32 enumerates the execution of the unified model, from the sending and receiving times of a message (m3). Assuming that messages m1 and m2 were already sent and received to/by their applications blocks. The application block AB1 sent the message (m3) to the sequencing actor (SD1), which receives it (1). When m3 is received, a pre-defined message within its sequence diagram is triggered, (according to the example, the message m3 sent from lifeline AB1 to lifeline AB3) - (2). When this happens, the corresponding director Director 2 interrupts the delivery and notifies the mapper about the message (3). Since the mapper is responsible of assigning each lifeline to a PE, it knows that for instance lifeline AB1 is mapped to PE 01, whereas AB3 is mapped to PE 00. Once the mapper receives the information about the triggered message, it will command the processing element (PE 01) associated to the sender of the message (m3) to generate the corresponding traffic into the NoC platform. Thus, it must create a packet (according its structure) and write this packet on the local input port of the corresponding Router 01 – (4). Then the mapper waits until the processing element (PE 01) associated to the receiver of the message (m3) notifies the complete reception of the packet (5) and (6). Upon notification, the mapper calls back the Director 2 (which has notified the triggering of the message) and informs it that the message can now be delivered (7). After that, the Director 2 can forward the message to the output port of the SD1, and the message reaches its destination (AB3) with the exact latency that it would take if the application is executed on top of the implementation platform (8). The effective comparison of design alternatives of NoC-based MPSoCs requires a complete design flow including application and platform modeling, mapping and evaluation tools. The
77
proposed model-based design flow, developed under Ptolemy II framework can fulfill the requirements mentioned above.
5.5 Model-based Design Flow The proposed design flow, as illustrated in Figure 33, adopts actor-oriented models for both applications and platforms, as previously presented. As defined in [GAJ05], a design flow is a sequence of design steps that are necessary to take the system specification to the manufacturing. The proposed model-based design flow can be used for early design space exploration of NoCbased MPSoCs and it comprises the steps described below: Application Model with actors and UML Diagrams m1
(A)
AB1
AB4 internal view
Application Modeling
AB1
m2
AB2
T2
AB3 T1
AB2 m1
AB4
m6
m3
m4 m5
m4
m6
m6
m5
Pseudo C Description AB1.c
AB2.c
AB3.c
AB4.c
M 2
3 M
M 1
m2
m5
CWM Graph Description
AB1
AB4 m1
m5
m6
Application graph and C code Generation
AB3 UML Sequence m3 Diagram
m2
m4
m4
AB3 A
3s
m
AB2
M 5
(B)
Director
m3
AB4
CAFES´ Mapping AB3
AB1
NoC
AB2
AB4
NoC Characterization
(D)
Platform and Scopes Selection
NoC
Scopes
NoC Dimesion
PowerScope
Buffer depth
ChannelScope
Number of Virtual Channels
BufferScope
Control Flow
Point2pointScope
HopSpotScope
Vergil (PtolemyII Interface)
(E)
Calibration
(C)
Mapping Files
Mapping heuristics (CAFES)
Hemps Mapping File
Unified Model Simulation (Ptolemy II)
NoC Dimension 2x2 [allocated tasks] AB4.c router 00 .. .
Pseudo C code #include "../../task.h" Message m4, m5, m6 m4.lengh = 128; .. . Receive(m4, AB3); .. .
Hemps Editor
(F)
Reports and Analysis Results
Constraints ok?
Figure 33 - Proposed model-based design flow.
78
Application Modeling: in this step designers can model application blocks as described in Section 5.1. In addition to the sequencing actors/directors proposed in [IND07][IND07b][MÄÄ08][MÄÄ10], a set of actors were built in order to facilitate the modeling of applications, as streaming applications like MPEG. Those application actors were built with a set of parameters, which are useful to model the application and to generate C code description as well. At this level, designers have to characterize the application model by defining some constraint, like the period of an active actor (e.g. AB1, as illustrated in Figure 33 (A)) or even the data size of a message, as proposed in [MÄÄ09]. The period defines how often an active actor initiates a given communication. By analyzing how often each actor executes and its communication patterns, the model can characterize the processor workload imposed by the execution of each application block. In turn, the data size defines the number of packets (considering the desired packet size) required to transfer a message through the NoC. By varying this constraint it is possible to analyze the trade-off between packet size and buffer depth, as investigated in [TED08]. Application Graph and C Code Generation: Ptolemy II was extended so that it can parse the application model (e.g. UML Sequence Diagrams, message sizes) and generate a graph description according to a communication weighted model (CWG) used in CAFES [MAR05]. In this work, CWG nodes represent lifelines and edges represent the communication between them. Each edge contains a message (communication weight - total number of flits sent from a source to a target-). A message can represent the sum of all exchange messages that represent the communication activity between a pair of lifelines, as illustrated in the CWG graph in Figure 33 (b), AB3 sent m4 and m6 to AB4 and both messages are represented by its sum (A3sm). In addition, it is possible to generate pseudo C codes that can be executed by HEMPS platform, as the one illustrated in Figure 34 (b). HEMPS is a homogeneous NoC-based MPSoC platform [CAR09b]. The main hardware components are the HERMES NoC and the 32 bits MIPSlike processor Plasma. A PE wraps a Plasma and attaches it to the NoC. PEs also contain a private memory, a network interface, and a DMA module. PEs can be master or slave. The master is responsible for system management, including: (i) task mapping, (ii) broadcast of control messages (unicast based), (iii) monitoring management, (iv) reception of control messages, as end of task and debug packets. On the other hand, slave PEs are those that execute application tasks. Two groups of primitives are supported: debugging primitives (e.g. Echo, GetTick) and communication primitives (e.g. send and receive). Mapping: in this step, the generated CWG graph is used as input to the mapping tool, which maps application blocks onto PEs connected to the NoC model. For the example in Figure 33 (C), AB4 is mapped onto PE connected to the bottom left router of the mesh NoC. Here, designers have to apply a mapping heuristics to define a possible application-platform mapping that can satisfy the application requirements. Once the application-platform mapping is defined, the mapping tool generates two files. The first file is used as input by the Mapper Actor, which defines its Mapping table, as described in Section 5.3 of this Chapter. The second file is used by the HEMPS Editor tool to define the mesh NoC dimension, as well as the mapping of the generated tasks (C
79
code). Pseudo C Code
Sequence diagram (SD)
A B C
INITIAL TIME
m1
Director
data size contrait = LENGHTH_X
A
B
m2
C
D m1
UML m1 Sequence Diagram m2
m2 m3
D
m3
m3
INTERVAL between messages SIMULATION TIME (CLOCK CYCLES)
Simulation STOP TIME
1. #include "../../include/task.h" 2. #include "../../include/stdlib.h" 3. 4. Message msg1; 5. 6. int main() 7. { 8. 9. int i, j; 10. 11. Echo("Communication task A started."); 12. Echo(itoa(GetTick())); 13. 14. msg1.length = LENGHTH_X; 15. for(i=0;i VOPrec StripeM => IQuant VOPme => Pad ACDC => IQuant Iscan => ACDC UPSAMP => VOPrec Pad => VOPme IDCT => UPSAMP VOPrec => Pad ARM => IDCT ACDC => StripeM Run => IScan VLD => Run
SA
TS
GI
Random
Max.
Min.
Av.
Max.
Min.
Av.
Max.
Min.
Av.
Max.
Min.
Av.
799,00
799,00
799,00
799,00
799,00
799,00
1.188,00
834,00
851,42
980,00
834,00
844,65
1.093,00 1.085,00 1.085,26 1.093,00 1.093,00 1.093,00 1.093,00 1.085,00 1.085,26 1.524,00 1.120,00 1.162,26 168,00
98,00
100,26
163,00
91,00
93,32
178,00
98,00
100,58
207,00
119,00
132,74
234,00
234,00
234,00
227,00
227,00
227,00
248,00
248,00
248,00
443,00
255,00
298,23
889,00
807,00
809,65
891,00
807,00
809,71
1.299,00
849,00
965,71
1.333,00
849,00
979,06
807,00
807,00
807,00
807,00
807,00
807,00
807,00
807,00
807,00
1.002,00
850,00
869,35
691,00
683,00
683,26
690,00
690,00
690,00
741,00
725,00
726,68
1.552,00
718,00 1.107,16
716,00
710,00
710,19
703,00
703,00
703,00
730,00
724,00
724,58
953,00
731,00
741,58
793,00
793,00
793,00
793,00
793,00
793,00
835,00
821,00
821,90
834,00
814,00
816,26
703,00
703,00
703,00
710,00
710,00
710,00
741,00
731,00
731,39
791,00
731,00
734,48
142,00
126,00
126,84
105,00
105,00
105,00
97,00
91,00
91,39
114,00
112,00
112,13
129,00
129,00
129,00
136,00
136,00
136,00
175,00
171,00
171,19
160,00
150,00
151,94
807,00
807,00
807,00
807,00
807,00
807,00
807,00
807,00
807,00
1.354,00
842,00
894,06
161,00
161,00
161,00
161,00
161,00
161,00
165,00
159,00
161,19
177,00
175,00
175,06
5.7 Chapter Closing Remarks This Chapter presented a model-based methodology and a supporting toolset that enable the design space exploration of NoC-based MPSoCs at early stages of the design flow, when most of design decisions are actually taken. It uses an actor-oriented simulation framework that captures the dynamic behavior of the NoC components and feeds its parameters to a group of Scopes, providing accurate performance evaluation. The accurate performance evaluation is achieved by calibrating the proposed high level models using a reference design model, for instance an RTL implementation. Due to the flexibility of the proposed approach, complete separation between application
85
and platform models, designers do not have to restrict themselves to a single platform template, and they can successively evaluate the performance of an application running over different platforms (already supported or that can even be implemented and integrated into the proposed model-based design flow), allowing extensively exploration. This flexibility can significantly reduce the design time, starting from system-level specification and going down to a more detailed implementation (e.g. HEMPS). By integrating the rate-based power estimation method into the proposed design flow, it is possible to obtain accurate NoC power results (e.g. hot-spots, peak power values) of multiapplications mapped onto NoC-based MPSoCs platforms. These results could not be obtained using current volume-based models, since they do not consider NoC low-level effects. Presented experiments show how the proposed model-based flow can support designers on the evaluation of mapping heuristics, aiming to reduce end-to-end communication latency, power and the occurrence of hot-spots.
86
87
6. CONCLUSION AND FUTURE WORK The most promising technique to explore the complex design space of NoC-based MPSoC platforms is to build simpler, more abstract models of applications and platform components, and to evaluate the impact of alternative compositions on performance and power dissipation. The accuracy and speed of such evaluation must be high, and the effort to build and compose such models must be very low, so that they can provide meaningful results early on the design flow. This Thesis addressed important issues in this scenario. In this context, the main contributions, publications, and future works related to this Thesis are detailed as follows.
6.1 Thesis contributions High abstraction and high accuracy models: Inaccurate models can lead to wrong design decisions, which can be significant to the failure of a product. In this scenario, the first contribution of this Thesis comprises the proposition of simple, flexible and accurate NoC architectures models, which provide accurate results when are comparable to those obtained using commercial RTL evaluation tools. In addition, a novel technique that can be used to model wormhole packet switching NoCs, in order to reduce the simulation time, while still obtaining accurate results for latency, throughput and power estimation, was also proposed within this Thesis. Another contribution of the proposed approach is the possibility of using high level monitors that can be attached to a graphical interfaces, allowing the analysis of different performance metrics over simulation time. Model-based design flow: the second main contribution of this Thesis is a model-based flow that comprises accurate executable models and a toolset that enable the design space exploration of NoC-based MPSoCs at early stages of the design flow. By using this flow, designers can explore different design alternatives regarding the design space of application-mapping-NoC platform point of view. The proposed approach supports the evaluation of system performance (application-mapping-platform) using different views of the platform model (already supported or that can be integrated), differing in accuracy and simulation speed. Benchmarking: A real case study, comprising four real applications, was employed to demonstrate the potential of the presenting approach, evaluating the impact of different design alternatives, varying some performance characteristics (e.g. injection rate), as well as different mapping heuristics.
6.2 Publications The following papers, related with the work presented in this thesis, have been published or submitted for publication:
88 Indrusiak, L. S.; Ost, L.; Möller, L.; Moraes, F. and M. Glesner. Applying UML Interactions and Actor-oriented Simulation to the Design Space Exploration of Network-on-Chip Interconnects. In: ISVLSI, 2008, pp. 491-494. Ost, L; Möller, L.; Indrusiak, L.; Moraes, F.; Määttä, S.; Nurmi, J. and Glesner, M. A Simplified Executable Model to Evaluate Latency and Throughput of Networks-on-Chip. In: SBCCI, 2008, pp. 170-175. Varyani, S.; Lui, T.; Indrusiak, L. S.; Ost, L., Möller, L. and Glesner, M. Experimental review of task mapping algorithms for NoC-based Multiprocessor Systems-on-Chip. In: ReCoSoC, 2008, pp. 22-28. Määttä, S.; Indrusiak, L.S.; Ost, L.; Möller, L.; Nurmi, J.; Glesner, M. and Moraes, F. Validation of Executable Application Models Mapped onto Network-on-Chip Platforms. In: SIES, 2008, pp. 118-125. Ost, L.; Indrusiak, L. S.; Guindani, G.; Reinbrecht. C.; Raupp, and T.; Moraes, F. A high abstraction, high accuracy power estimation model for networks-on-chip. In: SBCCI, 2009, pp. 193-198.
(best paper award)
Määttä, S.; Indrusiak, L.S.; Ost, L.; Möller, L.; Glesner, M.; Moraes, F. and Nurmi, J. Characterizing Embedded Applications using a UML Profile. In: SoC, 2009, pp. 172-175. Määttä, S.; Möller, L.; Indrusiak, L.; Ost, L.; Glesner, M.; Nurmi, J. and Moraes, F. J Joint Validation of Application Models and Multi-Abstraction Network-on-Chip Platforms. Journal of Embedded and Real-Time Communication Systems (IJERTCS), v. 1(1), 2010. Indrusiak, L. S.; Ost, L.; Moraes, F.; Määttä, S.; Nurmi, J.; Möller, L. and Glesner, M. Evaluating the impact of communication latency on applications running over on-chip multiprocessing platforms: a layered approach. In: INDIN, 2010, accepted for publication. Määttä, S.; Indrusiak, L.; Ost, L.; Möller, L.; Glesner, M.; Moraes, F. and Nurmi, J. A Case Study of Hierarchically Heterogeneous Application Modelling Using UML and Ptolemy II In: SoC, 2010, accepted for publication. Ost, L.; Indrusiak, L. S.; Guindani, G.; Määttä, S. and Moraes, F. Accurate Power Estimation for NoC-based MPSoCs using Abstract Models. Submitted to the IEEE Design & Test of Computers
6.3 Future Works
This thesis has explored a wide range of issues related to system level NoC-based MPSoC design. As future works it is possible to enumerate: Platform: NoC can offer different architectures, for instance, by employing virtual channels, adaptive routing, and so on and so far. Thus, the development and the integration of other NoC models can improve the quality of the design space exploration of the proposed approach. In addition, the latency accuracy of PAT can be improved by considering the buffer depth. Another
89
aspect that can be investigated is the possibility of applying PAT into one of SystemC HERMES models already implemented by GAPH’s members. Besides, additional work will also be done on extending the power estimation model so that it considers also the power dissipation due to the switching activity in the router buffers. Mapping: In this thesis, the application mapping was assumed to be static. However, the overhead of mapping lifelines is not considered, since the Mapper actor is not connected to the NoC. The first step to overcome this limitation is connecting the Mapper to the NoC model in order to better investigate the overhead when applications are mapped. Nonetheless, static mapping may be insufficient to handle with the dynamic behavior of more complex applications running in parallel. In this context, the adoption of dynamic mapping heuristics is another mapping aspect to be investigated. Fault detection in high level NoC Models: due to the flexibility and the high debugging capacity inherent to proposed approach, it is possible to model faults in NoC during the simulation (e.g. blocking a given port of a router to represent a faulty port). It can be useful to explore, for instance, how to handle those faults to keep the correct execution of an application when a router stops working.
90
91
REFERENCES [ALI06]
Ali, M.; Welzl, M.; Adnan, A.; Nadeem, F. “Using the NS-2 Network Simulator for Evaluating Network on Chips (NoC)”. In: International Conference on Emerging Technologies (ICET'06), 2006, pp. 506-512.
[ANA10]
Anagnostopoulos, I.; Bartzas, A.; Soudris, D. “Application-Specific Temperature Reduction Systematic Methodology for 2D and 3D Networks-on Chip”. Lecture Notes in Computer Science, vol. 5953, February 2010, pp. 86-95.
[AND05]
Andrews, J. R. “Co-verification of hardware and software for ARM SoC design”. Burlington: Elsevier Inc., 2005, 288p.
[AND08]
Andersson, P.; Höst, M. “UML and SystemC-comparison and mapping rules for automatic code generation”. Lecture Notes in Electrical Engineering, vol. 10, May 2008, pp. 199-209.
[ATI07]
Atitallah, R.; Niar, S.; Meftali, S.; Dekeyser, J. “An MPSoC Performance Estimation Framework Using Transaction Level Modeling”. In: International Conference on Embedded and Real-Time Computing Systems and Applications (RTCSA'07), 2007, pp. 525-533.
[ATI07b]
Atitallah, R.; Niar, S.; Dekeyser, J. “MPSoC power estimation framework at transaction level modeling”. In: International Conference on Microelectronics (ICM'07), 2007, pp. 245-248.
[AUS02]
Austin, T.; Larson, E.; Ernst, D. “Simplescalar: An infrastructure for computer system modeling“. IEEE Computer, vol. 35-2, February 2002, pp. 59-67.
[BAL03]
Balarin, F.; Watanabe, Y.; Hsieh, H.; Lavagno, L.; Passerone, C.; Sangiovanni-Vincentelli, A. “Metropolis: An Integrated Electronic System Design Environment”, IEEE Computer, vol. 36-4, April 2003, pp. 45-52.
[BAN04]
Banerjee, N.; Vellanki, P.; Chatha, K. “A Power and Performance Model for Networkon-Chip Architectures”. In: Design, Automation and Test in Europe (DATE'04), 2004, pp. 1250-1255.
[BEL06]
Beltrame, G.; Lyonnard, D.; Pilkington, C.; Sciuto, D.; Silvano, C. “Exploiting TLM and object introspection for system-level simulation”. In: Design, Automation and Test in Europe (DATE'06), 2006, pp. 100-105.
[BEL07]
Beltrame, G.; Sciuto, D.; Silvano, C. “Multi-Accuracy Power and Performance Transaction-Level Modeling”. IEEE Transactions on Computer-Aided Design of Integrated Circuits and Systems, vol. 26-10, October 2007, pp. 1830-1842.
[BEL08]
Beltrame, G.; Bolchini, C.; Fossati, L.; Miele, A.; Sciuto, D. “ReSP: A non-intrusive Transaction-Level Reflective MPSoC Simulation Platform for design space exploration”. In: Design Automation Conference Asia and South Pacific (ASPDAC'08), 2008, pp. 673678.
[BEL08b]
Beltrame, G.; Fossati, L.; Sciuto, D. “High-Level Modeling and Exploration of Reconfigurable MPSoCs”. In: NASA/ESA Conference on Adaptive Hardware and Systems (AHS'08), 2008, pp. 330-337.
[BEN02]
Benini, L.; De Micheli,G. “Networks on chips: a new SoC paradigm”. IEEE Computer, vol. 35-1, January 2002, pp. 70-78.
92
[BER05]
Bertozzi, D.; Jalabert, A.; Srinivasan, M.; Tamhankar, R.; Stergiou, S.; Benini, L.; De Micheli, G. “NoC Synthesis Flow for Customized Domain Specific Multiprocessor Systems on Chip”. IEEE Transactions on Parallel and Distributed Systems, vol. 16-2, 2005, pp. 113-129.
[BER10]
Beraha, R.; Walter, I.; Cidon, I.; Kolodny, A. “Leveraging Application-Level Requirements in the Design of a NoC for a 4G SoC - a Case Study”. In: Design, Automation and Test in Europe (DATE'10), 2010, pp 1-6.
[BEN06]
Benini, L. “Application specific NoC design”. In: Design, Automation and Test in Europe (DATE'06), 2006, pp. 491 - 495.
[BJE06]
Bjerregaard, T.; Mahadevan, S. “A Survey of Research and Practices of Network-onChip”. ACM Computing Surveys, vol. 38-1, March 2006. pp. 1-51.
[BLA04]
Blanchard B. S. “System engineering management”. Hoboken: John Wiley & Sons, Inc. 3rd ed., 2004, 483 p.
[BRO96]
Brooks R.J.; Tobias A.M. “Choosing the Best Model: Level of Detail, Complexity, and Model Performance”. Mathematical and Computer Modelling, vol. 24-4, August 1996, pp. 1-14.
[CAR09]
Carvalho, E.; Marcon, C.; Calazans, N.; Moraes, F. “Evaluation of Static and Dynamic Task Mapping Algorithms in NoC-Based MPSoCs”. In: International Conference on System-on-Chip (SoC'09), 2009, pp. 87-90.
[CAR09b] Carara, E.; Oliveira, R.; Calazans, N.; Moraes, F. “HeMPS - A Framework for NoC-Based MPSoC Generation”. In: International Symposium on Circuits and Systems (ISCAS'09), 2009, pp. 1345-1348. [CAI04]
Cai, L.; Gerstlauer, A.; Gajski, D. “Retargetable Profiling for Rapid, Early System-Level Design Space Exploration”. In: Design Automation Conference (DAC'04), 2004, pp. 281286.
[CHA04]
Chan, J.; Parameswaran, S. “NoCGEN: A Template Based Reuse Methodology for Networks on Chip Architecture”. In: International Conference on VLSI Design (VLSID'04), 2004, pp. 717-720.
[CHA05]
Chan, J.; Parameswaran, S. “NoCEE : Energy Macro-Model Extraction Methodology for Network on Chip Routers”. In: International Conference on Computer Aided Design (ICCAD'05), 2005, pp. 254-259.
[CHA05b] Chang, K.; Shen, J.; Chen, T. “A Low-Power Crossroad Switch Architecture and Its Core Placement for Network-On-Chip”. In: International Symposium on Low Power Electronics and Design (ISLPED'05), 2005, pp.375-380. [CHA08]
Chan, J.; Parameswaran, Sri. “NoCOUT : NoC Topology Generation with Mixed Packetswitched and Point-to-Point Networks”. In: Design Automation Conference Asia and South Pacific (ASPDAC'08), 2008, pp. 265-270.
[CIO06]
Ciordas, C.; Goossens, K.; Basten, T.; Radulescu, A.; Boon, A. “Transaction Monitoring in Networks on Chip: The On-Chip Run-Time Perspective”. In: Symposium on Industrial Embedded Systems (IES'06), 2006, pp. 1-10.
[CIO08]
Ciordasa, C.; Hanssona, A.; Goossensb, K.; Bastena, T. “Monitoring-aware network-onchip design flow”. Journal of Systems Architecture, vol. 54-3, January-February. 2008, pp.397-410.
93
[COP04]
Coppola, M.; Curaba, S.; Grammatikakis, M.; Maruccia, G.; Papariello, F. “OCCN: A Network on Chip Modeling and Simulation Framework”. In: Design, Automation and Test in Europe (DATE'04), 2004, pp. 174-179.
[CLE00]
Clein, Dan. “CMOS IC layout: concepts, methodologies, and tools”. Boston: Elsevier Inc., 2000, 261p.
[CLE09]
Clermidy, F.; Lemaire, R.; Popon, X.; Kténas, D.; Thonnart, Y. “An Open and Reconfigurable Platform for 4G Telecommunication: Concepts and Application”. In: Digital System Design, Architectures, Methods and Tools (DSD'09), 2009, pp. 449-456.
[DAL01]
Dally, W.; Towles, B. “Route Packets, Not Wires: On-chip Interconnection Networks”. In: Design Automation Conference (DAC'01), 2001, pp. 684-689.
[DEN06]
Densmore, D.; Passerone, R.; Sangiovanni-Vincentelli, A. “A Platform-Based Taxonomy for ESL Design”. IEEE Design and Test of Computers, vol. 23-5, September-October 2006, pp. 359-374.
[DUM06] Dumitrascu, F.; Bacivarov, I.; Pieralisi, L.; Bonaciu, M.; Jerraya, A. “Flexible MPSoC Platform with Fast Interconnect Exploration for Optimal System Performance for a Specific Application”. In: Design, Automation and Test in Europe (DATE'06), 2006, pp. 166-171. [EIS04]
Eisley, N.; Peh, L. “High-Level Power Analysis for on-Chip Networks”. In: International Conference on Compilers, Architecture and Synthesis for Embedded Systems (CASES'04), 2004, pp. 104-115.
[EIS06]
Eisley, N.; Soteriou, V.; Peh, L. “Low power: High-level power analysis for multi-core chips”. In: International Conference on Compilers, architecture and synthesis for embedded systems (CASES'06), 2006, pp. 389-400.
[ELM09]
Elmiligi, H.; Morgana, A.; El-Kharashib, M.; Gebalia, F. “Power optimization for application-specific networks-on-chips: A topology-based approach”. Journal of Microprocessors & Microsystems, vol. 33-5, August 2009, pp. 343-355.
[E3S10]
E3S: “Embedded system synthesis benchmark suite (E3S)”. http://www.princeton.edu/~cad/projects.html, February, 2010.
[FAL06]
Falk, J.; Haubelt, C.; Teich, J. “Efficient representation and simulation of model-based designs in SystemC”. In: Forum on Design Languages (FDL'06), 2006, pp. 129-134.
[GAJ05]
Gajski, D. “System Design Extreme Makeover”. In: International Conference on Formal Methods and Models for Co-Design (MEMOCODE'05), 2005, pp. 71-75.
[GNE02]
Gnesi, S.; Latella, D.; Andmassink, M. “Modular semantics for a UML statechart diagrams kernel and its extension to multicharts and branching time model-checking”. Journal of Logic and Algebraic Programming, vol. 51-1, April-May 2002, pp. 43-75.
[GOD09]
Goderis, A.; Brooks, C.; Altintas, I.; Lee, E. A.; Goble, C. “Heterogeneous composition of models of computation”. Future Generation Computer Systems, vol. 25-5, May 2009, pp. 552-560.
[GRI04]
Gries, B. M. “Methods for Evaluating and Covering the Design Space During Early Design Development”. Integration VLSI Journal, vol. 38-2, December 2004, pp. 131183.
Available
at:
94
[GUI08]
Guindani, G.; Reinbrecht, C.; Raupp, T.; Calazans, N.; Moraes, F. G. “NoC Power Estimation at the RTL Abstraction Level”. In: Computer Society Annual Symposium on VLSI Design (ISVLSI'08), 2008. pp. 475-478.
[GUP97]
Gupta, R.; Zorian, Y. “Introducing core-based system design”. IEEE Design & Test, vol. 14-4, October-December 1997, pp. 15-25.
[HA06]
Ha, S.; Lee, C.; Yi, Y.; Kwon, S.; Joo, Y. “Hardware-software codesign of multimedia embedded systems: the PeaCE approach”. In: Conference on Embedded and Real-Time Computing Systems and Applications (RTCSA'06), 2006, pp. 207-214.
[HA07]
Ha, S.; Kim, S.; Lee, C.; Yi, Y.; Kwon, S.; Joo, Y. “PeaCE: A hardware-software codesign environment for multimedia embedded systems”. ACM Transactions on Design Automation of Electronic Systems, vol. 12-3, 2007, pp. 1-25.
[HA08]
Ha, S. “Model-based Programming Environment of Embedded Software for MPSoC”. In: Asia South Pacific Design Automation Conference (ASP-DAC'08), 2008, pp. 330-335.
[HAN02]
Hang, H.S.; Peh, H.S.; Malik, S. “Orion: A Power-Performance Simulator for Interconnection Network”. In: International Symposium on Micro-architecture (MICRO02), 2002, pp. 294-305.
[HU03]
Hu, J.; Marculescu, R. “Energy-aware mapping for tile-based NoC architectures under performance constraints”. In: Asia South Pacific Design Automation Conference (ASPDAC'03), 2003, pp. 233-239.
[HU05]
Hu, J.; Marculescu, R. “Energy- and Performance-Aware Mapping for Regular NoC Architectures”. IEEE Transaction on Computer-Aided Design of Integrated Circuits and Systems, vol. 24-4, April 2005, pp. 551-562.
[IND07]
Indrusiak, L. S.; Glesner, M. “Specification of Alternative Execution Semantics of UML Sequence Diagrams within Actor-Oriented Models”. In: Symposium on Integrated Circuits and Systems Design (SBCCI'07), 2007, pp. 330-335.
[IND07b]
Indrusiak, L.S.; Thuy, A.; Glesner, M. “Executable System-Level Specification Models Containing UML-Based Behavioral Patterns”. In: Design, Automation and Test in Europe (DATE'07), 2007, pp. 301-306.
[IND08]
Indrusiak, L. S.; Ost, L.; Möller, L.; Moraes, F.; M. Glesner. “Applying UML Interactions and Actor-oriented Simulation to the Design Space Exploration of Network-on-Chip Interconnects”. In: Computer Society Annual Symposium on VLSI Design (ISVLSI'08), 2008, pp. 491-494.
[JAN03]
Jantsch, A. “Modeling Embedded Systems and SoC's: Concurrency and Time in Models of Computation”. San Francisco: Morgan Kaufmann Publishers Inc., 2003, 375p.
[JAN04]
Jang, H; Kang, M.; Lee, M.; Chae, K.; Lee, K.; Shim, K. “High-Level System Modeling and Architecture Exploration with SystemC on a Network SoC: S3C2510 Case Study”. In: Design, Automation and Test in Europe (DATE'04), 2004, pp. 538-543.
[KAH09]
Kahng, A.; Li, B.; Peh, L.; Samadi, K. “ORION 2.0: A Fast and Accurate NoC Power and Area Model for Early-Stage Design Space Exploration”. In: Design, Automation and Test in Europe (DATE'09), 2009, pp. 423-428.
[KAN06]
Kangas, T.; Kukkala, P.; Orsila, H.; Salminen, E.; Hännikäinen, M.; Hämäläinen, T.; Riihimäki, J.; Kuusilinna, K. “UML-based multiprocessor SoC design framework”. ACM Transactions on Embedded Computing Systems, vol. 5-2, May 2006, pp. 281-320.
95
[KEI09]
Keinert, J.; Streubuhr, M.; Schlichter, T.; Falk, J., Gladigau, J.; Haubelt, C.; Teich, J.; Meredith, M. “SystemCoDesigner - an automatic ESL synthesis approach by design space exploration and behavioral synthesis for streaming applications”. ACM Transactions on Design Automation of Electronic Systems, vol. 14-1, January 2009, pp. 1-23.
[KEM05]
Kempf, T.; Doerper, M.; Leupers, R.; Ascheid, G.; Meyr, H.; Kogel, T.; Vanthournout, B. “A Modular Simulation Framework for Spatial and Temporal Task Mapping onto MultiProcessor SoC Platforms”. Design Automation and Test in Europe (DATE'05), 2005, pp 876-881.
[KEM06]
Kempf, T.; Karuri, K.; Wallentowitz, S.; Ascheid, G.; Leupers, R.; Meyr, H. “A SW Performance Estimation Framework for Early System-Level-Design Using Fine-Grained Instrumentation”. In: Design, Automation and Test in Europe (DATE'06), 2006, pp. 468473.
[KIE99]
Kienhuis, B. “Design Space Exploration of Stream-based Dataflow Architectures: Methods and Tools”. PhD thesis, Delft University of Technology, 1999, 266 p.
[KIE02]
Kienhuis, B.; Deprettere, E.; Wolf, P.; Vissers, K. “A Methodology to Design Programmable Embedded Systems - The Y-Chart Approach”. Lecture Notes in Computer Science, v.2268, 2002, pp. 18-37.
[KIM05]
Kim, D.; Ha, S. “Static analysis and automatic code synthesis of flexible FSM model”. In: Asia South Pacific Design Automation Conference (ASP-DAC'05), 2005, pp. 161-165.
[KOG03]
Kogel, T.; Doerper, M.; Wieferink, A.; Leupers, R.; Ascheid, G.; Meyr, H.; Goossens, S. “A Modular Simulation Framework for Architectural Exploration of On-Chip Interconnection Networks”. In: Hardware/Software Codesign and System Synthesis (CODES+ISSS'03), 2003, pp. 7-12.
[KOO08]
Koohi, S.; Mirza-Aghatabar, M.; Hessabi, S. Pedram, M. “High-Level Modeling Approach for Analyzing the Effects of Traffic Models on Power and Throughput in Mesh-Based NoCs”. In: International Conference on VLSI Design (VLSID'08), 2008, pp. 415-420.
[KRE08]
Kreku, J.; Hoppari, M.; Kestil, T.; Qu, Y.; Soininen, J.; Andersson, P.; Tiensyrja, K. “Combining UML2 Application and SystemC Platform Modelling for Performance Evaluation of Real-Time Embedded Systems”. EURASIP Journal on Embedded Systems, vol. 2008-712329, January 2008, pp. 1-18.
[KRE08b]
Krenik, B. “4G wireless technology: When will it happen? What does it offer?” In: IEEE Asian Solid-State Circuits Conference (A-SSCC'08), 2008, pp. 141-144.
[LEE03]
Lee, E. A.; Neuendorffer, S.; Wirthlin,M. J. “Actor-Oriented Design of Embedded Hardware and Software”. Systems, Journal of Circuits, Systems, and Computers, vol. 123, January 2003, pp. 231-260.
[LEE04]
Lee, E. A.; Neuendorffer, S. “Actor-oriented Models for Codesign: Balancing Re-Use and Performance”. Formal Methods and Models for System Design. Kluwer Academic Publishers: Norwell, 2004, pp. 33-56.
[LEE09]
Lee S. E.; Bagherzadeh, N. “A high level power model for Network-on-Chip (NoC) router”. Computers & Electrical Engineering, vol. 35-6, November 2009, pp. 837-845.
[MÄÄ08]
Määttä, S.; Indrusiak, L.S.; Ost, L.; Möller, L.; Nurmi, J.; Glesner, M.; Moraes, F. “Validation of Executable Application Models Mapped onto Network-on-Chip
96
Platforms”. In: IEEE Symposium on Industrial Embedded Systems (SIES'08), 2008, pp. 118-125. [MÄÄ09]
Määttä, S.; Indrusiak, L.S.; Ost, L.; Möller, L.; Glesner, M.; Moraes, F.; Nurmi, J. “Characterising Embedded Applications using a UML Profile”. In: International Conference on System-on-Chip (SoC'09), 2009, pp. 172-175.
[MÄÄ10]
Määttä, S.; Möller, L.; Indrusiak, L.; Ost, L.; Glesner, M.; Nurmi, J.; Moraes, F. “Joint Validation of Application Models and Multi-Abstraction Network-on-Chip Platforms”. International Journal of Embedded and Real-Time Communication Systems (IJERTCS), vol. 1-1, January-March 2010, pp. 86-101.
[MAR05]
Marcon, C. A. M.; Calazans, N.; Moraes, F.; Hessel, F.; Reis, I. ; Susin, A. “Exploring NoC Mapping Strategies: An Energy and Timing Aware Technique”. In: Design Automation and Test on Europe (DATE'05), 2005, pp. 502-507.
[MAR05b] Marcon, C. A. M. “Modelos para o Mapeamento de Aplicações em Infra-estruturas de Comunicação Intrachip”. Tese de Doutorado, PPGC - UFRGS, 2005. 192 p. (in Portuguese). [MAR06]
Martin, G. “Overview of the MPSoC Design Challenge”. In: Design Automation and Conference (DAC'06), 2006, pp. 274-279.
[MAR08]
Marcon, C.; Moreno, E.I.; Calazans, N.L.V.; Moraes, F.G. “Comparison of network-onchip mapping algorithms targeting low energy consumption”. IET Computers and Digital Techniques, vol. 2-6, April 2008, pp. 471–482.
[MAR09]
Marculescu, R.; Bogdan, P. “The Chip Is the Network: Toward a Science of Network-onChip Design”. Foundations and Trends® in Electronic Design Automation, vol. 2-4, March 2009, pp 371-461.
[MAT08]
Matsutani, H; Koibuchi, M; Wang, D. “Run-Time Power Gating of On-Chip Routers Using Look-Ahead Routing”. In: Asia South Pacific Design Automation Conference (ASPDAC'08), 2008. pp. 55-60.
[MAT08b] Mathworks, Simulink Data Sheet. Available http://www.mathworks.com/mason/tag/proxy.html?dataid=9798&fileid=43815, January, 2008.
at:
[MEL06]
Meloni, P.; Murali, S.; Carta, S.; Camplani, M.; Raffo, L. De Micheli, G. “Routing Aware Switch Hardware Customization for Networks on Chips”. In: Nano-Networks and Workshops (NanoNet'06), 2006, pp. 1-5.
[MIL09]
Milojevic, D.; Montperrus, L.; Verkest, D. “Power Dissipation of the Network-on-Chip in Multi-Processor System-on-Chip Dedicated for Video Coding Applications”. Journal of Signal Processing Systems, vol. 57-2, November 2009, pp. 139-153.
[MOH02] Mohanty, S.; Prasanna, V. K.; Neema, S.; Davis, J. “Rapid design space exploration of heterogeneous embedded systems using symbolic search and multi-granular simulation”. In: Language, Compiler and Tool Support for Embedded Systems (LCTES'02), 2002, pp. 18-27. [MON07] Monmasson, E.; Cirstea, M. N. “FPGA Design Methodology for Industrial Control Systems - A Review”. IEEE Transactions on Industrial Electronics, vol. 54-4, August 2007, pp. 1824-1842.
97
[MOL09]
Moller, L.; Indrusiak, L.S.; Glesner, M. “NoCScope: A graphical interface to improve Networks-on-Chip monitoring and design space exploration”. In: International Design and Test Workshop (IDT'09), 2009, pp. 1-6.
[MOR04]
Moraes, F.; Calazans, N.; Mello, A.; Möller, L.; Ost, L. “HERMES: an Infrastructure for Low Area Overhead Packet-switching Networks on Chip”. Integration the VLSI Journal, vol. 38-1, October 2004, pp. 69-93.
[MUR04]
Murali, G. De Micheli. “SUNMAP: A Tool for Automatic Topology Selection and Generation for NoCs”. In: Design Automation and Conference (DAC'04), 2004, pp. 914919.
[NIC09]
Nicolescu, G.; Mosterman, P. J. “Model-Based Design for Embedded Systems”. Boca Raton: Taylor & Francis Group, 2009, 766 p.
[OST05]
Ost, L. C.; Mello, A. V.; Palma, J. C. S.; Calazans, N. L. V.; Moraes, F. G. “MAIA - A Framework for Networks on Chip Generation and Verification. In: Asia South Pacific Design Automation Conference (ASP-DAC'05), 2005, pp. 18-20.
[OST08]
Ost, L; Möller, L.; Indrusiak, L.; Moraes, F.; Määttä, S.; Nurmi, J.; Glesner, M. “A Simplified Executable Model to Evaluate Latency and Throughput of Networks-onChip”. In: Symposium on Integrated Circuits and Systems Design (SBCCI'08), 2008, pp. 170-175.
[OST09]
Ost, L.; Indrusiak, L. S.; Guindani, G.; Reinbrecht. C.; Raupp, T.; Moraes, F. “A high abstraction, high accuracy power estimation model for networks-on-chip”. In: Symposium on Integrated Circuits and Systems Design (SBCCI'09), 2009, pp. 193-198.
[PAL07]
Palma J.; Indrusiak, L.; Moraes, F.; Ortiz, A.; Glesner, M.; Reis, R. “Inserting Data Encoding Techniques into NoC-Based Systems”. In: IEEE Computer Society Annual Symposium on VLSI (ISVLSI'07), 2007, pp. 299-304.
[PAN05]
Pande, P.; Grecu, C.; Jones, M.; Ivanov, A.; Saleh, R. “Performance Evaluation and Design Trade-Offs for Network-on-Chip Interconnect Architectures”. IEEE Computer, vol. 54-8, August 2005, pp. 1025-1040.
[PAR02]
Park, C.; Chung, J.; Ha, S. “Extended synchronous dataflow for efficient DSP system prototyping”. Design Automation for Embedded Systems, vol. 6-3, March 2002, pp 295-322.
[PAT04]
Patel, H. D.; and Shukla, S. K. “SystemC Kernel Extensions for Heterogeneous System Modeling”. Dordrecht: Kluwer Academic Publishers, 2004, 172 p.
[PAT07]
Patel, H. D.; Shukla, S. K; Bergamaschi, R. A. “Heterogeneous Behavioral Hierarchy Extensions for SystemC”. IEEE Transactions on Computer-Aided Design of Integrated Circuits and Systems, vol. 26-4, April 2007, pp. 765-780.
[PAU05]
Paul, J. M.; Thomas, D. E.; Cassidy, A. S. “High-level modeling and simulation of singlechip programmable heterogeneous multiprocessors”. ACM Transactions on Design Automation of Electronic Systems, vol. 10-3, July 2005, pp. 431- 461.
[PEN06]
Penolazzi,S.; Jantsch, A. “A High Level Power Model for the Nostrum NoC”. In: Conference on Digital System Design (DSD'06), 2006, pp. 673-676.
[PES04]
Pestana, S.; Rijpkema, E.; Radulescu, A.; Goossens, K.; Gangwal, O. “Cost-Performance Trade-Offs in Networks on Chip: A Simulation-Based Approach”. In: Design, Automation and Test in Europe Conference (DATE'04), 2004, pp. 764-769.
98
[PIM01]
Pimentel, A.D.; Hertzberger, L.O.; Lieverse, P.; Wolf, P.; Deprettere, E.F. “Exploring Embedded-Systems Architectures with Artemis”. IEEE Transactions on Computer, vol. 34-11, November 2001, pp. 57-63.
[PIM06]
Pimentel, A.D.; Erbas, C.; Polstra, S. “A systematic approach to exploring embedded system architectures at multiple abstraction levels”. IEEE Transactions on Computer, vol. 55-2, February 2006, pp. 99-112.
[PIM08]
Pimentel, A. D.; Thompson, M.; Polstra, S.; Erbas, C. “Calibration of abstract performance models for system-level design space exploration”. Journal of Signal Processing Systems, vol. 50-2, February 2008, pp. 99-114.
[RUG06]
Ruggiero, M.; Guerri, A.; Bertozzi, D.; Poletti, F.; Milano, M. “Communication-aware allocation and scheduling framework for stream-oriented multi-processor systems-onchip”. In: Design, Automation and Test in Europe (DATE'06), 2006, pp. 3-8.
[SUN02]
Sun, Y., Kumar, S.; Jantsch, A. “Simulation and Evaluation for a network on chip architecture using NS-2”. In: NORCHIP conference, 2002, pp. 1-6.
[TED05]
Tedesco, L.; Mello, A.; Garibotti, D.; Calazans, N.; Moraes, F. “Traffic Generation and Performance Evaluation for Mesh-based NoCs”. In: Symposium on Integrated Circuits and Systems Design (SBCCI'05), 2005, pp. 184-189.
[TED08]
Tedesco, L. P.; Calazans, N. L. V.; Moraes, F. G. “Buffer Sizing for Multimedia Flows in Packet-Switching NoCs”. Journal of Integrated Circuits and Systems, vol. 3-1, March 2008, p.46-56.
[VAC02]
Vachharajani, M.; Vachharajani, N.; Penry, D. A.; Blome, J. A.; August, I. D. “Microarchitectural exploration with Liberty”. In: International Symposium on Microarchitecture (MICRO'02), 2002, pp. 271-282.
[VER05]
Veredas, F.J.; Scheppler, M.; Moffat, W.; Mei, B. “Custom implementation of the coarse-grained reconfigurable ADRES architecture for multimedia purposes”. In: Field Programmable Logic and Applications (FPL'05), 2005, pp. 106-111.
[VER09]
Vermeulen, B.; Goossens, K. “A Network-on-Chip Monitoring Infrastructure for Communication-centric Debug of Embedded Multi-Processor SoCs”. In: International Symposium on VLSI Design, Automation and Test (VLSI-DAT'09), 2009, pp. 183-186.
[WOL04]
Wolf, W. “The Future of Multiprocessor Systems-on-Chips”. In: Design Automation and Test in Europe (DATE'04), 2004, pp. 681-685.
[WOL05]
Wolkottex P.; Smit, G. J.M.; Kavaldjiev, N.; Becker, J. E.; Becker, Jurgen. “Energy model of networks-on-chip and a bus, system-on-chip”. In: International Symposium on System-on-Chip (SoC'05), 2005, pp. 82-85.
[WOL05b] Wolkotte, P. T.; Smit, G. J.; Becker, J. E. “Energy-efficient NoC for best-effort communication”. In: Field Programmable Logic and Applications (FPL'05), 2005, pp. 197-202. [XI06]
Xi, J.; Zhong, P. “A Transaction-Level NoC Simulation Platform with Architecture-Level Dynamic and Leakage Energy Models”. In: Great Lakes Symposium on VLSI (GLSVLSI'06), 2006, pp. 341-344.
[XU04]
Xu, J.; Wolf, W.; Henkel, J., Chakradhar, S.; Lv, T. “A Case Study in Networks-on-Chip Design for Embedded Video”. In: Design Automation and Test in Europe (DATE'04), 2004, pp. 770-775.
99
[XU05]
Xu, J.; Wolf, W.; Henkel, J.; Chakradhar, S. “A Methodology for Design, Modeling, and Analysis of Network on Chip”. In: International Symposium on Circuits and Systems (ISCAS'05), 2005, pp. 1778-1781.
[YE02]
Ye, T.; Benini, L. and De Micheli, G. “Analysis of Power Consumption on Switch Fabrics in Network Routers”. In: Design Automation and Conference (DAC'02), 2002, pp. 524– 529.
[YE03]
Ye, T.; Benini, L.; De Micheli, G. “Packetized On-Chip Interconnection Communication Analysis for MPSoC. In: Design Automation and Test in Europe (DATE'03), 2003, pp. 344-349.
[ZEN10]
Zeng, K.; Guo, Y.; Angelov, C.K. “Graphical Model Debugger Framework for Embedded Systems”. In: Design, Automation and Test in Europe (DATE'10), 2010, pp. 87-92.