{lilian.bossuet, guy.gogniat, jean-luc.philippe}@univ-ubs.fr. Abstract. We propose in this paper an original design space exploration method for reconfigurable ...
1
Generic Design Space Exploration for Reconfigurable Architectures Lilian Bossuet, Guy Gogniat, Jean-Luc Philippe, LESTER Lab Université de Bretagne Sud, Lorient, France {lilian.bossuet, guy.gogniat, jean-luc.philippe}@univ-ubs.fr Abstract We propose in this paper an original design space exploration method for reconfigurable architectures adapted to fine and coarse grain resources. The exploration flow deals with communication hierarchical distribution and processing resources use rate for the architecture under exploration. With this information, designer can explore the architectural design space to define a power-efficient architecture. Exploration results for image computing and cryptography applications are provided to demonstrate the efficiency of the method.
1. Introduction Today new applications like software radio or security systems require more and more flexibility. Execution platforms must provide this flexibility and meet with application performances (speed, power consumption, throughput...). Reconfigurable computing is an efficient solution to this problem as it offers flexible and powerful solutions [1]. However, reconfigurable design space is increasing rapidly thus it becomes mandatory to provide designer new tools to fill the gap between application and reconfigurable architecture. This paper targets this issue and is organized as follows. Section 2 presents our work contribution and related work. Section 3 presents the design space exploration method. Section 4 provides exploration results for image computing and cryptography applications; this section also details the exploration steps to illustrate the whole approach. Finally, section 5 concludes the paper.
2. Contribution and related work Actually, several approaches have been proposed to perform design space exploration for reconfigurable architectures. Characterization metrics can be used to compare physical architectures [2]. Nevertheless, with such approach, application characteristics are not taken into account despite their strong impact on final performances. Estimation tool using precharacterization of the architecture corresponds to another solution. If so, designer can only explore a small design space according to pre-characterization library size. With such approach, algorithmic [3] or logical architecture exploration [4]
can be performed. However, these methods are too technological-dependent and, deal with low level of abstraction (furthermore only FPGAs are targeted to be able to perform pre-characterization). To increase design space while considering FPGAs, designer can use generic place and route tools like [5]. Nevertheless, these tools are not adapted for high level exploration since they are technological and target dependent. For coarse grain architectures, only a small number of design space exploration tools for specific architectures like [6] have been developed. However, these tools are too specific as only a small design space around the target architecture can be explored. Clearly, all existing methods are too specialized, too technological-dependent or too architecture-dependent. Exploration of large design space dealing with fine grain, coarse grain or heterogeneous architectures is not supported. In this paper, we propose a design space exploration method based on communications distribution within the reconfigurable architecture which leads to define powerefficient architecture under a time constraint and, in synergy with application or application domain. This work permits to consider fine grain, coarse grain and heterogeneous architecture for a same application. Thus, designer can explore a large domain in the reconfigurable design space. An important characteristic of the exploration method is to consider a high level of abstraction for both application and architecture in order to be performed during the first steps of the design flow. In spite of relative estimation accuracy, it is possible to compare numerous architectures quickly.
3. Design Space Exploration Method In order to develop design space exploration method it is necessary to emphasize some criteria to efficiently compare physical architectures for a same application. The first criterion we consider is time constraint since the inputs of the exploration flow are a specific RTL architecture and a number of cycles to run the application onto it. Power consumption corresponds to the second criterion since for embedded applications it corresponds to a major metric. According to numerous studies [7-8], it appears that given an application and a time constraint, physical reconfigurable architectures that
2
emphasize clustering of application resources lead to better solutions in term of power consumption. To deal with these two criteria, application and architecture specifications must respectively emphasize communications between the resources required by the application and spatial locality of resources within the architecture (from the routing point of view). In our case the application specification is the C language which is translated into a dedicated graph called Average Communication Graph (ACG) [9]. This graph exhibits how each type of processing and memory resources communicate within the application for a specific RTL architecture. The reconfigurable architecture model uses a hierarchical view of the architecture in order to highlight resources spatial locality; it is based on two types of element [9]: 1) hierarchical elements are used to model the architecture hierarchy. They are containers; they contain other hierarchical elements or functional elements and, 2) functional elements describe the computing and memory resources. They are described by the list of functions they can realize. The exploration flow considers two important hypotheses concerning the communication costs within the hierarchical elements to take into account routing cost without explicitly dealing with an accurate physical description of the routing resources within the architecture model. These hypotheses are: 1) communication cost inside a hierarchical element is homogeneous and, 2) communications are less power consuming in the lowest levels than in the highest levels of the hierarchy. Hence the exploration flow aims to promote communications within the lowest levels of the architecture hierarchy in order to provide power-efficient solution while meeting with time constraint.
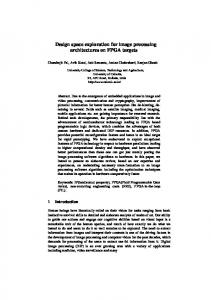
The exploration flow starts with the ACG study as shown in figure 1. This study provides information related to the number and type of communications within the application. Designer uses this information to build the architecture lowest level hierarchical elements. The main issue during that step is to define the granularity and the type of resources of the different functional elements within the lowest hierarchical elements. To define the right parameters designer models the resources and runs the performance estimation tool within the exploration flow [9]. This step is repeated until an efficient solution is build (an efficient solution corresponds to a high rate of communications inside the lowest level hierarchical elements). Then designer refines his architecture model to define the size of each lowest hierarchical element in order to promote spatial locality of communications. The size is defined by the number of resources embedded inside the hierarchical element. As previously, once the architecture is defined the designer runs the performance estimation tool to compute the communications ratio within the lowest hierarchical elements. These two steps leads to the definition of the memory size and the type/number of each functional element embedded in the lowest hierarchical elements. To fully explore the architecture, hierarchy within the architecture has to be defined. The goal is to define how many levels of hierarchy are considered and how many elements are embedded in each hierarchical level (current version of the tool is limited to three levels). To perform this exploration step, designer refines his architecture model by defining the hierarchy within the architecture and runs the performance estimation tool. The results provided by the performance estimation tool are the communication rates within each hierarchical element and the use rates of the
C code of the application ACG study Algorithmic Exploration
Design Space Exploration Flow
Architecture model
Design Trotter framework
� RTL architecture � Time constraint
Exploration of the granularity and type of resources within the lowest level hierarchical elements
Promote high rate of communications inside the lowest level hierarchical elements
Exploration of the size of each lowest level hierarchical elements
Promote spatial locality of communications within the lowest level hierarchical elements
Exploration of the architecture hierarchy. Definition of middle level and highest level hierarchical elements
Definition of hierarchical elements that respect homogeneous communication costs within each hierarchical level
Parser
Average Communication Graph (1) 14 (2)
+
8
–
×
(2)
20
Figure 1: Design space exploration flow. Inputs of the flow are the Average Communication Graph and the Architecture Model. The exploration flow leads to the definition of a power-efficient reconfigurable architecture
�Communication rates within each hierarchical element � Use rates of the processing resources within the architecture
Architecture refinement from lowest to highest hierarchical levels
3
elements (also called clusters) and particularly to define whether it is required to mix fine grain and coarse grain resources. Results provided in table II highlight that it is interesting to separate fine grain and coarse grain clusters for the three first applications since communications between both grains represent less than 1% of the total amount of communications. However, for the AES core nearly 16% of the communications correspond to data exchange between coarse grain and fine grain resources and there is no inter-grain communications, thus for the AES core it is interesting to mix both grains. According to these results we define four clusters that will be used to build the final architectures which are: 1) Cluster 1 (coarse grain cluster) has two coarse grain resources, adder/subtracter and multiplier, and one memory resource, 2) Cluster 2 (fine grain cluster) has two fine grain resources, comparator and look-up table, and one memory resource, 3) Cluster 3 (memory cluster) only has one large memory resource and, 4) Cluster 4 (heterogeneous cluster) has four processing resources, adder/subtracter, multiplier, comparator and look-up table, and one memory resource. Table III gives the number and the type of resources embedded within each cluster and for each application. According to ACG study, cluster 4 is only used for the cryptographic application. Image computing applications use the three other clusters. Table III and table IV must be considered concurrently to understand the whole architecture particularly the hierarchical levels. Table IV gives the number of clusters within the whole
processing resources within the architecture. Based on these results, the designer can compare different architectures and select the best one in term of power-efficiency. Once an architecture has been defined, the designer can go through classical design flow to build his architecture.
4. Applications Four applications are considered to illustrate the exploration flow and to demonstrate its ability to guide designer toward the definition of power-efficient reconfigurable architecture. ICAM (motion estimation), Matching Pursuit decoder (image compression), MPEG-2 encoder (video compression) and AES core (encryption) are considered. Table I gives the inputs of the exploration flow for each application. Results provided in Table I are obtained using Design Trotter framework [10] and correspond to the characteristics of each selected RTL architecture. Table I gathers the number of communications within the application, the number of cycles to run the application and the numbers and types of processing/memory resources. Table II gives the results of the ACG study for the four applications. This study provides the percentage of communications in the RTL architecture between: 1) Coarse grain resources (inter coarse grain), 2) Coarse grain and fine grain resources (coarse/fine grain), 3) Coarse grain and memory resources (coarse grain/memory), 4) Fine grain resources (fine grain), 5) Fine grain and memory resources (fine grain/memory) and, 6) memory resources (memory). These results enable to define the lowest level hierarchical
TABLE I – INPUTS OF THE DESIGN SPACE EXPLORATION FLOW Application ICAM MPEG-2 encoder Matching Pursuit decoder AES core
Comm 29.086.8 40.745.3 3.751.4 1120
Cycles 373.872.3 45.476.0 239.2 471
Add/Sub 512 398 232 11
Mul/Div 125 279 162 16
Comp 516 153 69 16
Logic 328 33 0 15
Memory 3,1Mbytes 60Kbytes 6,3Mbytes 1Kbytes
TABLE II - ACG COMMUNICATIONS CHARACTERIZATION Application ICAM MPEG-2 encoder Matching Pursuit decoder AES core
Coarse grain 2,9% 66,9% 92,3% -
Coarse/fin grain 0,2% 0,7% 0,1% 15,7%
Communications repartition between Coarse grain/memory Fine grain 15,0% 19,9% 31,1% 1,1% 7.6% 28,9% -
Fine grain/memory 36,9% 0,2% 25,0%
memory 25,1% 30,4%
TABLE III – PROCESSING FUNCTIONAL ELEMENTS EMBEDDED IN THE LOWEST HIERARCHICAL LEVEL ELEMENT Application ICAM MPEG-2 encoder Matching Pursuit decoder AES core
ADD/SUD luster 1 20 4 8 -
MUL cluster 1 10 4 6 -
COMP cluster 2 21 2 3 -
LUT cluster 2 13 1 0 -
ADD/SUD cluster 4 1
MUL cluster 4 1
COMP cluster 4 1
LUT cluster 4 1
TABLE IV – NUMBER OF LOWEST HIERARCHICAL LEVEL CLUSTER Number of clusters in the whole architecture
Application ICAM MPEG-2 encoder Matching Pursuit decoder AES core
Number of clusters within each middle level hierarchical element
cluster 1
cluster 2
cluster 3
cluster 4
cluster 1
cluster 2
cluster 3
cluster 4
26 105 30 0
26 105 25 0
26 0 5 0
0 0 0 16
2 7 6 0
2 7 5 0
2 0 1 0
0 0 0 4
Number of middle level hierarchical elements within the highest level hierarchical element 13 15 5 4
TABLE V – USE RATE ESTIMATION OF EACH PROCESSING FUNCTIONAL ELEMENT TYPE Use rate
Application ICAM MPEG-2 encoder Matching Pursuit decoder AES core AES core architecture TI
ADD/SUB 98,5 % 67,0 % 97,0 % 63,8 % -
MUL 48,0 % 70,0 % 90,0 % 100 % -
COMP 94,5 % 13,0 % 92,0 % 100 % -
LUT 97,0 % 2,0 % 93,8 % -
Communication hierarchical distribution High level Middle level Low level 13 % 30 % 57 % 29 % 8% 63 % 31 % 32 % 37 % 21 % 10 % 69 % 36 % 14 % 50 %
4
architecture and details the repartition between the three hierarchical levels. As ICAM and MPEG-2 applications are the most complex ones they require more and larger clusters than the two other applications. AES application is less complex, so the cluster used for this application is smaller. During the exploration flow, once the types and numbers of clusters are defined, the exploration of the hierarchical middle and highest levels is performed. The middle-level embeds hierarchical elements like cluster 1, cluster 2, cluster 3 and cluster 4 depending on the application characteristics. The number of clusters within the middle level for each application is given in table IV which provides also the number of middle level hierarchical elements embedded in the highest level hierarchical element. Table V gives the use rate estimation of each type of processing resources for each application. An efficient architecture leads to the highest use rate for each resource since unused resources reduce the power efficiency, particularly for coarse grain processing resources. Furthermore an efficient architecture leads to the highest communication rate within the lowest level hierarchical elements. However, during the exploration flow there is often a tradeoff between use rate and communication distribution. For example, we have defined a high use rate for Matching Pursuit (table V) and a low use rate for MPEG-2 decoder (table V). However, the number of communications estimated in the lowest levels is higher for MPEG-2 decoder than for Matching Pursuit. Moreover, the number of communications estimated in the highest level is lower for MPEG-2 decoder than for Matching Pursuit. So, the communication hierarchical distribution is better for the MPEG-2 decoder than for the Matching Pursuit, but this is not the case for the use rate. Hence, there is generally a tradeoff between use rate and communication distribution, the solution depends on the underlying technological process. The AES application uses another type of architecture compared to the previous ones since it has only one type of lowest level clusters containing fine grain and coarse processing functional element (heterogeneous cluster). Exploration result for the communication distribution is very good since 69% of the communications are inside the architectural lowest levels and only 21 % inside the highest level. The last row in table V considers the architecture defined for image processing applications to perform AES core; as we can notice it results in a degradation of the performances. Therefore as expected the exploration flow leads to the definition of power-efficient architecture depending on the application; it promotes the synergy between application and architecture and decreases the gap between both to reduce the design cycle.
5. Conclusion We propose an original exploration flow based on a high level
representation for both application and architecture which deals with fine grain, coarse grain and heterogeneous architectures. Two metrics have been defined to promote the definition of power-efficient architecture; the architectural processing use rate and the communication hierarchical distribution. First results highlight that power-efficiency requires application domain specific reconfigurable architectures.
References [1] N. Tredennick, B. Shimamoto. The Rise of Reconfigurable Systems. In proceeding of Engineering of Reconfigurable Systems and Application, ERSA’2003. June 23-26, 2003, Las Vegas, Nevada, USA. [2] P. Benoit, G. Sassatelli, L. Torres, D. Demigny, M. Robert, G. Cambon. Metrics for Reconfiguration Architectures Characterization: Remanence and Scalability. RAW03, Nice, France, April 2003. [3] R. Enzler, T. Jeger, D. Cottet, G. Tröster. High-Level Area and Performance Estimation of Hardware Building Blocks on FPGAs. In Field-Programmable Logic and Applications Forum on Design Language, Villach, Austria, August 28 - 30, 2000. [4] S. Bilavarn, G. Gogniat, J.L. Philippe, L. Bossuet. Fast Prototyping of Reconfigurable Architectures From a C Program. In IEEE International Symposium on Circuits and Systems, ISCAS’03, Bangkok, Thailand, 25-28 May, 2003. [5] V. Betz, J. Rose. VPR: A New Packing, Placement and Routing Tool for FPGA Research. In International Workshop on Field Programmable Logic and Application, FPL 97, 1997. [6] C. A. Moritz, D. Yeung, A. Agarwal. Exploring Optimal Cost-Performance Designs for Raw Microprocessors. Proceedings of the International IEEE Symposium on Field Programmable Custom Computing Machines, FCCM 98, April 1998. [7] A. Garcia, W. Burleson, J-L. Danger. Power Modelling in Field Programmable Gate Arrays (FPGA). In Proceeding of the 9th International Workshop on Field Programmable Logic and Applications, FPL 1999, Glasgow, Scotland, 1999. [8] V. George, H. Zhang, J. Rabaey. The Design of a Low Energy FPGA. In Proc. Int. Symp. On Low Power Electronics and Design, ISLPED 1999, pages 188-193, 1999. [9] L. Bossuet. Exploration de l’espace de conception des architectures reconfigurables. PhD Thesis, Université de Bretagne Sud, September 2004. [10] Y. Le Moullec, P. Koch, J.P. Diguet, J.L. Philippe. Design Trotter : Building and Selecting Architectures for Embedded Multimedia Applications. In IEEE International Symposium on Consumer Electronics, ISCE 03, Sydney, Australia, December 3-5, 2003.