performance of the ADC. This approach works in both production test and BIST environments. Simulation results show two sine waves with < 60 dB purity can be ...
➠
➡ Accurate Testing of ADC’s Spectral Performance Using Imprecise Sinusoidal Excitations Zhongjun Yu, Degang Chen, Randy Geiger Iowa State University Abstract Analog to Digital Converter (ADC) is the world’s largest volume mixed-signal circuit. It is also a key building block in nearly all system on chip (SoC) solutions involving analog and mixed-signal functionalities. ADC testing is also crucial for builtin-self-test (BIST) solutions of AMS testing in SoC technology which is identified by the ITRS as one of four most daunting SoC challenges. ADC spectral testing is of critical importance to a large class of integrated circuits and is particularly challenging for high speed and/or high resolutions circuits. In this paper we use Spectrally Related Excitations (SRE) to accurately test the spectral performance of ADCs. Unlike standard approaches, the SRE approach uses low-cost imprecise sine signals as input to the ADC and uses the spectral relationship between multiple input signals to separate distortion inherent in the ADC from that in the input. Efficient DSP algorithms are used to determine the true spectral performance of the ADC. This approach works in both production test and BIST environments. Simulation results show two sine waves with < 60 dB purity can be used to accurately test spectral performance of high resolution ADCs with SFDR in excess of 100 dB. The low-cost SRE signals can be readily generated with simple RC filters with lax band edge requirements. Extensive simulation shows that the algorithm is robust to filter errors, to nonstationarity in the test environment, and to measurement noise. 1. Introduction As the world’s leading volume mixed-signal circuit, ADC testing represents one of the most challenging AMS testing tasks. Parametric specifications such as DNL and INL measure the ADC’s static performance and are critically important to instrumentation applications, medical applications, image processing, and so on, in which accuracy of each converted code is of major concern. Production test of static linearity of high resolution ADCs is challenging and costly due to long test times per unit and large investments in commercial mixed-signal testers. Furthermore, as the industry integrates increasingly more functionalities into a single chip, analog and mixed-signal components become deeply embedded and testing access becomes increasingly difficult. Built-in-self-test solutions of AMS testing become critical in solving ITRS’s one of the four “most daunting SoC challenges.” [1] As the most fundamental building block, cost effective testing of ADC plays a key role. Many attempts have been made to provide built-in-self-test (BIST) solutions to ADC linearity testing to reduce costs associated with using testers and to enable testing of deeply embedded SoCs. Excellent examples include the work of Roberts, Azais, Sanchez, and many others [e.g. 2-7]. Invariably, their approaches have been aimed at replicating a standard tester on a chip. Unfortunately, these approaches have found little industrial adoption. A fundamental problem with these approaches is their need for a highly accurate signal to stimulate the DUT. Requirements for the stimulus input are typically substantially more precise than those of the DUT making the signal generator more challenging to design than the DUT itself and raising the question of whether a test
0-7803-8251-X/04/$17.00 ©2004 IEEE
circuit is also needed for the signal generator! Recently, the authors’ group developed a new approach for ADC static linearity testing in which two functionally related easy-to-generate signals are used to accurately characterize the ADC. The approach was validated by extensive simulation and experimental results obtained in industry in which 7 bit linear signals were used to test a 16 bit ADC achieving comparable results to those obtained by a state-ofthe-art mixed-signal tester with 20 bit linear ramp signals. [8, 9] In many applications, spectral measures such as SFDR, SINAD, THD, IMD, SNR, etc. that characterize the dynamic performance of the ADC are of critical importance. Both the static errors and dynamic errors degrade spectral performance. Dynamic errors refer to the additional sources of error introduced by the time variation of the analog signal being sampled. Sources include harmonic distortion from the analog input stages, signal-dependent variations in the time of samples, dynamic effects in amplifiers and comparators, and frequency-dependent variations in threshold levels. The discrete Fourier transform (DFT) is used extensively for frequency domain analysis and is the prevalent technique used for spectral performance testing. [10-12] According to the IEEE standard on ADC testing, input sine wave signals must have spectral purity far exceeding the targeted performance of the ADC under test. This is because practical sine waves contain harmonic distortion components that corrupt the ADC output. To ensure testing accuracy, standard approaches require input sine signals to be at least 10 times or 3 bits more accurate than the ADC under test. For example, if ADCs with targeted 16-bit SFDR performance are to be tested, the input sine wave signal should have its largest harmonic distortion component at the –118 dB level or lower. Such high purity sine waves are very challenging to obtain and are virtually impossible in a built-in-self-test environment. In this paper, we introduce a new spectral testing technology that uses two low-cost Spectrally Related Excitations (SRE) to accurately determine the spectral performance of ADCs. Section 2 describes the SRE approach and shows how two imprecise sine inputs with spectral relationship can be used to separate the distortion inherent in the ADC from that in the input and determine the true spectral performance of the ADC. Section 3 provides simulation results showing that two < 60-dB-pure sine waves can be used to accurately test spectral performance of high resolution ADCs with SFDR in excess of 100 dB. Extensive simulation also shows that the SRE approach is robust to filter errors, to nonstationarity in the test environment, and to measurement noise. 2. Accurate spectral testing with imprecise sine inputs An ADC is a device that converts a continuous time signal x(t) into a discrete-time quantized-amplitude signal y(t). In the ideal case, y(t) will only differ from x(t) by a quantization error Q(t) which is bounded by FS/2n where FS is the full scale range of the ADC input and 2n is the total number of quantization levels of an nbit ADC. However, due to unavoidable errors in the manufacturing of the device, an actual ADC will have y(t) deviate from its desired values, causing the ADC’s behavior to be nonlinear. In the frequency domain, the ADC linearity is measured with
I - 645
ISCAS 2004
➡
➡ several spectral specifications. Let the ADC input x(t) be a pure sine wave. The ADC output y(t) ideally should be a pure sine wave. However, static and dynamic non-idealities of the ADC will cause y(t) to differ from a pure sine wave. The spectral contents of y(t), denoted as Y(f), should be ideally a spectral line at the input signal frequency, but nonlinearities of the ADC will cause spectral lines to appear at harmonics frequencies in the output spectrum. The spectral values at these harmonic frequencies measure the amount of nonlinearity in the ADC and are called harmonic distortion. Total harmonic distortion (THD) measures the total power of all the harmonic distortion components divided by the intended signal (or the first harmonic) power. Spectral lines persistent at frequencies other than the harmonic frequencies are spurious distortion components. The spurious-free dynamic range (SFDR) of an ADC measures the ratio of the output signal amplitude to the amplitude of the largest harmonic or spurious spectral component observed over the full Nyquist band. Both THD and SFDR are typically expressed in decibels (dB). As defined above, x(t) = sin(Zt) is periodic, the steady state output y(t) is also periodic and admits a Fourier series representation. Suppose the input sine wave and the ADC’s clock have been synchronized and the ADC’s gain error has been corrected, then the output y(t) can be expressed as: y (t ) sin Zt � a 2 sin 2Zt � b2 cos 2Zt (1) � a3 sin 3Zt � b3 cos 3Zt � � where the ai and bi are the Fourier coefficients of y(t) and they are assumed to be much less than 1 in magnitude. The THD and SFDR of an ADC can be calculated by ai, bi as: THD 10 log10 (¦ ai2 � bi2 ) it2
SFDR
�20 log 10 (max a i2 � bi2 )
(2)
it2
Straightforward trigonometric manipulation will lead us to: y (t )
sin Zt � a 2 sin 2Zt � b2 cos 2Zt � a3 sin 3Zt � b3 cos 3Zt � � sin Zt � 2a 2 sin Zt cos Zt � b2 (2 cos 2 Zt � 1)
The ADC’s output response will have distortions that are the combined effect of the input distortion and the ADC’s harmonic distortion. Nevertheless, y1(t) is also going to be a periodic signal. Substituting x by x1(t) in Equation (4) and neglecting all terms with higher order products of ai, bi , Di, and Ei, it can be shown after lengthy trigonometric algebra that y1(t) has the following Fourier Series representation: y1 (t ) sin Zt � (a 2 � D 2 ) sin 2Zt � (b2 � E 2 ) cos 2Zt (6) � ( a3 � D 3 ) sin 3Zt � (b3 � E 3 ) cos 3Zt � � � (ai � D i ) sin iZt � (bi � E i ) cos iZt � �
which is surprisingly simple but very intuitive. Here again, we have, without loss of generality, assumed that the ADC’s gain error and offset error have been corrected. Otherwise, a simple scaling and DC shift will be needed. The DC component will not affect the computation of the spectral lines at nonzero frequencies. The scaling factor due to gain error will not affect the computation of the spectral specifications since these specifications are computed with a normalized first harmonic. If a coherent data record of the output y1(t) is obtained, it can be transformed into the spectral domain via FFT to get Y1(f). Let (7) h y1 i Y1 ( f ) |i �th harmonic where hy1i is the spectral line at the i-th harmonic of y1(t). From Equations (6) and (7) and relationship between Fourier Series and Fourier Transform, we can be obtain: (8) bi � E i � j (ai � D i ) 2h y1i for all i From Equation (8), we can get the relationships between harmonic distortion components of the input imprecise sine wave x1(t), those of the ADC’s steady state output response y1(t), and the ADC’s harmonic distortion as defined with a pure sine wave stimulus, namely: (9) h y1 i h x1 i � h ADC i for all i Therefore, if the input harmonics can be identified, the following equation can be used to identify the ADC’s harmonic distortion. (10) h ADB i h y1 i � h x1 i for all i
(3)
� a3 sin Zt (3 � 4 sin 2 Zt ) � b3 (1 � 4 sin 2 Zt ) cos Zt � � sin Zt � 2a 2 sin Zt cos Zt � b2 (1 � 2 sin 2 Zt ) � a3 sin Zt (3 � 4 sin 2 Zt ) � b3 (1 � 4 sin 2 Zt ) 1 � sin 2 Zt � �
To avoid unnecessary algebraic complication, higher order terms are not carried in the equations. Since sin(Zt) = x(t) in Equation (3), y(t) can be expressed as a function of x(t ) as follows: (4) y (t ) x � 2a 2 x 1 � x 2 �b 2 (1 � 2 x 2 ) � 3a3 x � 4a3 x 3 � b3 1 � x 2 � 4 x 2 b3 1 � x 2 � �
This equation forms the bases for us to develop the mentioned key relationships among the distortion components of the ADC and its input/output signals in the SRE approach. First let us feed an imprecise sinusoidal signal x1(t) to the ADC input and denote the corresponding ADC output steady state response by y1(t). Since x1(t) is imprecise, it is no longer a pure sine wave. Instead it is a periodic signal with higher order harmonic distortions. Suppose we can scale the magnitude and synchronize the phase of the input signal, we can assume, without loss of generality, that x1(t) has the following Fourier Series form: x1 (t ) sin Zt � D 2 sin 2Zt � E 2 cos 2Zt (5) � D 3 sin 3Zt � E 3 cos 3Zt � � where |Di|, |Ei|
-20
@
After combining Equations (9) and (17), the following matrix equations can be obtained for each i, 1 0 1 � 0 �
0 �1 ZZ 0 (i � 1) i 2Z 2 � Z 02 iZ 2 � Z 02 i 2Z 2 � Z 02
1 0 iZ 2 � Z 02
º » » ª ai º » «b » » « i» i 2Z 2 � Z 02 » «D » i » « » ZZ 0 (1 � i ) » ¬ E i ¼ i 2Z 2 � Z 02 »¼
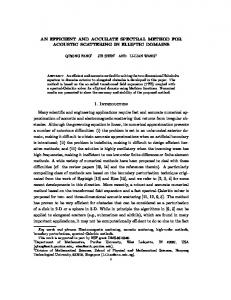
From Equation (18), ai, bi can be calculated using the two sets of data records from y1(t) and y2(t). Once ai, bi are known, we can substitute ai, bi into Equation (2) to calculate SFDR or THD. 3. Simulation Results The SRE approach is applied to spectral performance testing of high-resolution flash ADCs. A flash ADC is chosen because it has more independent error sources and is more challenging to fully characterize than most other structures. Specifically, an imperfect n-bit ADC is generated with random resistor mismatch in the R-string. Using an ideal sinusoid and FFT, the true spectral performance of the ADC is determined through simulation. In the SRE approach, simulated low-purity sine waves are used as the input signals to test the ADC’s spectral performance. To do this, harmonic distortions are randomly added to a pure sine wave to form the first input signal x1(t). The spectrum of the first input signal x1(t) in one particular run is shown in Figure 2. 0
-40 1
P o w e rs p e c tr a ld e n s ityo fx( d B )
-20
-60
-80
-100
-120
-140
0
0.1
0.2
0.3 0.4 0.5 0.6 0.7 Frequency relative to Nyquist frequency
0.8
0.9
-80
-100
-140
(18)
ª 2 Re(h y1 i ) º « 2 Im(h ) » y1 i » « «2 Re(h y 2 i )» « » ¬« 2 Im(h y 2 i ) ¼»
-60
-120
1
Figure 2. Spectrum of imprecise sinusoidal input signal As can be seen, x1(t) has many harmonic distortion components. The second harmonic has power at the –55.1 dB level relative to the full-scale signal power. Hence the purity of x1(t) is only 55.1dB, or about 9-bit. The corresponding steady state ADC output signal y1(t) is recorded and coherent samples are taken for
0
0.1
0.2
0.3 0.4 0.5 0.6 0.7 Frequency relative to Nyquist frequency
0.8
0.9
1
Figure 3. ADC output spectrum with x1(t) as input After we obtained the spectra of both Y1(f) and Y2(f) we can calculate ai, bi, Di, Ei according to Equation (18). Then equation (2) can be used to calculate SFDR and THD. Figure 4 plots both the true ADC spectrum and the estimated ADC spectrum as computed by the SRE method. The true SFDR is 104.0 dB, measured with infinitely accurate sine input; the estimated SFDR calculated by the SRE method is 104.8 dB. It must be emphasized that the accurate SFDR result from SRE was obtained with input signals with only 55.1 dB purity. This compares with the industry standard which will require an input signal whose purity is 124 dB or 21-bit pure. 0
P o w e rsp e ctra ld e n sity(d B )
ª0 «� 1 « « «0 « « «� 1 « ¬
-40 1
· § iZ ( E i � jD i )0.5¨¨ j � 1¸¸ ¹ © Z0
h fi
�1
-20
blue: actual ADC output spectrum with ideal sine input
-40
red: estimated ADC output spectrum with imprecise sine inputs
-60
-80
-100
-120
-140
0
0.1
0.2
0.3 0.4 0.5 0.6 0.7 Frequency relative to Nyquist frequency
0.8
0.9
1
Figure 4. True and SRE estimated ADC spectrum Robustness to filter bandwidth In the above simulations, we assume that the low pass filter’s corner frequency Z0 can be adjusted by choosing appropriate R and/or C values so that Z0 is equal to Z, the base harmonic frequency of the imprecise input sinusoidal signal. However, due to finite tuning ability in R and C, there will be residual mismatches between Z0 and Z. In this case we can rewrite Z0=Z(1+'). However, this knowledge of the filter mismatch was not known to the algorithms. Even though in real life ADC testing, it is very easy to tune the corner frequency of the filter to be as accurate as .1% mismatch of the frequency of the input signal, we performed extensive simulations for mismatches ranging from 0.1% to 10% in this paper. The simulation results are summarized in table 1. The SFDR and THD columns are testing results with infinite pure sine input and SFDR1 and THD1 are testing results from the SRE
I - 647
➡
➠ approach using 9-10 bit pure sine wave inputs. Diff is the SFDR difference.
1
Table 1. Testing results with various filter errors '� Nbit INL SFDR THD SFDR1 THD1 Diff 0.1% 16 1.7 96.4 -91.6 96.7 -91.7 -0.3 16 1.4 100.2 -94.5 100.4 -94.6 -0.1 0.3% 15 1.9 88.8 -86.4 88.8 -86.3 0 16 2.6 93.9 -91.4 94.6 -91.9 -0.7 1% 16 1.2 101.7 -95.5 101 -95.1 0.8 15 1.3 90.9 -87.4 91 -87.5 -0.1 3% 16 1.5 96.2 -92 96.6 -92 -0.3 15 1.6 91 -85.7 91.1 -85.9 -0.2 10% 16 1.3 98.9 -94 99.1 -93.9 -0.2 16 1.6 92.1 -91.1 92.1 -91.1 0
3 6
From table 1, it is clear that the accuracy of our algorithm does not deteriorate when the mismatch becomes bigger. Our algorithm is very robust to filter corner frequency errors. Effects of test environment nonstationarity In real life testing, the testing environment will not be exactly the same during the time for measuring y1(t) and y2(t). In this simulation, we investigate the robustness of the proposed algorithms with respect to the nonstationarity of the testing environment. The most common nonstationarity could be the drifts of the Vref of the signal generator relative to the Vref of ADC under test. In the following simulation results, we model this relative drift between the two reference voltages by a linear gradient error in Vref of the input signal with respect to time. Other types of gradient errors could be easily handled but were omitted here. Table 2 summarized the SFDRs for different ppm per minute linear gradients in Vref. From table 2, we can see that the nonstationarity linear gradient does not affect the accuracy of our algorithm. Table 2. Testing results for various Vref gradients Nbit INL SFDR THD SFDR1 THD1 16 2.3 91.9 -90.7 91.9 -90.6 17 2.2 102.4 -96.6 102.5 -96.7 17 1.9 100.7 500 -97 100.6 -97.2 15 0.9 95.2 -90.6 95.3 -90.4 14 1.5 84.8 5000 -81 85.2 -81.6 15 1.2 89.5 -88.3 89.8 -88.6 15 1.2 96.3 -90.5 50000 95.9 -90.8 15 1.1 91.5 -89.4 91.2 -89.1
Grad 50ppm
0.3
Diff 0.1 -0.1 0 -0.1 -0.4 -0.3 0.4 0.3
Effects of measurement noise There will be some additive noise to the input signal in real life ADCs. This noise would cause the ADC’s noise floor in the spectrum to be higher. If the noise floor is as high as the largest harmonic distortion component, it will be very difficult to get the accurate SFDR for the ADC. In this simulation, we investigate the performance of our new algorithm in the presence of additive noise at the ADC input node. In the following simulations, V is the standard deviation of the random noise added to the imprecise input signal. From table 3, we can see that our algorithm can give very accurate SFDR reading when V