called ATAC, which measures the effectiveness of testing data, and presents two ... Case studies of two real-world software projects using ATAC are examined.
Achieving Software Quality with Testing Coverage Measures: Metrics, Tools, and Applications J. R. Horgan Bellcore
Saul London Bellcore
Michael R. Lyu Bellcore
Abstract This paper discusses the principles of data flow testing, describes a software testing and analysis tool called ATAC, which measures the effectiveness of testing data, and presents two case studies connecting software quality with the control and data flow testing coverage measures: block, decision, c-uses and puses. Results from these studies indicate that these measures are useful in uniformly assessing the quality of software testing, in controlling the testing process, and in program understanding. Although programming style can affect test coverage, a quantitative relationship between high testing coverage and program quality is emerging. We suggest practical guidelines in defining high quality software in the light of testing coverage measures. Keywords: Data Flow Testing, Testing Coverage Tool, Test Effectiveness, Software Metrics. 1. Introduction Coverage testing helps the tester create a thorough set of tests and gives a measure of test completeness. While the concepts of coverage testing are well-described in the literature [DeM87,Fra88], there are few tools that actually implement these concepts for standard programming languages; and realistic use of such tools on large-scale projects is rare. We describe the uses of ATAC (Automatic Test Analysis for C) [Hor92], a data flow coverage testing tool for C programs, in metrizing, controlling, and understanding the testing process. Case studies of two real-world software projects using ATAC are examined. The first study iinvolves 12 program versions developed by a university/industry joint fault-tolerant software project for a critical automatic flight control system [Lyu93a, Lyu93b]. The second study involves a Bellcore project composed of 33 program modules. These studies indicate that coverage analysis of programs during testing not only gives a clear measure of testing quality, but also reveals important aspects of software structure. Understanding the structure of a program as revealed in coverage testing and the quality metrics yielded in coverage testing can be a significant component in confident assessment of overall software quality. In Section 2 we summarize the essentials of data flow coverage testing. Section 3 illustrates the use of ATAC. Section 4 describes a case study of a university/industry joint project to obtain 12 program versions for a critical flight software system, in which ATAC was used to measure the effectiveness of software testing for the program versions. Section 5 discusses some experience at Bellcore in studing software quality during system testing viewed through the unit testing coverage measures. Some conclusions and future study plans are given in Section 6. 1
2. The Metrics in Data Flow Testing The purpose of software testing is to detect errors in a program and, in the absence of errors, gain confidence in the correctness of the program. Just as an adequate test of a used car consists of a satisfactory test drive and of a complete testing of the car’s components by a mechanic, thorough software testing requires both
functional and coverage testing (see [How87],[DeM87]). Functional testing
attempts to assure that a program’s specifications are met by exercising the features described in the specification. This kind of testing depends only on the specifications of the program and is independent of the encoding of the program.
Coverage testing identifies constructs in the program encoding that have
not been exercised during testing. The intuitive justification of coverage testing is that code constructs not exercised in testing case may contain errors. Coverage guides in testing important software constructs and gives a clear checklist of test completeness. Each of the different coverage criteria proposed in the literature [DeM87,Rap85] attempts to capture some important aspect of a program’s structure. Rapps and Weyuker [Rap85] define a family of data flow coverage criteria for an idealized programming language. Frankl and Weyuker [Fra88] extend these definitions to a subset of PASCAL and describe a tool to check for test completeness based on the data flow coverage criteria. We have adapted these data flow coverage definitions to define realistic data flow coverage
measure for C programs. A coverage measure associates a value with a set of tests for a
given program indicating the completeness of the set of tests for that program. We define the following data flow coverage measures for C programs based on the coverage criteria definitions of [Rap85]: block,
decision, c-use, p-use, and all-use. Exact definition of these concepts for the C language requires some care, but the basic ideas can be stated directly and are best illustrated by the example in Figure 1. We define these measures to be intraprocedural so they apply equally well to individual procedures (functions), sets of procedures, or whole programs. The simplest example of a measure of coverage is basic block coverage. The body of a C
basic blocks. These are portions of code which are normally executed together; that is, code fragments without branches. The block coverage of a set of procedure may be considered to be a sequence of
tests on a program is the ratio of the number of basic blocks executed (covered) by the tests to the total number of basic blocks. The block coverage
measure indicates the fraction of basic blocks in a program
that have been executed by a set of tests.
decision exists for each possible value of a branch predicate. For instance, in Figure 1, the predicate k == 1 may While basic block coverage is essential, it is not sufficient as a measure of test completeness. A
be true or false, so there are two decisions associated with that predicate. A case predicate may have many decisions associated with it. The
decision coverage of a set of tests is the ratio of the number of
decisions covered by the tests to the total number of decisions in the program.
2
#include main() { int n, i, k, sum, prod; printf("Enter an integer and 0 for +, 1 for *: "); scanf("%d %d", &n, &k); sum = 0; prod = 1; i = 1; while (i atacCC -o sum sum.c ATAC creates an instrumented executable program data flow tables. During program execution, ATAC’s run-time routine collects execution path information without interfering with the program’s usual behavior. We invoke sum to input the values 5 and 0. >sum Enter an integer and 0 for +, 1 for *: 5 0 n = 5, sum = 15 The correct output for
n =5 has been calculated and we examine the coverage achieved on sum.c by this
first test case. >atac -s sum.trace sum.atac % blocks % decisions % C-Uses % P-Uses ------------- ------------- ------------- ------------90(9/10) 60(3/5) 50(3/6) 75(3/4) == total == We see that 9 of 10 blocks have been covered and we can ask ATAC to display the uncovered block.
4
Figure 3: The block not yet covered in sum.c Now we test the functionality of sum on other inputs in the hope of also achieving fuller coverage. >sum Enter an integer and 0 for +, 1 for *: 5 1 n = 5, prod = 120 >sum Enter an integer and 0 for +, 1 for *: 0 0 n = 0, sum = 0 The results are in accord with our functional expectations. Now we ask ATAC how we are doing in coverage. >atac -s sum.trace sum.atac % blocks % decisions % C-Uses % P-Uses ------------- ------------- ------------- ------------100(10) 100(5) 83(5/6) 100(4) == total == We see that we have not covered one of the 6 c-uses in sum.c. We can ask ATAC to display that uncovered c-use. >atac -mc sum.trace sum.atac
Figure 4: The missing c-use in sum.c The result is in Figure 3. >sum Enter an integer and 0 for +, 1 for *: 0 1 n = 0, prod = 1 >atac -s sum.trace sum.atac % blocks % decisions % C-Uses % P-Uses ------------- ------------- ------------- ------------100(10) 100(5) 100(6) 100(4) == total == Another test will cover this c-use which we can see gives complete coverage of sum.c. The mixture of 5
functional and coverage testing has revealed that the four tests completely cover
sum.c on ATAC’s
sum.c is correct on the tests so far. Notice that this testing tells us nothing about whether sum.c was supposed to work for negative integers. An additional test shows that sum.c does not measures and that
work for negative integers. >sum Enter an integer and 0 for +, 1 for *: -5 0 n = -5, sum = 0 Our coverage testing has thoroughly examined the easy for such trivial programs as
circuitry of sum.c. Such complete coverage testing is
sum.c, but we shall see in the sequel that full coverage is much more
difficult for large and complex programs. The ATAC preprocessor analyses C source code (according to the ANSI standard or K&R) and produces a file containing data flow information (e.g. sum.atac) about the source program for use in the analysis phase. The preprocessor also creates a modified version of the source code instrumented with calls to the ATAC run-time routine. The modified source code is automatically compiled and linked as appropriate, to produce an executable program. During testing, the ATAC run-time routine, invoked from the modified program, records a data flow coverage execution slices (e.g. sum.trace) for use in the analysis phase. In the analysis phase, the tester may request coverage values for the preceding test for any of the data flow coverage measures, may display source code constructs not covered by the test cases, or may obtain various other analyses of the coverage data. Blocks not covered are displayed in a context of surrounding source code. Other constructs are also displayed by highlighting the constructs not covered in their context.
3.2 The Uses of ATAC We use the term
fault, in this section, to refer to a coding error. We reserve the term error to refer to
incorrect behavior of a program, presumably due to one or more faults in the code. ATAC can be used in the following six ways in the software improvement process.
To measure test set or test session completeness -- ATAC’s measures of test completeness give an objective measure of how completely a program or routine has been tested. This measure is useful in evaluating the quality of the testing procedure and in establishing a level of confidence in the quality of tested programs. A low coverage score indicates that the test cases do not effectively exercise the program. A high coverage score establishes a degree of confidence that the program, in passing the tests, works correctly.
To assist in generation or creation of new test cases -- ATAC is used to create new test cases in two ways. The first uses ATAC’s facility for displaying code not covered by a particular set of test cases. As we saw in the example of
sum.c, ATAC provides a source code browser that highlights code, or data flow
6
associations, that have not been executed. This is a programmer’s aid for improving unit testing. By examining the code, the programmer can create test cases that will cause these, as yet not covered, constructs to be covered. After running these additional test cases, the programmer can see which constructs are newly covered, and examine the remaining non-covered constructs. This is a simple, though possibly time consuming, exercise for function entry, block and decision coverage, and a somewhat more challenging exercise for c-use and p-use coverage. Since a thorough job of unit testing can vastly reduce the overall cost of testing a software system this technique is quite cost effective. We find that the visual feedback motivates the programmer to pursue higher levels of unit testing. The second way in which ATAC is used to create new test cases is by effective selection of randomly generated test cases. For many applications it is possible to automatically generate test cases. However, unless there is an correctness oracle for determining whether a test has passed, there must be a mechanism for selecting an effective, small subset of the large number of automatically generated test cases, if the generation process is to be practical. ATAC coverage measures, or any coverage measures that can be computed automatically, provide a basis for such a mechanism. Using coverage measures computed by ATAC, automatically generated test cases can be selected based on whether they improve the coverage for the whole test set. Test cases that are not selected need not be evaluated for correctness, a costly business. The final number of test cases selected is typically very much smaller that the total number generated. While creating test cases to improve data flow coverage may be challenging to a programmer, we find no similar difficulty for randomly generated test cases. For example in Figure 5a, we use ATAC as a coverage oracle to cull good coverage tests for the Unix sort program. By seeding the test generator with functional tests and an input syntax for sort.c, we generated sets of 1000, 10000, and 100000 tests. We culled the duplicate and useless tests, finding 27 of the 1000 to improve coverage, 7 of the next 10000, and only 2 of the last 100000 that improved coverage. The culling process and the ultimate coverage achieved are depicted in Figure 5b. The resultant 36 tests give reasonable coverage of the approximately 900 line sort program. The process ran overnight unattended, thus the real cost in human and computer time was small.
Test Case Generator
Program Input Profile
%decisions %blocks 99(509/516) 95(301/314)
%all−uses %p−uses 74(669/818) 73(1509/1850)
27 Coverage ORACLE
# good tests
7 2
Good Tests
1000 10000
/dev/null
Figure 5a: Coverage Used to Cull Tests
# tests generated
100000
Figure 5b: Coverage Generated for Unix sort.c
7
To assists in manual detection of faults via code inspection -- ATAC coverage displays have proven effective aids in fault detection via manual inspection of source code. Programmers may use ATAC coverage displays to focus code inspection on poorly covered sections of code which may be difficult to reach in the unit test environment. Often, while using ATAC to create additional test cases, programmers notice an unexpected pattern of coverage which leads directly to detection of a program fault. The data collected by ATAC may be used to locate a fault responsible for an error that is detected by one or more test cases. The code executed by a test may be called the execution slice of that test. When a test fails, the fault causing the failure must be somewhere in the execution slice of that test. If many tests fail, apparently due to the same fault, the fault causing the failure is likely to be in the intersection of the execution slices of those test cases. When a program containing a fault passes a test, the execution slice for that test may or may not contain the fault. (The faulty code may have executed in such a way that it does not adversely affect the behavior of the program for this test.) When subtraction of the execution slices for selected successful tests from the intersection of the slices for tests that fail is not empty, it is likely to contain the fault. ATAC can compute and display the resulting code fragments. In this way ATAC aids programmers in locating the code fault. The same technique can be used in the face of multiple code faults using appropriate weighting of successes and failures.
To locate faults and features based on execution slicing -- In the course of maintaining large software systems, it is sometimes necessary to locate, in unfamiliar code, the section that implements a particular application feature. The technique used for fault location can also be used to locate other code features. For example, given an association of each test with the application features it exercises (i.e. what it does), ATAC can use combinations of execution slices to determine the code sections where each application feature is implemented.
To prioritize test cases for regression testing -- The test cases run over the life of a program are often collected together to form a regression test set. The regression test set is re-run each time the program is modified to verify that the modifications have not adversely affected the behavior of the program. At some point a regression test set may grow large enough that it is not practical to run the whole set of tests after small program modifications. ATAC uses the execution slice of each test to determine a minimum set of regression test cases to achieve a given level of coverage. If the cost of execution of test cases varies, costs may be assigned to each test so that ATAC will provide a minimum cost set of test cases or a cost effective ordering of test cases. This technique may identify tests that add no coverage at all to the regression tests, and are therefore candidates for deletion. Tests that must be retained may be assigned a cost of zero so that they always remain cost effective.
8
377 ATAC TESTS 160 TESTS
blocks decisions p−uses all−uses 75% 65% 38% 44%
blocks decisions p−uses all−uses 75% 65% 38% 44%
42% of tests with 100% of the coverage
18 TESTS
blocks decisions p−uses all−uses 62% 52% 30% 37%
5% of tests with 85% of the coverage
Figure 6: Minimizing and Selecting Regression Tests for ATAC. An example of these techniques applied to some of the regression tests of ATAC can be seen in Figure 6. At an early stage of building the regression suite for atac we found that 377 tests could be minimized to 160 tests at no loss in coverage. Furthermore, at some loss in coverage just 18 tests were found. Such information is useful when we must re-test under time pressure.
To provide data for performance, risk and reliability analysis -- In addition to collecting coverage information, ATAC also collects the number of executions of a covered code construct. This data can be viewed in a source code browser with a color spectrum used to indicate frequency of execution. ATAC also uses this data to assign a measure of
risk to source code fragments. Risk is intended to portray the
likely hood of faults in a section of code based on local code complexity, coverage, and execution frequency. Software reliability analysis uses statistical techniques to predict the number of error causing faults remaining in software based on the pattern failures during previous testing. This technique relies on the assumption that the sequence of tests run vary in a uniform way. In particular, repeated execution of the same test should not appear the same as execution of many different tests. Execution slices collected by ATAC for each test can be used to obtain a difference measure over the tests. This can be incorporated in the software reliability analysis to improve the accuracy of the prediction.
4. Case Study 1: The U. of Iowa / Rockwell Joint Project Our first case study in software testing coverage measurement comes from a real-world airplane landing system, or so-called autopilot, which was developed by 15 programming teams at the University of Iowa and the Rockwell/Collins Avionics Division. Guided by an N-Version Programming design paradigm [Lyu92a], a total of 40 students (33 from ECE and CS departments at the University of Iowa, 7 from the Rockwell International) participated in this project to independently design, code, and test the autopliot application.
9
4.1 Overview of the Project The application used in this fault tolerant software project is part of a specification used by some aerospace companies for the automatic (computer-controlled) landing of commercial airliners. The specification can be used to develop the software of a flight control computer for a real aircraft, given that it is adjusted to the performance parameters of a specific aircraft. All algorithms and control laws are specified by diagrams which have been certified by the Federal Aviation Administration. The pitch control part of the autopilot problem, i.e., the control of the vertical motion of the aircraft, has been selected for the project. The software development cycle was conducted in several software engineering phases, including Initial Design Phase, Detailed Design Phase, Coding Phase, Unit Testing Phase, Integration Testing Phase, Acceptance Testing Phase, and Operational Phase. Software testing was a major activity in this project. In the Unit Testing (UT) Phase, each team was supplied with sample test data sets for each module to check the basic functionality of that module. A total of 133 data files (roughly equivalent to one execution of the completely integrated program) was provided in this phase. In the Integration Testing (IT) Phase, four sets of partial flight simulation test data, representing 960 complete program executions, were provided to each programming team. This phase of testing was intended to guarantee that the software was suitable for a flight simulation environment in an integrated system. Finally in the Acceptance Testing (AT) Phase, programmers formally submitted their programs for an acceptance test. In the acceptance test, each program was run in a test harness of flight simulation profiles for both nominal and difficult flight conditions. When a program failed a test, it was returned to the programmers for debugging and resubmission, along with the input case on which it failed. In summary, there were over 21000 different program executions imposed on these programs before they were finally accepted. By the end of this phase, 12 of the 15 programs passed the acceptance test successfully and were engaged in Operational Testing (OT) for further evaluations. These programs averaged 1550 uncommented lines of code and ranged from 900 to 4000 lines. 4.2 Program Metrics and Statistics A total of 96 faults was found and reported during the whole life cycle of the project. Table 1 shows the distribution of the detected software faults in the 12 accepted programs (identified by a Greek letter) with respect to the each test phase. The fault densities (as per thousand lines of uncommented code) of the original version and the accepted version for each program are also shown. It is noted that later in the operational testing phase, 1000 flight simulations, or over five million program executions, were conducted. Only one operational fault (in the β version) was found. This implies that the program quality obtained from this project was very high. For the 12 accepted programs, the average fault density was 0.05 faults. This number is close to the best current effort in the software industry. Detailed
10
report on the U. of Iowa / Rockwell Project could be found in [Lyu93a]. iiiiiiiiiiiiiiiiiiiiiiiiiiiiiiiiiiiiiiiiiiiiiiiiiiiiiiiiiiiiiiiiiiiiiiiiiiiiiiiiiiiiiiiiiiiii ciiiiiiiiiiiiiiiiiiiiiiiiiiiiiiiiiiiiiiiiiiiiiiiiiiiiiiiiiiiiiiiiiiiiiiiiiiiiiiiiiiiiiiiiiiiii Test Phase c c β c γ c ε c ζ c η c θ c κ c λ c µ c ν c ξ c ο c c Total c ic iiiiiiiiiiiiiiiiiiiiiiiiiiiiiiiiiiiiiiiiiiiiiiiiiiiiiiiiiiiiiiiiiiiiiiiiiiiiiiiiiiiiiiiiiiii cc c c c c c c c c c c c cc c UT ciiiiiiiiiiiiiiiiiiiiiiiiiiiiiiiiiiiiiiiiiiiiiiiiiiiiiiiiiiiiiiiiiiiiiiiiiiiiiiiiiiiiiiiiiiiii cc 2 c 2 c 3 c 1 c 3 c 3 c 5 c 3 c 2 c 1 c 2 c 2 c c 29 c ciiiiiiiiiiiiiiiiiiiiiiiiiiiiiiiiiiiiiiiiiiiiiiiiiiiiiiiiiiiiiiiiiiiiiiiiiiiiiiiiiiiiiiiiiiiii cc 4 c 3 c 4 c 4 c 1 c 0 c 3 c 2 c 2 c 2 c 3 c 1 c c 29 c IT c cc c c c c c c c c c c c cc c AT ic iiiiiiiiiiiiiiiiiiiiiiiiiiiiiiiiiiiiiiiiiiiiiiiiiiiiiiiiiiiiiiiiiiiiiiiiiiiiiiiiiiiiiiiiiiii cc 2 c 2 c 3 c 4 c 3 c 4 c 1 c 3 c 5 c 2 c 5 c 3 c c 37 c ciiiiiiiiiiiiiiiiiiiiiiiiiiiiiiiiiiiiiiiiiiiiiiiiiiiiiiiiiiiiiiiiiiiiiiiiiiiiiiiiiiiiiiiiiiiiii OT cc 1 c 0 c 0 c 0 c 0 c 0 c 0 c 0 c 0 c 0 c 0 c 0 cc 1 c iiiiiiiiiiiiiiiiiiiiiiiiiiiiiiiiiiiiiiiiiiiiiiiiiiiiiiiiiiiiiiiiiiiiiiiiiiiiiiiiiiiiiiiiiiii c Total cc 9 c 7 c 10 c 9 c 7 c 7 c 9 c 8 c 9 c 5 c 10 c 6 c c 96 c iciiiiiiiiiiiiiiiiiiiiiiiiiiiiiiiiiiiiiiiiiiiiiiiiiiiiiiiiiiiiiiiiiiiiiiiiiiiiiiiiiiiiiiiiiiiii iiiiiiiiiiiiiiiiiiiiiiiiiiiiiiiiiiiiiiiiiiiiiiiiiiiiiiiiiiiiiiiiiiiiiiiiiiiiiiiiiiiiiiiiiiii cc c c c c c c c c c c c cc c c Original c c 2.2 c 5.7 c 11.2 c 9.7 c 4.7 c 5.9 c 7.2 c 3.2 c 7.7 c 4.7 c 5.9 c 4.4 c c 5.1 c ciiiiiiiiiiiiiiiiiiiiiiiiiiiiiiiiiiiiiiiiiiiiiiiiiiiiiiiiiiiiiiiiiiiiiiiiiiiiiiiiiiiiiiiiiiiii c c c c c c c c c c c cc c fault density c c c cc c c c c c c c c c c c cc c fault density c c c 0.2 c 0 c 0 c 0 c 0 c 0 c 0 c 0 c 0 c 0 c 0 c 0 c c 0.05 c After AT ciiiiiiiiiiiiiiiiiiiiiiiiiiiiiiiiiiiiiiiiiiiiiiiiiiiiiiiiiiiiiiiiiiiiiiiiiiiiiiiiiiiiiiiiiiiii cc c c c c c c c c c c c cc c
Table 1: Fault Distribution of Each Program by Phases 4.3 Testing Metrics Measured by ATAC Facilitated by the ATAC tool, we further investigated the application of testing coverage metrics as a quality control mechanism to evaluate and analyze these programs. Table 2 shows the four coverage metrics (block, decision, c-use, p-use) of the 12 programs measured by ATAC, and the percentage of coverage obtained during each testing phase (UT, IT, and AT). Following the average value among the 12 programs for each metric, the highest value to the lowest value for each metric is given in the last column (range). iiiiiiiiiiiiiiiiiiiiiiiiiiiiiiiiiiiiiiiiiiiiiiiiiiiiiiiiiiiiiiiiiiiiiiiiiiiiiiiiiiiiiiiiiiiiiiiiiiiiiiiiiii ciiiiiiiiiiiiiiiiiiiiiiiiiiiiiiiiiiiiiiiiiiiiiiiiiiiiiiiiiiiiiiiiiiiiiiiiiiiiiiiiiiiiiiiiiiiiiiiiiiiiiiiiiii c µ c ν c ξ c ο c c average c range c Metrics c c β c γ c ε c ζ c η c θ c κ c λ iiiiiiiiiiiiiiiiiiiiiiiiiiiiiiiiiiiiiiiiiiiiiiiiiiiiiiiiiiiiiiiiiiiiiiiiiiiiiiiiiiiiiiiiiiiiiiiiiiiiiiiiiii c cc c c c c c c c c c c c cc c c c blocks c c 511 c 711 c 531 c 554 c 679 c 537 c 367 c 1132 c 542 c 473 c 457 c 483 c c 581.4 c 3.08 c c % in UT c c 65 c 59 c 62 c 70 c 44 c 64 c 56 c 60 c 68 c 68 c 71 c 57 c c 62.0 c 1.61 c c % in IT c c 85 c 71 c 77 c 83 c 74 c 86 c 79 c 76 c 80 c 88 c 86 c 80 c c 80.4 c 1.24 c c % in AT c c 95 c 78 c 88 c 95 c 88 c 98 c 91 c 91 c 90 c 97 c 97 c 94 c c 91.8 c 1.24 c iiiiiiiiiiiiiiiiiiiiiiiiiiiiiiiiiiiiiiiiiiiiiiiiiiiiiiiiiiiiiiiiiiiiiiiiiiiiiiiiiiiiiiiiiiiiiiiiiiiiiiiiiii c cc c c c c c c c c c c c cc c c c decisions c c 216 c 250 c 320 c 297 c 520 c 284 c 286 c 357 c 264 c 237 c 231 c 262 c c 293.7 c 2.41 c c % in UT c c 36 c 37 c 37 c 43 c 27 c 28 c 33 c 29 c 42 c 41 c 42 c 32 c c 35.6 c 1.59 c c % in IT c c 71 c 73 c 63 c 67 c 60 c 72 c 69 c 62 c 63 c 78 c 72 c 66 c c 68.0 c 1.3 c c % in AT c c 88 c 87 c 78 c 82 c 77 c 90 c 82 c 78 c 79 c 92 c 89 c 85 c c 83.9 c 1.19 c iiiiiiiiiiiiiiiiiiiiiiiiiiiiiiiiiiiiiiiiiiiiiiiiiiiiiiiiiiiiiiiiiiiiiiiiiiiiiiiiiiiiiiiiiiiiiiiiiiiiiiiiiii c cc c c c c c c c c c c c cc c c c c-uses c c 935 c 755 c 395 c 696 c 1027 c 636 c 710 c 965 c 727 c 537 c 803 c 665 c c 737.6 c 2.60 c c % in UT c c 60 c 57 c 56 c 50 c 45 c 57 c 44 c 69 c 56 c 55 c 56 c 55 c c 55.0 c 1.57 c c % in IT c c 83 c 76 c 80 c 67 c 70 c 81 c 72 c 84 c 74 c 81 c 78 c 82 c c 77.3 c 1.25 c c cc c c c c c c c c c c c cc c c % in AT 96 90 96 84 87 95 87 96 86 96 93 94 91.7 ciiiiiiiiiiiiiiiiiiiiiiiiiiiiiiiiiiiiiiiiiiiiiiiiiiiiiiiiiiiiiiiiiiiiiiiiiiiiiiiiiiiiiiiiiiiiiiiiiiiiiiiiiii cc c c c c c c c c c c c cc c 1.14 c c p-uses c c 413 c 340 c 349 c 520 c 611 c 463 c 459 c 419 c 355 c 310 c 279 c 392 c c 409.2 c 2.19 c c % in UT c c 30 c 34 c 38 c 32 c 26 c 22 c 23 c 37 c 42 c 36 c 38 c 29 c c 32.3 c 1.91 c c % in IT c c 66 c 60 c 63 c 47 c 58 c 59 c 49 c 61 c 59 c 68 c 64 c 61 c c 59.6 c 1.45 c c cc c c c c c c c c c c c cc c c % in AT c c 84 c 72 c 78 c 58 c 74 c 72 c 57 c 71 c 72 c 85 c 80 c 79 c c 73.5 ciiiiiiiiiiiiiiiiiiiiiiiiiiiiiiiiiiiiiiiiiiiiiiiiiiiiiiiiiiiiiiiiiiiiiiiiiiiiiiiiiiiiiiiiiiiiiiiiiiiiiiiiiii c 1.49 c
Table 2: Testing-related Coverage Metrics Measured By ATAC There are a number of interesting results that can be observed in Table 2. First we note that there were no strong correlations among these four program constructs. For example, the blocks and p-uses values for the
β version was an average number, while its decisions value was the smallest number but its c-uses
value was a very high one. We also noticed that one program execution exposed a variety of effects on different program constructs of different program versions, which contained a fairly large range of 11
percentages of coverage in blocks (44% - 71%), decisions (27% - 43%), c-uses (44% - 69%), and p-uses (22% - 38%). Moreover, the coverage of blocks and c-uses could be better achieved comparing with that of decisions and p-uses. We further observe that the programs have been tested with fairly high quality. In particular, the Acceptance Test achieved coverages as high as 98% of blocks, 92% of decisions, 96% of c-uses, and 85% of p-uses in some programs. Also noted was that even though some programs achieved consistent scores in these measures (e.g., ν version had very high values in all the measures; ζ version had both the lowest % c-uses and % p-uses), some programs did not (e.g.,
θ version had the highest % blocks, very
high % decisions and % c-uses, but relatively low % p-uses). It was also noted from that as number of program execution increased, the quality of test increased, and the range of coverage percentages reduced. Nevertheless, considering that these coverage results were obtained from the program versions of the same application tested through the same data, the differences in these measures seemed significant (e.g., the θ version obtained 98% of block coverage while the γ version only obtained 78%). On the other hand, we also noticed that there was a diminishing return on the coverage after the acceptance test, and the operational test data (five million program executions) did not increase this coverage significantly. This meant that the 22% uncovered code in the
γ version was
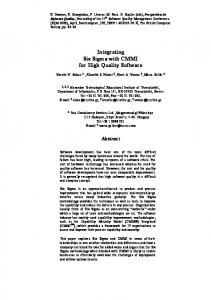
probably not even executed during the operational phase. Figure 7 summarizes how the increase of the software coverage metrics, measured by averaging those from the 12 programs, was achieved as testing progressed from Unit Testing (roughly equivalent to one complete program execution), Integration Testing (960 executions), to Acceptance Testing (21000 executions). As expected, the first execution hit a large area of the programs. When number of test case increased, the coverage measures monotonously increased. Amount of the increase, however, reduced as more test cases were added, finally reaching a plateau.
Coverage Percentage
100 90 80 70 block decision c-use p-use
60 50
coverage coverage coverage coverage
40 30 0
5000 10000 15000 20000 Number of Executions
25000
Figure 7: Increase in Coverage as Testing Progresses
12
Finally Table 3 summarizes the effectiveness of the three testing phases. In particular, the percentage of known faults detected up to a certain test phase is listed. From Table 3 we can see that the coverage obtained after Acceptance Testing was satisfactory regarding the achieved level of software quality. However, that obtained from Unit Testing and Integration Testing was not enough. The achievement of a higher level of coverage (e.g., from 80% to 90% of block coverage) proved to be a crucial step toward (from 60% fault detection to 99% fault detection) quality and reliability among the investigated programs. iiiiiiiiiiiiiiiiiiiiiiiiiiiiiiiiiiiiiiiiiiiiiiiiiiiiiiiiiiiiiiiiiiiiiiiiiiiiiiiiiiiiiiiiiiii c cc c c c c c c % Faults c Testing Phase ciiiiiiiiiiiiiiiiiiiiiiiiiiiiiiiiiiiiiiiiiiiiiiiiiiiiiiiiiiiiiiiiiiiiiiiiiiiiiiiiiiiiiiiiiiii c c No. of Tests c % Block c % Decision c % C-Uses c % P-Uses c c Detected c c cc c c c c cc c Unit Testing 1 62.0 35.6 55.0 32.3 30.2 ciiiiiiiiiiiiiiiiiiiiiiiiiiiiiiiiiiiiiiiiiiiiiiiiiiiiiiiiiiiiiiiiiiiiiiiiiiiiiiiiiiiiiiiiiiii cc c c c c cc c ciiiiiiiiiiiiiiiiiiiiiiiiiiiiiiiiiiiiiiiiiiiiiiiiiiiiiiiiiiiiiiiiiiiiiiiiiiiiiiiiiiiiiiiiiiii c c c c cc c Integration Testing c c 960 80.4 68.0 79.3 59.6 60.4 c cc c c c c cc c Acceptance Testing c c 21000 91.8 83.9 91.7 73.5 98.9 ciiiiiiiiiiiiiiiiiiiiiiiiiiiiiiiiiiiiiiiiiiiiiiiiiiiiiiiiiiiiiiiiiiiiiiiiiiiiiiiiiiiiiiiiiiii c c c c cc c Table 3: Testing Coverage Measures and Known Faults Detected during Testing One may suspect that there could be a correlation between the number of faults detected in a version and the coverage of the program constructs of the version, since it is hypothesized that the better a program is covered during testing, the more faults will be detected. However, we did not see strong correlations between the total faults detected in the program versions (Table 1) and their coverage measures during various testing conditions (Table 2). This may be due to the fact that each version has a different fault distribution to begin with, and therefore, the coverage measures would not be a good predictor for the absolute number of faults in the program. Besides, the number of faults detected in each version is not very large, which may reduce the statistical significance in the analysis. Furthermore, in using ATAC’s capability in highlighting non-covered code in the program, we can reveal the programming style and the testability of a program easily by examining the coverage of program constructs in detail. In the
γ version, for example, we noticed that the an untested error-handling function
accounts for 10% of the total blocks while the same function accounts for only 1-2% of block coverage in most other versions. It was observed that
γ version used a large amount of function calls to pass each
parameter in the calling routine of the error handling function, and each of the function call was counted as an uncovered block. This clearly indicates the need for an extra test case to increase the block coverage of the γ version.
5. Case Study 2: A Bellcore Project A central question of coverage testing is whether there is an exact "dose-response" relationship between the the percentage of coverage of a software system and the number of faults is the system. The analogy is to pharmacology where an attempt is made to calibrate a precise patient response to a particular quantity of medicine. The ideal for the testing manager will be to have tables giving an expected "bug" killing capacity for a given level of coverage testing.
13
In the Summer of 1992 we conducted a retrospective study which attempted to address the dose-response question on production software at Bellcore. The idea of the study was simple. We would first find a production system which had carefully preserved versions of codes, tests, and failure reports (called Modification Requests or MRS) at unit test phase and at system test phase. We would then retrieve the codes, tests, and MRS for each phase. Then the tests coverage would be assessed using ATAC, faults would be assigned to modules, and the relationship between coverage percentage and number of faults could be determined. The system we chose to study consisted of approximately 60,000 lines of code in 60 modules. We soon encountered significant difficulties in conducting such the study. The versioning system and the MR system had not been designed to facilitate such a retrospective study. Therefore, great care was required in accurately assigning faults described in MRS to the correct module.
This required considerable
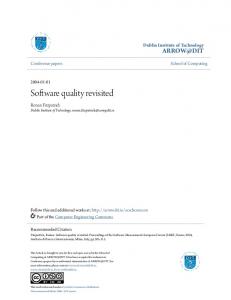
knowledge of the system, and we determined that an analysis on only half of the system could be performed. Ultimately we performed the study on 33 modules, their unit tests, and 35 system test MRS. There were several MRS which could not be accurately assigned and several modules which may have been assigned one of these ambiguous MRS or would have been assigned no MRS. These modules and MRS are eliminated from the data we report here. 5.2 Study Statistics and Analysis Figure 8a displays the achieved block coverage of unit tests for the 33 modules compared to the number of system test faults found for each module, while Figure 8b plots the achieved Uses coverage versus faults found in system tests. In Figure 8a the 33 modules by percentage of block coverage are plotted on the y axis and number of system test modification requests (MRS - equivalent to a fault) on the x axis. We had preserved the unit modules, the tests done at unit test time, the system build for system test, and the MRS recorded during system test. With these artifacts we were able to trace the MRS to the modules with the associated faults. For instance, we found that there were 13 modules with 0 MRS, and a single module had 6 MRS. From these data on this single experiment we can conclude nothing about a "dose-response" between levels of coverage testing and numbers of faults in a module. However a safe observation that can be taken from the data presented in Figure 8a is that modules with high block coverage (70% and above) are free of MRS in system test. This simple observation is in accord with the report of Piwowarski
et. al.
[Piw93]. In that study of several large IBM software systems is was found that statements coverage (virtually identical to block coverage) had a precise relationship with fault density. We believe that such results will be possible when coverage is the goal during testing. In our study coverage was assessed after testing. The testers were unaware of the level of testing during their testing and had no coverage goals.
14
0.80
% of all−uses covered by unit tests for 33 modules of a single system
% of basic blocks covered by unit tests for 33 modules of a single system
1.00 0.90 0.80 0.70 0.60 0.50 0.40 0.30 0.00
1.00
2.00
3.00
4.00
5.00
0.70 0.60 0.50 0.40 0.30 0.20 0.10
6.00
number of faults found in system tests
0.00
1.00
2.00
3.00
4.00
5.00
number of faults found in system tests
Figure 8a: System Testing Faults vs. Block Coverage Figure 8b: System Testing Faults vs. Uses Coverage Observations similar to those for block coverage can be made for
uses coverage in Figure 5b. In this
single study there is a clear relationship between high statement coverage in unit testing and low system test faults, and we allow the reader to draw the parallels between the different measures of coverage and MRS. The conclusion that MRS decrease with higher coverage seems sound if each module is regarded function point. However, if one adjusts for "size" (e.g. dividing MRS by the number of blocks in a module) this apparent result is suspect. Nonetheless, it is commonly accepted the block coverage less than 70% is not particularly likely to assure good testing. We therefore prefer to view these data as weakly supporting the hypothesis that high coverage tends to reduce faults. Further experimentation on the dose/response relationship (if any) between coverage testing and elimination of faults is underway in more controlled experiments. The final judgment on the value of coverage testing as a fault purgative will come only with use of coverage testing in standard software development. The difficulties we encountered in this study lead us to attempt a more controlled study on smaller programs with artificially seeded, but realistic, bugs [Won94]. Figures 9a and 9b summarize some of our findings. For each of the seven standard Unix programs, calc, checkeq, comm, look, spline, tr, and uniq, we generated 30 test sets with 90% to 95% block coverage. We then used ATAC to select a minimal size test set with the same coverage for each of the 30 test sets for each of the programs. The average test set sizes are represented in Figure 9a. Clearly the minimized test sets are, on average, substantially smaller. Figure 9b shows the average number of seeded bugs found by the test sets and by their minimized counterparts. While the minimized tests sets are substantially smaller, they are only marginally less effective in finding bugs. This leads us to the conclusion in this small study that it is the coverage rather than the number of tests which is detecting the bugs. We believe that a fuller study of this sort might establish a "dose-response" between degree of coverage testing and bug detection.
15
6.00
82.57 81.8
91.67 89.67 91.38 91.21
85 80
75 75
75
71.78 68.44
70 65 60
uniq.c
50.83 47.5 tr.c
spline.c
look.c
45
comm.c
50
chekeq.c
55
cal.c
5.07 uniq.c
tr.c
spline.c
look.c
5.23 comm.c
cal.c
0
chekeq.c
2.5
unminimized minimized 4.33 4.0 2.55
5
5.73 5.63 4.47 4.8 2.97
7.4
7.5
90
unminimized minimized
10
Average percentage of faults found by unminimized and minimized test sets
13.8
13.36
12.0
Average size of 30 test sets with 90−95% basic block coverage.
12.5
92.04 91.48
95%
15
Figure 9a: Average size of unminimized and minimized test sets. Figure 9b: Average effectiveness of size of unminimized and minimized test sets. The use of coverage testing in the software process can be two-fold. First, coverage may be taken as a measure of testing quality. It is not uncommon to find that testing that is considered thorough and complete, as in the present study, is not very complete from the coverage point of view. Coverage measurement allows the manager to set repeatable and objective targets for testing quality. Second, coverage is an excellent feed-back mechanism for the software engineer. An examination of Figure 8a reveals that one module has 6 MRS and was block covered to less than 40% covered during unit testing. One can use such data to focus testing effort on faulty and poorly covered modules.
6. Conclusions In the effort of using testing coverage measures to derive high quality test data, it is implicitly assumed that a good test has a high data flow coverage score. This hypothesis requires that we show that good data flow testing implies good software, namely, software with higher reliability. One would hope, for example, that code tested to 85% c-uses coverage would exhibit a lower field failure rate than similar code tested to 20% c-uses coverage. The establishment of a correlation between good data flow testing and a low rate of field faults (or that there is none) is the ultimate and critical test of the usefulness of data flow coverage testing. In the first case study the 12 program versions from the U. of Iowa / Rockwell project obtained very high testing coverage scores, indicating the achievement of high quality software. Results from the field testing (in which only one fault was found) confirmed this confidence. In the second case study the quality of functional modules in a system was again indicated by the testing coverage measures obtained in the unit
16
testing. One might draw tentative guidelines for high quality software from the U. of Iowa / Rockwell project: the achievement of 90% block coverage, 80% of decision coverage, 90% of c-uses coverage, and 70% of p-uses coverage. However, the Bellcore data seem to show that practical testing falls far short of these standards. Indeed, the practical guideline which we can suggest is that in large projects 70% coverage is a safe minimum. This minimum required that the uncovered code is inspected and judged unexecutable (e.g. it is defensive code not presently meant to be executed), or too difficult to execute (e.g. exception handling or error handing code), or rationalized in some other sensible fashion. The basic rule of thumb is that all code should be covered or otherwise validated. The ultimate question that we hope to answer is a central to software engineering: "When is a program considered acceptable?" Many software reliability models have been proposed to answer this question [Lyu92b]. However, few [Piw93, Che92] address the issues of program constructs, data flow testing, and testing coverages, which are deemed important to testing people. Investigation on the relationship between the quality of data flow testing and the subsequent detection of field faults may lead to a unified technique combining testing methodology and reliability theory to address the program acceptance problem.
Acknowledgments Our colleagues H. Agrawal and E. W. Krauser have contributed substantially to the work reported here. A. O. Olagunju, Delaware State College, with the aid of our Bellcore T. K. Ramaprasad, L. W. Smith, and E. I. Yang, conducted the experiment which yielded the data of Figure 8. References [Che92] Chen, M., J.R. Horgan, A.P. Mathur, V.J. Rego, "Time/Structure Based Model for Estimating Software Reliability" Purdue University, SERC-TR-117-P, 1992. [DeM87] DeMillo, R.A., W.M. McCracken, R.J. Martin, J.F. Passafiume, Software Testing and Evaluation, The Benjamin/Cummings Publishing Company, Menlo Park, CA, 1987. [Fra88] Frankl, P.G., E.J. Weyuker, "An Applicable Family of Data Flow Testing Criteria," IEEE Transactions on Software Engineering, Vol. SE-14, No.10, October 1988. [Hor92] Horgan, J.R., S.A. London, "A Data Flow Coverage Testing Tool for C," Proceedings of Symposium on Assessment of Quality Software Development Tools, New Orleans, LA., pp. 2-10, 1992. [How87] Howden, W.E., Functional Program Testing and Analysis, McGraw-Hill, New York, 1987. [Lyu92a] Lyu, M.R., A. Avizienis, "Assuring Design Diversity in N-Version Software: A Design Paradigm for NVersion Programming," Dependable Computing and Fault-Tolerant Systems, J.F. Meyer, R.D. Schlichting eds., Springer-Verlag, Wien, New York, pp. 197-218, 1992.
17
[Lyu92b] Lyu, M.R., A. Nikora, "Using Software Reliability Models More Effectively," IEEE Software, pp. 43-52, July 1992. [Lyu93a] Lyu, M.R., "Improving the N-Version Programming Process Through the Evolution of a Design Paradigm," IEEE Transactions on Reliability, vol. 42, No. 2, pp. 179-189, June 1993. [Lyu93b] Lyu, M.R., J.R. Horgan, S. London, "A Coverage Analysis Tool for the Effectiveness of Software Testing," Proceedings of ISSRE’93, Denver, CO, pp. 25-34, November 1993. [Piw93] Piwowarski, P., M. Ohba, J. Caruso, "Coverage Measurement Experience During Function Test," Proceedings of 15th International Conference on Software Engineering, Baltimore, MD, pp. 287-301, May 1993. [Rap85] Rapps, S., E.J. Weyuker, "Selecting Software Test Data Using Data Flow Information," IEEE Transactions on Software Engineering, Vol. SE-11, No.4, April 1985. [Won94] Wong, W.E., J.R. Horgan, S. London, A.P. Mathur, "Effect of Test Set Minimization on the Error Detection Effectiveness of the All-Uses Criterion," Purdue University, SERC-TR-152-P, 1994.
Short Biographies Joseph R. Horgan is a member of the technical staff of Bellcore’s Information Sciences and Technologies Research Laboratory where he has been since 1983. His research is in software analysis, testing, and reliability. Prior to his employment with Bellcore he was with Bell Labs and on the faculty of Computer Science at the University of Kansas. He has also worked the University of Delaware and IBM. Horgan received a BA and a MA from the University of Delaware in philosophy and a PhD from the Georgia Institute of Technology in computer science. Saul London is a member of technical staff in the Information Sciences and Technologies Research Laboratory at Bellcore. His research interests include software testing, programming languages, and software reuse, and telecommunications software. London received his BA in mathematics from Columbia University in 1980 and his MS in Computer Science from New York University in 1982. Michael R. Lyu has been a member of the technical staff in the Information Sciences and Technologies Research Laboratory at Bellcore since 1992. Prior to Bellcore he was a technical member at Jet Propulsion Laboratory and a faculty member at the University of Iowa. His research interests include software engineering, software reliability, and fault-tolerant computing. He is the editor for two book volumes: McGraw-Hill Handbook of Software Reliability Engineering (to be published by McGraw-Hill), and Software Fault Tolerance (to be published by Wiley). Lyu received his BS in Electrical Engineering in 1981 from National Taiwan University, his MS in Electrical and Computer Engineering in 1984 from the University of California, Santa Barbara, and his PhD in Computer Science from the University of California, Los Angeles, in 1988.
18