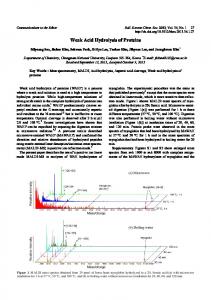
In our model of cellulose acid hydrolysis, the cleavage of a glycosidic bond and the ...... Gillespie, D. T., âExact Stochastic Simulation of Coupled Chemical.
Acid Hydrolysis of Cellulose. Part 11: Stochastic Simulation using a Monte Carlo Technique ZIN-EDDINE DADACH, JOSE-HENRJQUE Q. PINTO* and SERGE KALJAGUINE** CERPIC, Dkpartement de Ginie Chimique, Universitk Lmal, Ste-Foy, Qukbec GlK 7P4 A Monte Carlo procedure was developed to simulate cellulose acid hydrolysis at high temperatures. Both the kinetic information related to the model compound cellobiose and the morphological aspect of cellulose including crystalline, semi-amorphous and amorphous zones were estimated from experimental data and introduced in a FORTRAN program. In our model of cellulose acid hydrolysis, the cleavage of a glycosidic bond and the degradation of glucose are considered as two irreversible reactions in series. For all the temperatures, the overall glucose disappearance rate constant used in our model, was higher than the experimental constant obtained from the degradation of pure glucose. The changes related to the effects of milling on the cellulose acid hydrolysis were successfully considered in the procedure. Finally, the observed good agreement between the simulated and the experimental data of glucose yield versus time proved that Monte Carlo simulation associated with a Markov chain is a flexible connection between cellobiose (model compound) and cellulose conversion reactions.
Une procedure de Monte Carlo a BtC developpte pour simuler l’hydrolyse acide de la cellulose I? des temperatures ClevCes. Les informations cinetiques du compose mod5le cellobiose ainsi que l’aspect morphologique de la cellulose incluant les zones crystallines, semi-amorphes et amorphes ont Ct6 estimdsI? partir des donnCes exp6rimentales et introduits dans le programme FORTRAN. Dans notre modtle de I’hydrolyse acide de la cellulose, la rupture des liaisons glycosidiques et la degradation du glucose sont considCrees comme deux rkactions successives et irreversibles. Pour toutes les tem@ratures, la constante cinCtique de disparition globale du glucose utilisk dans notre modkle, a Ctd supkrieure h la constante cinetique experimentaleobtenue B partir des expdriences de degradationdu glucose pur. Les changements relics aux effets du broyage sur l’hydrolyse acide de la cellulose ont aussi CtC traitCs avec succts dans la simulation. Finalement, la concordance observee entre les valeurs simulCes et les donnees experimentales de la concentration du glucose produit en fonction du temps a prouvC que la simulation par des techniques de Monte Carlo associde B une chaine de Markov est un lien flexible entre le compose mod5le celloboise et les reactions de conversion de la cellulose. Keywords: acid hydrolysis, cellulose, depolymerization process, stochastic simulation, Monte Carlo technique.
E
xperimental investigations of cotton fibres saccharification by acid hydrolysis have been achieved in the first part of this study (Dadach and Kaliaguine, 1993). The values of the pseudofirst-order rate constant for the rupture of fl (1,4) glycosidic bonds were estimated from the acid hydrolysis of cellobiose. Since glucose is thermally degraded during experiments of cellulose acid hydrolysis performed at high temperatures, the experimental rate constants of pure glucose acid degradation were also obtained. The main objective of the present work is to investigate whether the kinetic data observed for cellobiose acid hydrolysis and glucose degradation as well as the experimental information related to the morphology of cotton fiber could be successfully used in a computer-oriented simulation procedure in order to simulate the experimental glucose concentrations as a function of time during cellulose acid hydrolysis. Such a stochastic approach has already been used by many authors for reaction kinetics modeling (Gillespie, 1977; Turner, 1977; McDermott and Klein, 1986; Train and Klein, 1988). Recently McDermott et al. (1990) and Pinto and Kaliaguine (1991) have used a Monte Carlo technique to simulate respectively lignin degradation and amylose acid hydrolysis using the lunetic information obtained from model compounds
Cellulose acid hydrolysis process Hydrolysis of cellulose is generally considered as a firstorder reaction with respect to the concentration of fl (1-4) *Present address: Department of Forestry, 126 Natural Resources, Michigan State University, East Lansing, MI 48824, USA. **Author to whom correspondence should be addressed. 106
bonds between fi-anhydroglucose monomers (Sharples, 1968; Ladish 1989). The cleavage of a glycosidic bond in acid media has been studied and many mechanisms have been proposed (BeMiller, 1967). It is now generally accepted that the reaction starts with a rapid protonation of the glycosidic oxygen atom, followed by a slow breakdown of the protolysed conjugate acid to the cyclic carbonium ion, which adopts the half-chair conformation. A fast reaction with water then gives the reducing glucose (Sjostrom, 1981; Fengel and Wegener, 1984). It is also well known that, in aqueous acid solution, glucose undergoes inter- and intra-molecular elimination of water between the hemiacetal and mainly the hy droxyl groups. Therefore, the main products of the reverse condensation reactions are essentially isomaltose, gentiobiose and 1:6-anhydro-fl-D-glucopyranose (levoglucosan). However, cellobiose and higher oligosaccharides were also detected (Sugisawa and Edo, 1964). During our experiments with glucose degradation, the only measurable product was glucose. Therefore, the kinetic constant (ko) estimated from the experimental data included all the glucose degradation and reverse reactions. On the other hand, the peak that was related to some unidentified saccharides of higher molecular weight than cellobiose was more important during experiments with cellobiose acid hydrolysis than the peak detected during pure glucose experiments. This could be an indication that the dehydration reactions were more important during cellobiose acid hydrolysis than during pure glucose acid degradation. This fact was supported by the necessary increase of 10%of the rate constant of glucose degradation for the deterministic simulation of glucose yield versus time during cellobiose acid hydrolysis (Dadach and Kaliaguine, 1993).
THE CANADIAN JOURNAL OF CHEMICAL ENGINEERING, VOLUME 72, FEBRUARY, 1994
but also on the length of an allowed transition step At 1967):
G - G - G - G - G - G - G - G - G - (McQuarrie, G
1A t G-G-GG-G-G-G-G-G G
1A t G-G G G-G-G-G-G-G G
1A t G-G G G-G-GG-G-GG
1A t G G G G-G-G G-G-G G
Figure 1 - Random trajectory of the depolymerization of a linear polymer. Moreover, as indicated by the data presented in the first part of this work (Dadach and Kaliaguine, 1993), the rate of rupture of the glycosidic bonds is also affected by the ease by which the glycon rings are reached by the acid ions (Segal, 1971; Feller et al., 1986). Therefore, the accessibility of the glycon rings, located in the crystalline regions could be a limiting factor to the rate of rupture of the glycosidic bonds. The drastic conditions necessary to produce significant saccharification of cellulose also result in the undesirable secondary decomposition of glucose into such products as furfurals and levoglucosan (Conner et al., 1986).
Stochastic Simulation of a polymer depolymerization process The basis of Monte Carlo simulation is to construct a deterministic kinetic model based on the probabilistic one by considering its reaction constants not as reaction “rates” but as reaction “probabilities per unit time”. Therefore, reaction occurs with a certain probability (Gillespie, 1976). This concept has been surveyed in an extensive review paper by McQuarrie (1967). In order to understand the stochastic approach to a polymer degradation process, a random reaction trajectory of a linear oligomer with a degree of polymerization of 10 (9 bonds) is illustrated in Figure 1. The real reaction time is divided into small time increments At and each downward arrow represents the passage of one At for the simulated depolymerization process. Assuming that the polymer linkages are ruptured independently with a first order rate constant k, the transition probability that each bond, in state (i) at time t , is in state (i) at time @ + A t ) , depends not only on its rate constant k ,
Pri - (t, t + A r)
= kAt
+ o (At) . . . . . . . . . . . . . .
(1)
where o(At) is a function of At satisfaying
-
limA,
[ O(At)/At]=0 . . . . . . . . . . . . . . . . . . . . . . .
In the limit as At (Trivedi, 1982):
Pri
-j
(t, t
-
(2) 0, Equation (1) could be expressed as
+ At) = 1- exp
[ -k A?] . . . . . . . . . . (3)
After the passage of each At, the rupture of each polymer bond is tested by comparing the transition probability for each bond to a randomly selected number. One or more bonds are ruptured when a selected random number comprised between 0 and 1 has a value less than the calculated transition probability for the bond tested. The final result after each At represents the new state of the chain (Train and Klein, 1988). To simulate this reactive system as a Markov chain, the polymer could be considered as a group of parallel subsystems, each one being composed of a single bond (Pinto and Kaliaguine, 1991). The markovian assumption is equivalent to specifying that the physical system has an extremely limited memory, that is, given the “present” of the process, the “future” is independent of its “past” (Wolff, 1989). Therefore, the time evolution of the system proceeds by allowing fixed time intervals, At to pass in series and the simulated process takes the form of a markovian random walk in the N-dimensional space of the population of the N different bonds (Gillespie, 1976). Since the reaction of a single polymer chain would not provide statistically significant results, when the final reaction time is reached, other identical polymers are randomly reacted using the same procedure. Averaging individual conversions at each time over a fixed number No of Markov chains produces the Monte Carlo simulation.
Stochastic simulation of cellulose acid hydrolysis The FORTRAN progam used in this work for the stochastic simulation of cellulose acid hydrolysis is based on the Monte Carlo technique developed by Pinto (1992) for the simulation of the acid hydrolysis of polysaccharides using the kinetic information obtained from the model compound, cellobiose. For the simulation of amylose acid hydrolysis at temperatures where glucose degradation was neglected, Pinto and Kaliaguine (199 1) used two different approaches. In the first simulation procedure, based on Gillespie’s classic work (1976), the calculated rate of glucose formation was in poor agreement with the values observed experimentally. On the other hand, the rate of glucose formation calculated by the second stochastic procedure, based on the work of McDermott et al. (1990) and described in the previous section of this paper, were in excellent quantitative agreement with their experimental data. In the present study related to the acid hydrolysis of cellulose at temperatures higher than 110°C, experimental information including the morphology of cellulose and the rate constant of glucose degradation are therefore considered in the FORTRAN procedure. As reported in the experimental part of this investigation and shown in Figure 2, the model for cellulose chains used in our simulation will include the crystalline and the amorphous regions of cotton fibers as well
THE CANADIAN JOURNAL OF CHEMICAL ENGINEERING, VOLUME 72, FEBRUARY, 1994
107
_ _
I ,=
G............G-G-G-G-G-G-G G-G-G-G-GrG-G-G.............G -
‘S.4
- _
A ‘
LBiA
‘SA
Figure 2 - Morphological model of cellulose chains. as the regions of intermediate crystallinity. Therefore, the new parameters involved are the length of the three kinds of regions, namely the amorphous (LA), semi-amorphous (LsA) and crystalline or non-amorphous (LNA) regions. The parameter L N is ~ estimated from our experimental levelling-off degree of polymerization (LNA=LODP =200). Our IR spectra indicated that the crystallinity index of the cotton fibers is 79.0%(Dadach and Kaliaguine, 1993). The crystallinity of cotton fibers varies considerably depending on the experimental technique used for its determination (Young, 1986).According to Scallan (1971),90%is a typical degree of crystallinity of nontreated cotton linters and nontreated cotton fibers. In the present work, a crystallinity of 90% is considered and the length of the amorphous, semi-amorphous and crystalline regions could then be estimated from the following equation:
cr =
+ +
[ LNA/(LA Ls’4 LNA)]
. . . . . . . . . . . . . . . . . . (4)
Therefore, the values introduced in the program procedure are: (LA)= 14; (La) =7; (LNA) =200. The experimental average degree of polymerization of the cotton sample (DP=2200) is also introduced in the input data of the program. Many models for the depolymerization of linear chain molecules have already been considered in the literature (Simha, 1941; Sillen, 1943; BeMiller, 1967). In these models, three different hypotheses have been made: 1. The rate of disintegration is the same for all bonds, independent of their position in the chain. 2. There is a preferred breaking at the ends of the chain (one or both ends) and a common hydrolysis rate for all other bonds. 3. There is a progressive change in the rate of disintegration as a function of the distance from ends of the chain. In the present study, the value of the ratio (M = 2) between the kinetic constant of the non-reducing end (k2)and the one of the reducing end (k,), used by Pinto and Kaliaguine (1991) to simulate the experimental results of Kamiyama and Sakai (1979) for the hydrolysis of xylooligosaccharides of DP ranging from 3 to 5 , will be considered. As a result, in each of the three zones, two rate constants are considered: k2 for the nonreducing ends and kl for all other bonds. Therefore, at each time step At, six types of bonds are tested for rupture using Equation 3 and the corresponding rate constants are related in the following manner: (k2 / k l ) A = (k2 / k l ) S A = (k2 / k l ) N A = 2.0. . . . . . ( 5 ) Moreover, we assume that the rate constant k2 of the nonreducing ends in the amorphous regions is equal to our experimental hydrolysis rate constant of cellobiose ki . The values of the rate constant at the nonreducing ends of the crystalline regions of cotton (k2,NA=1/1100 min-‘1 is estimated from the experimental ratio of the slope of the decrease of the average degree of polymerization of cotton fibres during the first and last stages of the cellulose acid hydrolysis process (Dadach and Kaliaguine, 1993). In the 108
same way, the rate constant for the semi-amorphous regions (k2,sA= 1/50 min -’) was estimated from the average value of all intermediate stages observed during our experiments. Therefore, the rate constants of the all nonreducing ends of cellulose are related to the cellobiose hydrolysis rate constant by:
(kz,~/k;)=l;( k 2 , s ~ / k i ) = 1 / 5 O(k2,~A/k$)=l/ll00 ; . . (6) Furthermore, since the cellulose acid hydrolysis experiments were conducted at high temperatures, where glucose is thermally degraded, the FORTRAN program should also include the transition probability related to the pseudo first-order rate constant for glucose degradation, k; determined from experiments of glucose described in the first part of this study: pglucose
- degrad. ( f , t + At)=
- exp [ki At1 . . . . (7)
In our model of cellulose acid hydrolysis, we have considered the rupture of the P( 1,4)bonds and the degradation of glucose as two first order irreversible reactions. Therefore, the rupture of any glycosidic bond adjacent to a ruptured bond may be followed by a degradation of the glucose formed: ~ A B
~ B C
.......................... - B - C (8) However, according to Peat and his coauthors (1958), when a glycosidic linkage of a polysaccharide is severed by acid, the two saccharide fragments may combine with water or, alternatively with each other or with other fragments. In the latter case, the energy associated with the original linkage could be available to accelerate the formation of reversion products. Therefore, in order to consider all the reactions related to a possible combination between the glucose formed and reducing ends of other oligomers or between oligomers, the pseudofirst-order rate constant k; determined from experiments of pure glucose was replaced in our model by an overall glucose disappearance rate constant. A Monte Carlo simulation of this simplified model of cellulose acid hydrolysis is complicated by the fact that the use of Markov chain formulation allows only one reaction per molecule per discrete time step At. Therefore, the glucose formed (B) will not react in the same At in which it was formed. An erroneous overestimation of the glucose yield could be especially large during the rupture of the glycosidic bonds located in the non-amorphous regions, where the glucose degradation rate is much higher than its formation rate. This situation was analysed by McDermott et al. (1990). To allow more than one reaction of the same molecule in one simulation time step At, the authors introduced the transition probability (PAC)that a molecule (A) at time t , is transformed into (C) at time ( t + A f ) :
A
PAC = - [kBC 1 (kAB
- kBC)I
PAB -k
[kAB / (kAB - k ~ c ) ]PBC . . . . . . . . . . . . . . . . . . . (9) Therefore, for a hypothetical transition of a molecule (A), a randomly selected number (RN) is compared to the transition probabilities: 1-lf RN