Sensors 2015, 15, 27832-27853; doi:10.3390/s151127832 OPEN ACCESS
sensors ISSN 1424-8220 www.mdpi.com/journal/sensors Article
Active-Optical Sensors Using Red NDVI Compared to Red Edge NDVI for Prediction of Corn Grain Yield in North Dakota, U.S.A. Lakesh K. Sharma 1, Honggang Bu 2, Anne Denton 3 and David W. Franzen 2,* 1
2
3
Cooperative Extension Service, University of Maine, 57 Houlton Road, Presque Isle, ME 04769, USA; E-Mail:
[email protected] Department of Soil Science, School of Natural Resource Sciences, North Dakota State University, Dept. 7180, PO Box 6050, Fargo, ND 58108, USA; E-Mail:
[email protected] Department of Computer Science, North Dakota State University, Dept. 2740, PO Box 6050, Fargo, ND 58108, USA; E-Mail:
[email protected]
* Author to whom correspondence should be addressed; E-Mail:
[email protected]: Tel.: +1-701-799-2565; Fax: +1-701-231-6186. Academic Editor: Fabrizio Lamberti Received: 13 August 2015 / Accepted: 28 October 2015 / Published: 2 November 2015
Abstract: Active-optical sensor readings from an N non-limiting area standard established within a farm field are used to predict yield in the standard. Lower yield predictions from sensor readings obtained from other parts of the field outside of the N non-limiting standard area indicate a need for supplemental N. Active-optical sensor algorithms for predicting corn (Zea mays, L.) yield to direct in-season nitrogen (N) fertilization in corn utilize red NDVI (normalized differential vegetative index). Use of red edge NDVI might improve corn yield prediction at later growth stages when corn leaves cover the inter-row space resulting in “saturation” of red NDVI readings. The purpose of this study was to determine whether the use of red edge NDVI in two active-optical sensors (GreenSeeker™ and Holland Scientific Crop Circle™) improved corn yield prediction. Nitrogen rate experiments were established at 15 sites in North Dakota (ND). Sensor readings were conducted at V6 and V12 corn. Red NDVI and red edge NDVI were similar in the relationship of readings with yield at V6. At V12, the red edge NDVI was superior to the red NDVI in most comparisons, indicating that it would be most useful in developing late-season N application algorithms.
Sensors 2015, 15
27833
Keywords: corn; ground-based active-optical sensors; nitrogen; soil
1. Introduction Numerous methods have been used to manage N application to crops, including zone soil sampling [1], soil and plant analysis [2], use of nitrogen credit from the influence of previous crops [3], tissue analysis [4], fertilizer application timing and placement [5–8], leaf area index [9–13], and the use of spectral sensors [2,14–21]. Normalized Differential Vegetative Index (NDVI) has been used for decades as a predictor of vegetative biomass [22]. The use of active-optical sensors to direct in-season N application is being used in wheat (Triticum aestivum, L.) and corn (Zea mays, L.) growing areas of the USA. The algorithms developed to direct in-season N application use one of two methods. One method is to establish an N non-limiting area within the field at the time of preplant N application [20] or an N-rate “ramp” consisting of a continuous series of increasing N rates with the highest N rate designed to be non-limiting to the crop [23]. The second method is to use the variability in greenness already in the field by using the greenest area within the field as the N non-limiting standard [24]. Once an NDVI measurement is performed on the N non-limiting standard, by either method, the result is that the greatest yield possible for the variety within the soil where the N non-limiting area is located is predicted. Sensor measurements within the field less than the standard sensor measurement result in lower yield predictions. The yield difference is used to calculate the N required to increase yield from its predicted value if no additional N was added to a yield predicted in the standard area. Most of the algorithms developed for active-optical sensor use for in-season N fertilization utilize red NDVI. It is important to differentiate NDVI and specify red NDVI, even though NDVI is usually assumed to be based on red and near infrared calculations, because red edge NDVI is also utilized in these experiments. Red NDVI readings are an indication of the coverage of soil by leaves. Once leaves completely cover the row, as viewed from above the leaf canopy, differences in red NDVI readings fall into a narrow range, commonly from 0.85 to 1.0. Sensing differences in yield potential from leaf canopy closure on is difficult due to the narrow range of possible readings, referred to as “saturation” [24,25]. The plant pigments that are most involved in the photosynthetic process are chlorophylls a and b. These pigments absorb light in red and blue spectra and reflect green. Light reflectance from plants depends upon several factors such leaf surface area, surface properties, plant stress levels and internal structure [26]. Red and infrared wavelengths have been used frequently to assess the plant biomass [27]. There is more reflectance from plants in the near infrared (700–1400 nm) spectrum of light [28–30]. The Normalized Difference Vegetation Index (NDVI) is the most used vegetative index by researchers and practitioners for plant biomass prediction [31–33]. Measurement of normalized difference vegetative index (NDVI) and its conversion to in-season estimation of yield (INSEY) provides a convenient approach that can be used for variable in-season nitrogen (N) application [19–21,24,34,35] in corn. Within the red wavelength, green leaves have a reflectance of 20% or less in the 500 to 700 nm range (green to red) whereas within the red edge and near infrared wavelength, leaves reflect as much as 60% in the 700 to 1300 nm range (near infrared) [15]. In addition, the red spectrum is highly sensitive to low chlorophyll
Sensors 2015, 15
27834
content (3–5 μg∙cm−2) whereas the red edge spectrum (700–750 nm) is sensitive to a wider range of chlorophyll (0.3–45 μg∙m−2) [15]. In pepper (Capsicum annuum), red edge was found to be the best wavelength describing the chlorophyll content [36]. Although the relationship between the red edge and leaf chlorophyll has been previously described [37,38], the application of the relationship on N status or yield prediction is unclear [36]. Part of the reason for uncertainty regarding the use of red edge NDVI is inconsistent past performance. For example, no correlation between red edge and leaf chlorophyll content in sugar beet (Beta vulgaris) was found by Demetriades-Shah and Steven [39]. In contrast, strong sensitivity of red edge NDVI to chlorophyll concentration in splash pine (Pinus elliottii) was reported in separate studies [40,41]. The performance of the red edge wavelength as a predictive tool for estimating potential yield depends not only on its sensitivity to chlorophyll concentration but also plant scattering properties inherent in total biomass, which change the peak light reflectance wavelength and the magnitude of reflectance from plants [38,41]. A strong relationship of red edge NDVI with yield was found at V12 stage in corn in recent North Dakota studies [25]. Plant growth stage is responsible for changes in the scattering behavior of light in several crops, including durum wheat (Triticum durum) [42], forage grasses [43], and barley (Hordeum vulgare, L.) [44]. In barley, the ratio of infrared to red changes with time, indicating that the ratio is growth dependent [44]. The reason of light scattering changes is the change in internal properties of plant leaves. Air space in mesophyll cells was reported to be less during younger growth stages compared to older leaves, which causes a change in the value of spectral reflectance [45]. Environmental stress such as water stress may also change reflective characteristics in red edge NDVI because water stress affects the internal structure of plant cells and leaves, which could influence the scattering of light [46]. The differences between red NDVI and red edge NDVI and their use as predictive tools have been studied in wheat [47], where it was found that red wavelength was more correlated to plant biomass. Numerous researchers have reported the differences between red NDVI and red edge NDVI in corn [20,48–55]. Generally, this research has found a weaker relationship with red NDVI and corn yield compared to earlier research with wheat. However, most of these studies did not include red edge NDVI. The red edge NDVI more closely relates to chlorophyll content than red NDVI [38]. The objective of this study was to determine the performance of red edge NDVI in yield prediction in corn compared to the yield prediction of red NDVI at early (V6) and later (V12) growth stages. The study also investigates the relative performance of two different red edge wavelengths through the use of two different ground-based active-optical sensors. The results of these experiments will be utilized to develop algorithms for the use of corn yield prediction with active-optical sensors for use in directing in-season N rates for corn. 2. Materials and Methods 2.1. Research Locations Fifteen sites on farmer cooperator fields were used for N rate trials on corn in eastern and western North Dakota in 2013 (Tables 1 and 2). The corn hybrid planted at each site was selected by the farmer and the site was planted at the same time as the rest of the field. The growers applied herbicides at their discretion but hand weeding was also carried where required. The experimental design was a randomized
Sensors 2015, 15
27835
complete block with four replications and six N treatments; 0, 45, 90, 134, 179 and 224 kg∙N∙ha−1 as ammonium nitrate, hand broadcast about a week before planting. Each experimental unit (plot) was 6.1-m long and 3.05-m wide. Locations were categorized into high clay conventional-till sites and medium-textured conventional-till sites, eastern long-term no-till (continuous no-till system for at least 6 consecutive years) and western long-term no-till. Table 1. GPS coordinates and soil series for field experiments in 2013. Location
GPS Coordinates
Soil Type †
Casselton
46°52′41.973′′ N, 97°14′55.894′′ W
Fine-silty, mixed, superactive, frigid Typic Endoaquolls
Durbin
46°51′22.072′′ N, 97°09′28.366′′ W
Fine, smectitic, frigid Typic Epiaquerts
Barney
46°15′07.560′′ N, 96°59′28.627′′ W
Coarse-loamy, mixed, superactive, frigid Aquic Pachic Hapludolls
Dwight
46°18′39.335′′ N, 96°47′12.237′′ W
Fine, smectitic, frigid Vertic Argialbolls
Gardner
47°10′28.482′′ N, 96°54′02.138′′ W
Fine, smectitic, frigid Typic Epiaquerts
Leonard-North
46°52′57.807′′ N, 97°17′44.945′′ W
Fine, smectitic, frigid Typic Epiaquerts
Walcott
46°30′02.359′′ N, 97°02′39.660′′ W
Coarse-loamy, mixed, superactive, frigid Aeric Calciaquolls
Leonard West
46°39′10.750′′ N, 97°18′12.980′′ W
Coarse-loamy, mixed, superactive, frigid Pachic Hapludolls
Arthur
47°06′50.963′′ N, 97°57′55.219′′ W
Coarse-silty, mixed, superactive, frigid Pachic Hapludolls
Rutland
45°57′50.176′′ N, 97°31′44.205′′ W
Fine, smectitic, frigid Pachic Vertic Argiudolls
Jamestown
46°45′58.571′′ N, 98°47′55.930′′ W
Fine-loamy, mixed, superactive, frigid Calcic Hapludolls
Mott
46°56′43.583′′ N, −102°19′10.919′′ W
Fine-loamy, mixed, superactive, frigid Typic Haplustolls
Richardton
46°35′0.095′′ N, −102°21′41.364′′ W
Fine-loamy, mixed, superactive, frigid Typic Haplustolls
Beach
46°49′3.0354′′ N, −103°59′40.451′′ W
Fine-silty, mixed, superactive, frigid Typic Haplustolls
New Leipzig
46°26′44.051′′ N, −101°56′31.379′′ W
Fine, smectitic, frigid Vertic Natrustolls
†
Information collected from Soil Survey Staff, 2013.
Table 2. Tillage system, planting date and date of the first and second sensing of each location in 2013. Locations
Soil/Tillage Category
Planting Date
V6
V6 GDD †
V12
V12 GDD †
Corn Variety
Casselton
High clay conventional-till
15/05/13
25/06/13
623
15/07/13
1095
P8640
Durbin
High clay conventional-till
15/05/13
25/06/13
623
15/07/13
1095
NA
Barney
High clay conventional-till
09/05/13
26/06/13
658
18/07/13
1227
P9917
Dwight
High clay conventional-till
16/05/13
26/06/13
605
09/07/13
898
DK 4837
Gardner
High clay conventional-till
10/05/13
25/06/13
581
10/07/13
1044
NutTech3A183
Leonard-North
High clay conventional-till
28/05/13
25/06/13
438
10/07/13
778
76R92
Walcott
Medium-textured conventional-till
18/05/13
02/07/13
700
18/07/13
1076
DeKalb 39-04
Leonard West Medium-textured conventional-till
10/05/13
02/07/13
651
12/07/13
1107
76R92
Arthur
Medium-textured conventional-till
15/05/13
20/06/13
516
10/07/13
979
Mycogen-2T222
Rutland
Eastern no-till
08/05/13
18/0613
524
09/07/13
1012
Mycogen 2G-161
Jamestown
Eastern no-till
11/05/13
18/0613
424
09/07/13
870
Croplan 229VT2RTB
Mott
Western no-till
19/05/13
01/07/13
593
17/07/13
911
P8107
Richardton
Western no-till
13/05/13
No sensing
-
17/07/13
517
P8107
Beach
Western no-till
15/05/13
01/07/13
498
17/07/13
804
Pioneer D-97
New Leipzig
Western clay no-till
07/05/13
01/07/13
662
17/07/13
980
P8954XR
†
GDD is growing degree days from planting to the date sensing at V6 or V12.
Sensors 2015, 15
27836
2.2. Soil Sampling and Analysis Five soil sample cores were taken from each site before planting and treatment application using a 2.5-cm diameter hand probe to a depth of 0–15 cm for phosphorous (P), potassium (K), zinc (Zn), pH, and organic matter analysis, and three soil cores from 0 to 60 cm were obtained for determination of residual nitrate-N (Table 3). If N in the field was applied as a blend by the farmer to the rest of the field, P and K were applied by the researchers so that farmer application did not confound the N rate trial. When fertilizer P and K needed to be applied by the researchers, the sources were mono ammonium phosphate (11-52-0) and potassium chloride (0-0-60), at rates consistent with soil test analysis and NDSU Extension guidelines [56]. If Zn was deficient, zinc sulfate (36% granules) at a rate of 11 kg∙ha−1 Zn was applied using a spinner spreader as a broadcast at the time of N treatment application. If any site was suspected to be S deficient due to sandy texture and high rainfall or snowmelt, 112 kg∙ha−1 of calcium sulfate (0-0-0-20S) was applied at the time of N application. When unanticipated S deficiency appeared later in the season due to higher rainfall, an application of calcium sulfate at 22 kg∙ha−1∙S (112 kg∙ha−1 gypsum) was applied as granules over the top of the corn. Soil pH was analyzed using a 1:1 soil: deionized H2O solution method [57]; P was determined by the Olsen method [58], K was assessed using the 1-N ammonium acetate method [59]. The DTPA extraction method [60] coupled with atomic absorption spectroscopy detection was used for determination of available Zn. Organic matter was measured using the loss following ignition method [61]. Table 3. Relevant soil analysis for experimental locations. Location Casselton Leonard North Durbin Arthur Leonard West Barney Walcott Dwight Rutland Jamestown Dwight Mott Richardton Beach New Leipzig
Depth cm 0–15 0–61 0–15 0–61 0–15 0–61 0–15 0–61 0–15 0–61 0–15 0–61 0–15 0–61 0–15 0–61 0–15 0–61 0–15 0–61 0–15 0–61 0–15 0–61 0–15 0–61 0–15 0–61 0–15 0–61
Nitrate
kg∙ha−1 21 55 6 15 6 45 6 12 7 12 24 91 13 29 35 26 20 54 10 12 12 72 18 10 11 9 17 7 23 18
P
K
Zn
---------mg kg−1--------7 370 0.37
Organic Matter % 5.4
pH 7.6
18
380
0.95
5.7
6.6
34
460
0.62
5.9
7.5
9
110
1.16
2.2
6.6
8
125
3.75
2.2
7.3
12
110
1.21
2.9
7.8
9
347
0.78
4.2
6.9
63
540
2.37
4
7.7
8
415
0.72
6.1
7
8
220
1.14
3.3
5.7
8
185
0.45
3.5
7.9
4
230
0.95
5.2
7.6
33
170
0.65
3.2
5.1
22
300
0.85
3
6.2
16
560
1.46
5.2
5.6
Sensors 2015, 15
27837
2.3. Sensor Description and Sensing Procedure The ground-based active-optical (GBAO) sensors use diodes to generate modular light pulses of particular wavelengths absorbed by plant tissues. Two handheld GBAO sensors were used for this study: GreenSeeker™ (GS; Trimble Navigation Limited, Sunnyvale, CA, USA) and the Holland Scientific Crop Circle™ A470 sensor (CC; Holland Scientific, Inc., Lincoln, NE, USA). The GS sensor measures incident and reflected light from plants at 660 ±15 nm (red) and 770 ±15 nm (NIR). In the GS, light is emitted from diodes in alternating bursts of different duration such that the visible source pulses for 1 ms and then the NIR diode source pulses for 1 ms at 40,000 Hz. Each burst from a given source amounts to about 40 pulses before pausing for the other diode to emit its radiation (another 40 pulses). The illuminated area is about 60 cm wide by 1 cm long, with the long dimension positioned perpendicular to the direction of travel. The field of view is approximately constant for heights between 60 and 120 cm above the canopy because of light collimation within the sensor. Outputs from the sensor are red NDVI and simple ratio (red/NIR). The CC sensor simultaneously emits three bands; two in the visible range (red 650 nm, red edge 730 nm) and one in the NIR (760 nm). The light source of the CC is a modulated polychromatic LED array. It can emit and measure light spectrums in the range from 430 nm to 850 nm band width (BW). The sensor has a measurement filter range including wavelengths of 450 nm (BW ± 20 nm), 550 nm (BW ±20 nm), 650 nm (BW ±20 nm), 670 nm (BW ±11 nm), 730 nm (BW ±10 nm) and 760 nm (LWP). The sensor was calibrated using software developed by Holland Scientific. Measurements can be collected at a rate of 2–20 readings per second, so each recorded value in a 20 foot length of plot, moving about 5 km∙hr−1 is the average of about 4000 readings. Outputs of the sensor are reflectance values that allow calculation of vegetation indices. The formula for red NDVI and red edge NDVI follows: 𝑁𝐼𝑅 − 𝑅𝑒𝑑 𝑁𝐼𝑅 + 𝑅𝑒𝑑 𝑁𝐼𝑅 − 𝑅𝑒𝑑 𝐸𝑑𝑔𝑒 𝑅𝑒𝑑 𝐸𝑑𝑔𝑒 𝑁𝐷𝑉𝐼 = 𝑁𝐼𝑅 + 𝑅𝑒𝑑 𝐸𝑑𝑔𝑒 𝑅𝑒𝑑 𝑁𝐷𝑉𝐼 =
(1) (2)
Wavelengths values used for GreenSeeker® and Holland Scientific Crop Circle Sensor® are defined below: GS emits four bands: red (660 nm), two red edge (710 nm and 735 nm), and near infrared (774 nm): NDVI = (NIR − Red)/(NIR + Red) (774 nm reading − 660 nm reading)/(774 nm + 660 nm) Or red edge NDVI (710 nm) (774 nm reading − 710 nm reading)/(774 nm + 710 nm) Or red edge (735 nm) (774 nm reading − 735 nm reading)/(774 nm + 735 nm) CC emits three bands: red (670 nm), red edge (730 nm), and near infrared (760 nm): NDVI = (NIR − Red)/(NIR + Red) (760 nm reading − 670 nm reading)/(760 nm + 670 nm) Or red edge NDVI (730 nm)
Sensors 2015, 15
27838
NDVI= (NIR − Red Edge)/(NIR + Red Edge) (760 nm reading − 730 nm reading)/(760nm + 730 nm) The sensing with GS and CC were conducted at the V6 growth stage and V12 growth stage. Sensor readings were obtained 50 cm over the top of the corn whorls from the middle row of each plot. All reflectance data (NDVI) were inserted within the generalized expression: NDVI = (NIR − red or red-edge)/(NIR + red or red-edge)
(3)
Within each experimental unit, 30–50 individual readings were obtained. The mean of GS and CC readings were calculated using in-house macro programs for Visual Basic within Excel [62]. To normalize NDVI over a range of sites where small differences in growth stage were found (i.e., V5.5 to V6.5) the normalizing factor of INSEY was used. The INSEY (in-season estimate of yield) [19] was calculated by dividing the NDVI with the growing degree days from planting date to date of sensing using the closest NDAWN data to each site [63]. Sensing was conducted by positioning the GS and CC at an approximate distance of 50 cm above the canopy, resulting in similar intensity of reflectance at each site and each growth stage reading [64]. 2.4. Harvesting and Statistical Analysis Harvest was conducted between 15 September and 15 October 2013. The sensed row of each experimental unit (plot) was hand harvested, leaving the outside ears at each end of the plot intact due to alleyway effect, taken from the field and then shelled using an Almaco® corn sheller (Almaco, Nevada, IA, USA). Grain moisture and test weight was determined on a subsample of shelled grain using a Dickey-John GAC500XT moisture-test weight instrument (Dickey-John, Auburn, IL, USA). Regression analyses were conducted on sensor readings converted to INSEY and yield with yield as the dependent variable and INSEY as the independent variable. The exponential regression model was superior to other possible regression models, so the regression relationships in Tables 4 and 5 are expressed from the exponential model for red and red edge generated data. Multiple regression analysis was used to determine whether the data should be segregated into long-term no-till sites, high clay conventional and, medium texture conventional sites. The analysis confirmed that segregation of the data into those categories improved the relationship between INSEY and yield [25]. The coefficient of determination (r2) value was used to evaluate the relationship of crop yield and sensor reading at V6 and V12. The SAS program for Windows V9.2 (SAS Institute, Cary, NC, USA), using the procedure PROC REG, was used to calculate the r2 and evaluate regression models of. SAS procedure GLM was used to compare the N treatments for treatment differences in yield and the INSEY calculated from five sensor wavelengths. A p-value of 5% probability was used to differentiate between treatment differences using the LSD derived from ANOVA. Coefficient of variation (CV) was also calculated from wavelength INSEY, and bar graphs were prepared to check the variation of red and red edge wavelength INSEY at V6 and V12. In addition, bar and line graphs between treatment and INSEY as well as wavelength and INSEY were also prepared to check the sensitivity and response of wavelength at different treatment levels as well to compare the wavelength peaks within their category.
Sensors 2015, 15
27839
Table 4. Exponential regression equations for Yield and INSEY for five wavelengths of two ground-based active-optical sensors under high clay (n = 143) and medium textured conventional-till (n = 71) sites at V6 and V12 corn growth stages. Corn Growth Stage
Sensor/Wavelength CC††/730 nm (red edge) CC/670 nm (red)
V6
GS/660 nm (red) GS/710 nm (red edge) GS/735 nm (red edge) CC/730 nm (red edge) CC/670 nm (red)
V12
GS/660 nm (red) GS/710 nm (red edge) GS/735 nm (red edge)
Regression Equation and r2 High Clay Soils y = 6709.78e1052.3x r2 = 0.20 y = 6915.99e427.26x r2 = 0.17 y = 7816.47e267.19x r2 = 0.06 y = 7722.99e600.1x r2 = 0.07 y = 7437.18e2398.2x r2 = 0.08 y = 4492.97e2002.9x r2 = 0.18 y = 3736.41e1273.9x r2 = 0.18 y = 3650.33e1324.7x r2 = 0.20 y = 6139.93e999.23x r2 = 0.06 y = 7078.74e2065.4x r2 = 0.04
Sig † * * NS NS NS * * * NS NS
Regression Equation and r2 Medium Textured Soils y = 6351.09e2807x r2 = 0.40 y = 5787.54e1503.4x r2 = 0.42 y = 5312.75e1452.4x r2 = 0.39 y = 5893.79e2693.3x r2 = 0.41 y = 5747.19e9351.6x r2 = 0.33 y = 2111.65e4626.1x r2 = 0.58 y = 1423.68e2914.9x r2 = 0.47 y = 995.97e3431.9x r2 = 0.47 y = 1511.98e49°5.3x r2 = 0.55 y = 3583.75e8914.5x r2 = 0.49
Sig † *** *** ** *** ** *** *** *** *** ***
†
NS denotes non-significance at p < 0.05; *** denotes significance at 0.001; ** denotes significance at 0.01; * denotes significance at 0.05; †† CC is Holland Crop Circle™ and GS is GreenSeeker™.
Table 5. Exponential regression equations of Yield and INSEY from five wavelengths of two ground-based active-optical sensors in eastern North Dakota (n = 47) and western North Dakota no-till (n = 95) systems at V6 and V12 growth stages of corn. Corn Growth Stage
††
Sensor/Wavelength
CC/730 nm (red edge) CC/670 nm (red) V6
GS/660 nm (red) GS/710 nm (red edge) GS/735 nm (red edge) CC/730 nm (red edge) CC/670 nm (red)
V12
GS/660 nm (red) GS/710 nm (red edge) GS/735 nm (red edge)
†
Regression Equations and r2 for Eastern ND Long-Term No-till Sites y = 7525.95e456.92x r2 = 0.00 y = 10096.92e−604.5x r2 = 0.01 y = 15252.57e−1310x r2 = 0.06 y = 10362.54e−1101x r2 = 0.02 y = 9581.11e−2145x r2 = 0.01 y = 794.96e5744.7x r2 = 0.39 y = 2474.80e1555.3x r2 = 0.06 y = 3591.15e1088.3x r2 = 0.02 y = 1663.77e3531.2x r2 = 0.18 y = 1733.03e10841x r2 = 0.36
Sig
†
NS NS NS NS NS * NS NS * *
Regression Equations and r2 for Western ND Long-Term No-Till Sites y = 4464.06e3529.3x r2 = 0.32 y = 3700.77e2211.2x r2 = 0.38 y = 3331.57e1775.7x r2 = 0.39 y = 3805e3245.8x r2 = 0.37 y = 3687.96e10657x r2 = 0.36 y = 4564.26e1201.1x r2 = 0.34 y = 4479.52e650.89x r2 = 0.29 y = 5005.42e434.32x r2 = 0.20 y = 5079.39e759.99x r2 = 0.23 y = 5262.99e2122.4x r2 = 0.19
NS denotes non-significance at p < 0.05; * denotes significance at 0.05; ** denotes significance at 0.01; *** denotes significance at 0.001; †† CC is Holland Crop Circle™ and GS is GreenSeeker™.
Sig † ** *** ** ** ** ** * * * *
Sensors 2015, 15
27840
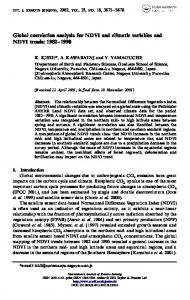
3. Results 3.1. Regression Analysis The exponential relationships between INSEY and yield at V6 and V12 stages of corn where five wavelengths were used to compare the coefficient of determination (r2) between corn yield and sensor reading are provided in Table 4. The exponential relationships were roughly linear, but the r2 values from the exponential models were nearly always superior to that of the linear model. In high clay sites at V6 using the CC, the red edge NDVI-based INSEY was significantly related to yield whereas both GS red edge NDVI-based INSEY was unrelated to yield. At V12 CC red NDVI, CC red edge NDVI, and GS red NDVI based INSEY were related to yield, while both wavelengths of GS red edge NDVI were not. In medium textured sites, the INSEY derived from wavelengths of both active-sensors at both growth stages were significantly related to yield (Table 4). In eastern North Dakota (ND) long-term no-till sites, there were no INSEY relationships between yield and sensor readings at V6 (Table 5). In western ND long-term no-till sites, there were significant relationships between INSEY and yield using both sensors and all wavelengths at V6 (Table 5). In previous research, there was no clear trend in the effect of crop residues on wavelength absorption and reflectance compared to soil; residue coverage of the soil can vary, with the effect of residue coverage influenced by residue moisture content and the origin of residue [65–67]. More consistent identification and quantification of residue appears to be only possible using bands in wavelengths greater than 1110 nm. It is noteworthy that eastern no-till sites tended to have denser residue cover, partially due to the tendency of eastern site cooperators to utilize more fall cover crops, and the tendency at some eastern sites to follow small grain with corn, whereas western sites tended to follow a lower residue crop. At V12 in western ND there were no INSEY relationships with yield in eastern ND sites using red NDVI or red edge NDVI. Using red edge NDVI, the relationship between INSEY and yield was significant at eastern ND long-term no-till sites. At V12 in eastern ND, the relationships between INSEY and yield were significant with both sensors and all wavelengths. The r2 values in eastern ND for V12 tended to be less than those at V6. 3.2. Wavelength Sensitivity and Absorption Spectra The N rate treatments resulted in significant yield differences, with increased yield as N rate increased in eastern ND high clay conventional-till sites (Figure 1a) and eastern ND medium textured conventional-till sites (Figure 1b). There were no yield responses due to N rate at eastern ND no-till sites (Figure 1c) or western ND no-till sites (Figure 1d). The INSEY varied similarly to yield. In Figure 2a,c, and Table 6, with yield and INSEY at eastern ND high clay sites, yield response and INSEY response to N rate were similar. The sensitivity, which is the ability of a measurement to relate to an outcome, was greater for the INSEY developed from red wavelengths of the GS (660) and CC (670) compared to red edge INSEYs (Figure 2b, d, Table 6), meaning that the separation of INSEY values with N rate was greater for INSEY developed under the red wavelengths than those developed under red-edge. At V6, although there appears to be a similar response of 710 nm and 730 nm (Figure 2a) wavelengths with N rates the INSEY relationship using the 710 nm red edge NDVI was not significant, while the red edge INSEY relationship using 730 nm was significant (Table 4). At V12, the sensitivity of both the 710 nm
Sensors 2015, 15
27841
and 730 nm derived INSEY was similar (Figure 2b) and the relationship to yield was also similar (Tables 4 and 6). The INSEY values at high clay sites increased from V6 to V12, which is commonly observed due to greater biomass with growth (Figure 2a,b). The absorption spectrum trends of INSEY with wavelength at three different N rates were similar at V6 and V12 (Figure 2b,d). (a)
Figure 1. Corn yield difference in response to N fertilizer rates under high clay conventional-till (a); medium textured conventional-till (b); eastern ND no-till (c); and western ND no-till (d) sites. Bars with different letters indicate significance at p < 0.05. Bars represent the range of yields within each N rate.
Figure 2. Cont.
Sensors 2015, 15
27842
Figure 2. Variation of INSEY for corn at high clay conventional-till sites calculated from CC active-sensor spectra (670 nm and 730 nm) and GS spectra (660 nm, 710 nm and 735 nm) with N rate compared to yield variation with N rate at V6 (upper left) and V12 (lower left). Trend for INSEY at three N rates (control, 134∙kg∙ha−1 and 224∙kg∙ha−1) over the five wavelengths represented as a continuous spectrum is displayed at V6 in figures at (upper right) and at V12 in (lower right). Table 6. Treatment differences between INSEY developed from five wavelengths utilizing two ground-based active-optical sensors in eastern high clay (n = 143) and eastern medium-textured (n = 71) categories under conventional tillage at two corn growth stages from nitrogen rate treatments. Soil Type/
Growth
N Treatment
Tillage System
Stage
kg·N·ha−1
V6
High Clay
V12
V6
Medium- textured
V12
†
INSEY † X 10,000 Holland Crop Circle
GreenSeeker
Red Edge 730 *
Red 670
Red 660
Red Edge 710
Red Edge 735
0
0.000249 b
0.000572 a
0.000519 a
0.000244 a
0.000078 a
45
0.000275 ab
0.000623 a
0.000564 a
0.000265 a
0.000082 a
90
0.000311 ab
0.000694 a
0.000618 a
0.000296 a
0.000088 a
135
0.000293 ab
0.000636 a
0.000571 a
0.000277 a
0.000085 a
179
0.000315 a
0.000685 a
0.000598 a
0.000291 a
0.000089 a
224
0.000310 ab
0.000682 a
0.000605 a
0.000295 a
0.000090 a
0
0.000311 d
0.000650 c
0.000647 b
0.000362 b
0.000110 c
45
0.000338 cd
0.000684 bc
0.000668 b
0.000378 b
0.000114 c 0.000122 bc
90
0.000350 bc
0.000703 ab
0.000694 ab
0.000393 ab
135
0.000365 abc
0.000711 ab
0.000693 ab
0.000397 ab
0.000120 c
179
0.000376 ab
0.000720 ab
0.000720 a
0.000423 a
0.000135 ab
224
0.000382 a
0.000737 a
0.000727 a
0.000426 a
0.000137 a
0
0.000160 a
0.000360 a
0.000423 a
0.000190 a
0.000062 a
45
0.000164 a
0.000365 a
0.000452 a
0.000206 a
0.000063 a
90
0.000190 a
0.000426 a
0.000502 a
0.000225 a
0.000065 a
135
0.000186 a
0.000399 a
0.000483 a
0.000223 a
0.000066 a
179
0.000212 a
0.000460 a
0.000515 a
0.000242 a
0.000072 a
224
0.000196 a
0.000429 a
0.000503 a
0.000235 a
0.000069 a
0
0.000306 c
0.000646 b
0.000651 b
0.000359 c
0.000104 c
45
0.000337 bc
0.000675 ab
0.00068 ab
0.000388 bc
0.000114 bc
90
0.000357 ab
0.000702 a
0.000706 a
0.000406 ab
0.000126 ab
135
0.000362 ab
0.000704 a
0.000696 ab
0.000403 ab
0.000125 ab
179
0.000374 a
0.000713 a
0.000711 a
0.00042 a
0.000135 a
224
0.000365 ab
0.000704 a
0.000701 a
0.000414 ab
0.00013 a
INSEY is the sensor reading divided by growing degree days from planting date; * Wavelength in nm.
Sensors 2015, 15
27843
In eastern ND medium textured sites (Figure 3a–d), wavelength sensitivity of active-optical sensor INSEY to yield was similar at V6 (Figure 3a) and V12 (Figure 3c) with sensitivity greater with red NDVI derived INSEY ranges at V6 and V12. At V6 and V12, the sensitivity of red NDVI INSEY in both sensors to N rates was similar and both were similarly related to yield at both growth stages (Table 4). The trend for greater INSEY with N rate was less clear at V6 (Table 6). At V6, there were no significant relationships between INSEY and yield for all wavelengths. At V12, the relationships between INSEY and yield were significant for all wavelengths. Yield is influenced by factors other than N rate [68–71], which is why an N non-limiting area should be established within a field where active-optical sensors will be used to help determine in-season supplemental N fertilization [72].
Figure 3. Variation of INSEY for corn at medium-textured conventional-till sites calculated from CC active-sensor spectra (670 nm and 730 nm) and GS spectra (660 nm, 710 nm and 735 nm) with N rate compared to yield variation with N rate at V6 (upper left) and V12 (lower left). Trend for INSEY at three N rates (control, 134 kg∙ha−1 and 224 kg∙ha−1) over the five wavelengths represented as a continuous spectrum is displayed at V6 (upper right) and at V12 (lower right). In eastern ND no-till sites, yield did not increase with N rate. At V6, there was no relationship between INSEY and yield (Table 5) or INSEY or N rate (Table 7). Yield trends depicted in Figure 4a,c are not significant. At V12, the r2 between CC 730 nm NDVI derived INSEY and yield and the GS 735 nm NDVI derived INSEY and yield were significant. The INSEY from all wavelengths of both sensors at V12 was also related to N rate (Table 7).
Sensors 2015, 15
27844
Table 7. Treatment differences between INSEY developed from five wavelengths utilizing two ground-based active-optical sensors in eastern North Dakota (ND) (n = 47) and western ND no-till (n = 95) systems at two corn growth stages from nitrogen rate treatments. Soil Category
Growth Stage
V6
Eastern ND
V12
V6
Western ND
V12
†
N Treatment kg·N·ha−1
INSEY † X 10,000 Holland Crop Circle
GreenSeeker
Red Edge 730
Red 670
Red 660
Red Edge 710
Red Edge 735
0
1.65 a
3.65 a
4.83 a
2.28 a
0.83 a
45
1.72 a
3.73 a
5.03 a
2.35 a
0.83 a
90
1.52 a
3.46 a
4.67 a
2.12 a
0.76 a
135
1.70 a
3.72 a
4.85 a
2.23 a
0.76 a
179
1.58 a
3.52a
4.65 a
2.09 a
0.73 a
224
1.65 a
3.66 a
4.89 a
2.28 a
0.76 a
0
3.74 c
7.31 b
7.22 b
4.21 b
1.29 c
45
3.97 bc
7.57 ab
7.38 ab
4.37 ab
1.36 bc 1.42 abc
90
3.99 bc
7.61 ab
7.55 ab
4.52 ab
135
4.09 ab
7.60 ab
7.52 ab
4.54 ab
1.47 ab
179
4.16 ab
7.74 ab
7.55 ab
4.54 ab
1.46 abc
224
4.31 a
7.96 a
7.70 a
4.73 a
1.54 a
0
9.45 a
2.35 a
3.53 a
1.51 a
4.88 a
45
9.07 a
2.26 a
3.33 a
1.41 a
4.74 a
90
1.15 a
2.69 a
3.85 a
1.68 a
5.40 a
135
1.09 a
2.56 a
3.92 a
1.74 a
5.68 a
179
1.14 a
2.73 a
3.98 a
1.79 a
5.63 a
224
1.08 a
2.58 a
3.83 a
1.69 a
5.40 a
0
2.85 a
5.61 a
6.27 a
3.30 a
1.01 a
45
2.85 a
5.58 a
6.12 a
3.26 a
1.00a
90
3.33 a
6.48 a
6.70 a
3.64 a
1.12 a
135
3.19 a
6.16 a
6.56 a
3.61 a
1.14 a
179
3.36 a
6.45 a
6.87 a
3.80 a
1.20 a
224
3.10 a
5.92 a
6.40 a
3.47 a
1.08 a
INSEY is the sensor reading divided by growing degree days from planting date.
Figure 4. Cont.
Sensors 2015, 15
27845
Figure 4. Variation of INSEY for corn at eastern no-till sites calculated from CC active-sensor spectra (670 and 730 nm) and GS spectra (660, 710 and 735 nm) with N rate compared to yield variation with N rate at V6 (upper left) and V12 (lower left). Trend for INSEY at three N rates (control, 134 kg·ha−1 and 224 kg·ha−1) over the five wavelengths represented as a continuous spectrum is displayed at V6 (upper right) and at V12 (lower right). At western ND no-till sites, there was no response to N. However, there were significant relationships between all wavelengths of both sensors and yield (Table 4), and N rate at V12 (Table 7). The sensitivity of INSEY to yield was low at V6 and V12 in western ND no-till sites. The lack of relationship was particularly evident at the lower N rates (Figure 5).
Figure 5. Variation of INSEY for corn at western ND no-till sites calculated from CC active-sensor spectra (670 and 730 nm) and GS spectra (660, 710 and 735 nm) with N rate compared to yield variation with N rate at V6 (upper left) and V12 (lower left). Trend for INSEY at three N rates (control, 134 kg·ha−1 and 224 kg·ha−1) over the five wavelengths represented as a continuous spectrum is displayed at V6 (upper right) and at V12 (lower right).
Sensors 2015, 15
27846
3.3. Coefficient of Variation among Treatments During early growth stages, the leaf surface area obtained from NADIR-aimed imagery is small, therefore most sensor reflectance comes from the soil surface. Variations in residue cover and type as well as other surface soil and early plant size variation due to uneven emergence probably contributed to the high coefficient of variation (CV) values with red NDVI- and red edge NDVI-based INSEY under all soil and tillage system categories (Figure 6a–d). The CVs at V12 were generally less than those at V6 for all categories except at western no-till sites. The CVs for the control (zero-N) treatments were larger than other treatments. The CVs were particularly large in western no-till control plots, which may be one reason why there was no statistical response to N at these sites. In previous research, the N response in long-term no-till fields was low, presumably due to greater efficiency of N utilization in long-term no-till systems in North Dakota [70]. Future work will explore methods to filter out residue effects from crop growth crop canopy NDVI measurements.
Figure 6. Percent CV (coefficient of variation) calculated from INSEY derived from sensor red or red edge NDVI in response to N rate under high clay conventional-till (upper left); medium textured conventional-till (upper right); eastern ND no-till (lower left); and western ND no-till (lower right) sites at V6 and V12 corn growth stages. 4. Discussion It was necessary to segregate different soils and tillage categories to help explain relational differences in this study [25]. At eastern ND high clay sites, the red NDVI- and red edge NDVI- based INSEY were similar in their prediction of yield at V6 and V12. However, although red or red edge sensors could be used to estimate corn yield at V6 or V12, there are some fundamental differences in their modes of
Sensors 2015, 15
27847
action. Red-based sensors are useful at early (V6) growth stages due to their reliance on the proportion of soil covered with leaves for measurement differences. The red edge-based sensors do not respond to leaf area differences, and measure differences in leaf color, “tint”, which is highly related to chlorophyll content. Therefore, we found that the red edge NDVI-based INSEY was predictive at V6 and V12 stages consistently at our sites. Similar results were being reported where red- and red edge-based sensors were compared at V6 [71]. Algorithms for use in directing in-season N application for corn have been developed [34] using two different wavelength ranges from two different sensors (GreenSeeker and Crop Circle ACS-210). Several N rate algorithms using red and red edge wavelengths in corn have been developed [69]; however, algorithms are only available for sensor wavelength and growth stage that have yield predictive capabilities. The weakness of the red wavelength to estimate yield at V12 stage was due to the saturation effect. Several studies have suggested early (V6) sensing and N application in corn [34,71–73] to alleviate N deficiencies; however, the relationship between yield and INSEY tends to increase when the crop is sensed at later growing stages, especially using red edge NDVI-based INSEY [71]. In addition, N status of a crop is not only related to leaves, but N content of stems as well [74]. A “vertical footprint” of sensor measurements was used to characterize N uptake in corn [75]. While this approach is not currently practical in commercial corn production, it emphasized that use of an over-canopy optical sensor has limitations for N status prediction simply because it is only using the upper leaf canopy for its assessment. The problem associated with low yield predictability using the red NDVI-based INSEY once corn leaves cover the row, as at V12, is due to the difficulty in sensor ability to distinguish differences in plant health because reflection differences are small, even though to an observer clear differences in yellow to green tints are evident [76]. Similar results were reported [24] where low sensitivity of corn to the red wavelengths at V12 stage was recorded. Not only was a better relationship of red edge measurements to N rate found, but also a higher correlation of chlorophyll content with advances in growth stage. Differences in the INSEY and yield relationships between high clay and medium texture soils were probably due to high rainfall in May and early June through V6. Rainfall was more than 10 cm above normal rainfall from planting through V6 [63]. In high clay soils, small pore saturation with water results in denitrification [77,78]. At the high clay sites, yields increased to the 224 kg∙ha−1 rate whereas medium textured sites seldom responded to N rates greater than 179 kg∙ha−1 although they obtained greater yields than high clay sites. The tendency for medium textured soils to drain better compared to high clay soils aided their greater N use efficiency, while apparently not leaching N excessively. The relationships found in this study were specific to the wavelengths and the instrument used to generate the data. Crop Circle red NDVI-based INSEY regression equations were different than GS red NDVI-based INSEY relationships for example. This study is not the first conclude that relationships are defined by the instrument and wavelength used [78]. In addition, release of algorithms for yield prediction and use in directing in-season N application to any crop is not recommended with a one-year data base. Multiple years and environments would be necessary to recommend any active-optical sensor algorithm, and they must be specific to the instrument and wavelengths utilized in developing the algorithm. However, this study showed that the red NDVI-based or red edge NDVI-based INSEY data from either instrument could be used at V6 to develop a yield prediction-based in-season N rate algorithm for corn, and the red edge NDVI-based INSEY from the Crop Circle, or the GreenSeeker
Sensors 2015, 15
27848
using the 710 nm wavelength, could be used to develop a yield prediction-based in-season N rate algorithm for corn at V12. These results were generated from 15 sites across a geography of over 500 km in longitude and 150 km in latitude in North Dakota, spanning conventional tilled and long-term no-till sites and sites with high clay as well as those with lower clay content. Environmental conditions were different at each site with respect to rainfall and its distribution. Each site was seeded to a different hybrid. The yields within the study ranged from about 6000 kg∙ha−1 to about 12,000 kg∙ha−1, which spans the range of average yield of all major corn growing US states [79]. The diversity of conditions of these experiments and the similar response between sites of similar soil and tillage strongly suggest that these results would be expected to be replicated by anyone conducting a similar study on corn using these instruments. 5. Conclusions Corn yield prediction using the GS red NDVI INSEY and CC red NDVI INSEY were similar. The red NDVI-based INSEY and red edge NDVI-based INSEY were similar in yield prediction at V6. At V12, the red edge NDVI-based INSEY provided consistently greater r2 values when predicting yield. Long-term no-till sites gave inconsistent INSEY measurements at V6, presumably due to ground residue cover. The r2 values of the relationships of INSEY and yield in all soil and tillage categories were superior at V12 compared to the V6 growth stage. Within the red edge spectrum of the GS sensor, the 710 nm wavelength was superior at corn yield prediction compared to 735 nm. Acknowledgments Thanks to the North Dakota Corn Council and the US-NSF for their financial support of our research. Author Contributions Lakesh Sharma helped establish experiments, led the field crew, helped operate the sensors, aided in harvest and wrote the first draft of this manuscript. Honggang Bu helped establish the experiments, helped operate the sensors and aided in harvest. Anne Denton provided partial funding of the experiments and aided in data analysis. David Franzen helped secure funding for the experiments, helped establish experiments, directed field crew operations, aided in harvest and finished writing and editing the manuscript. Conflicts of Interest The authors declare no conflict of interest. References 1.
Franzen, D.W.; Cihacek, L.J.; Hofman, V.L.; Swenson, L.J. Topography-based sampling compared with grid sampling in the Northern Great Plains. J. Prod. Agric. 1998, 11, 364–370.
Sensors 2015, 15 2.
3. 4. 5. 6. 7. 8. 9. 10. 11. 12. 13. 14. 15. 16. 17. 18.
19.
20.
27849
Schröder, J.J.; Neeteson, J.J.; Oenema, O.; Struik, P.C. Does the crop or the soil indicate how to save nitrogen in maize production? Reviewing the state of the art. Field Crops Res. 2000, 66, 277–278. Dobermann, A.; Cassman, K.G. Plant nutrient management for enhanced productivity in intensive grain production systems of the United States and Asia. Plant Soil 2002, 247, 153–175. Ulrich, A. Physiological bases for assessing the nutritional requirements of plants. Ann. Rev. Plant Physiol. 1952, 3, 207–228. Fox, R.H.; Kern, J.M.; Piekielek, W.P. Nitrogen fertilizer source and method and time of application effects on no-till corn yields and N uptakes. Agron. J. 1986, 78, 741–746. Maddux, L.D.; Kissel, D.E.; Barnes, P.L. Effects of nitrogen placement and application on irrigated corn. J. Fert. 1984, 1, 86–89. Mengel, D.B.; Nelson, D.W.; Huber, D.M. Placements of nitrogen fertilizers for no-till and conventional till corn. Agron. J. 1982, 74, 515–518. Bandel, V.A.; Dzienia, S.; Stanford, G. Comparison of N fertilizers for no-till sites corn. Agron. J. 1980, 72, 337–341. Chen, J.M.; Cihlar, J. Retrieving leaf area index of boreal conifer forests using Landsat TM images. Remote Sens. Environ. 1995, 55, 153–162. Curran, P.J. Multispectral remote sensing for the estimation of green leaf area index. Philos. Trans. Roy. Soc. Lond. 1983, 309, 257–270. Jordan, C.F. Derivation of leaf area index from quality of light in the forest floor. Ecology 1969, 50, 663–666. Myneni, R.B.; Nemani, R.R.; Running, S.W. Estimation of global leaf area and absorbed PAR using radiative transfer models. IEEE Trans. Geosci. Remote Sens. 1997, 35, 1380–1393. Wiegand, C.L.; Richardson, A.J.; Kanemasu, E.T. Leaf area index estimates for wheat from Landsat and their implications for evapotranspiration and crop modeling. Agron. J. 1979, 71, 336–342. Schepers, J.S.; Francis, D.D.; Vigil, M.; Below, F.E. Comparison of corn leaf nitrogen concentration and chlorophyll meter readings. Commun. Soil Sci. Plan. 1992, 23, 2173–2187. Gitelson, A.A.; Merzlyak, M.N. Remote estimation of chlorophyll content in higher plant leaves. Int. J. Remote Sens. 1997, 18, 2691–2697. Ciganda, V.; Gitelson, A.A.; Schepers, J.S. Non-destructive determination of corn leaf canopy chlorophyll content. J. Plant Physiol. 2009, 166, 157–167. Carter, G.A.; Knapp, A.K. Leaf optical properties in higher plants: Linking spectral characteristics to stress and chlorophyll concentration. Am. J. Bot. 2001, 88, 677–684. Zhao, D.; Reddy, K.R.; Kakani, V.G.; Read, J.J.; Carter, G.A. Corn (Zea mays L.) growth, leaf pigment concentrations, photosynthesis, and leaf hyperspectral reflectance properties as affected by nitrogen supply. Plant Soil 2003, 257, 205–217. Raun, W.R.; Solie, J.B.; Johnson, G.V.; Stone, M.L.; Lukina, E.V.; Thomason, W.E.; Schepers, J.S. In-season prediction of potential grain yield in winter wheat using canopy reflectance. Agron. J. 2001, 93, 131–138. Raun, W.R.; Solie, J.B.; Johnson, G.V.; Stone, M.L.; Mullen, R.W.; Freeman, K.W.; Thomason, W.E.; Lukina, E.V. Improving nitrogen use efficiency in cereal grain production with optical sensing and variable rate application. Agron. J. 2002, 94, 815–820.
Sensors 2015, 15
27850
21. Franzen, D.W.; Sharma, L.K.; Bu, H. Active Optical Sensor Algorithms for Corn Yield Prediction and a Corn Side-dress Nitrogen Rate Aid. NDSU extension publication SF1176-5, 2014. Available online: http://www.ag.ndsu.edu/pubs/plantsci/soilfert/sf1176-5.pdf (accessed on 15 August 2015). 22. Tucker, C.J. Red and photographic infrared linear combinations for monitoring vegetation. Remote Sens. Environ. 1979, 8, 127–150. 23. Raun, W.R.; Solie, J.B.; Taylor, R.K.; Arnall, B.J.; Mack, C.J.; Edmonds, D.E. Ramp calibration strip technology for determining midseason nitrogen rates in corn and wheat. Agron. J. 2008, 100, 1088–1093. 24. Holland, K.H.; Schepers, J.S. Derivation of a variable rate nitrogen application model for in-season fertilization of corn. Agron. J. 2010, 102, 1415–1424. 25. Sharma, L.K.; Franzen, D.W. Use of corn height to improve the relationship between active optical sensor readings and yield estimates. Precis. Agric. 2013, doi:10.1007/s11119-013-9330-9. 26. Penuelas, J.; Filella, I. Visible and near-infrared reflectance techniques for diagnosing plant physiological status. Trends Plant Sci. 1998, 3, 151–156. 27. Wood, G.A.; Taylor, J.C.; Godwin, R.J. Calibration methodology for mapping within-field crop variability using remote sensing. Biosyst. Eng. 2003, 84, 409–423. 28. Slaton, M.R.; Hunt, E.R.; Smith, W.K. Estimating near-infrared leaf reflectance from leaf structural characteristics. Am. J. Bot. 2001, 88, 278–284. 29. Gausman, H.W. Leaf reflectance of near-infrared. Photogramm. Eng. Remote Sens. 1974, 40, 183–191. 30. Gausman, H.W. Reflectance of leaf components. Remote Sens. Environ. 1977, 6, 1–9. 31. Blackmer, T.M.; Schepers, J.S.; Varvel, G.E.; Walter-Shea, E.A. Nitrogen deficiency detection using reflected shortwave radiation from irrigated corn canopies. Agron. J. 1996, 88, 1–5. 32. Stone, M.L.; Solie, J.B.; Raun, W.R.; Whitney, R.W.; Taylor, S.L.; Ringer, J.D. Use of spectral radiance for correcting in season fertilizer nitrogen deficiencies in winter wheat. Trans. Am. Soc. Agric. Eng. 1996, 39, 1623–1631. 33. Osborne, S.L.; Schepers, J.S.; Francis, D.D.; Schlemmer, M.R. Use of spectral radiance to estimate in-season biomass and grain yield in nitrogen and water stressed corn. Crop Sci. 2002, 42, 165–171. 34. Kitchen, N. Variable-Rate nitrogen fertilizer application in corn using in-field sensing of leaves or canopy. In Agronomy Technical Note MO-35; USDA: Columbia, MO, USA, 2006. 35. Martin, K.L.; Girma, K.; Freeman, K.W.; Teal, R.K.; Tubana, B.; Arnall, D.B.; Chung, B.; Walsh, O.; Solie, J.B.; Stone, M.L.; et al. Expression of variability in corn as influenced by growth stage using optical sensor measurements. Agron. J. 2007, 99, 384–389. 36. Filella, I.; Penuelas, J. The red edge position and shape as indicators of plant chlorophyll content, biomass and hydric status. Int. J. Remote Sens. 1994, 7, 1459–1470. 37. Thomas, J.R.; Gausman, H.W. Leaf reflectance versus leaf chlorophyll and carotenoid concentrations for eight crops. Agron. J. 1977, 69, 799–802. 38. Townshend, J.; Justice, C.; Li, W.; Gurney, C.; McManus, J. Global land cover classification by remote sensing: Present capabilities and future possibilities. Remote Sens. Environ. 1991, 35, 243–255. 39. Horler, D.N.H.; Dockray, M.; Barber, J. The red-edge of plant leaf reflectance. Int. J. Remote Sens. 1983, 4, 273–288.
Sensors 2015, 15
27851
40. Demetriades-Shah, T.H.; Steven, M.D. High resolution spectral indices for monitoring crop growth and chlorosis. In Proceedings of the 4th International Colloquium on Spectral Signatures of Objects in Remote Sensing, Aussois, France, 18–22 January 1988. 41. Curran, P.J.; Dungan, J.L.; Gholz, H.L. Exploring the relationship between reflectance red edge and chlorophyll content in slash pine. Tree Physiol. 1990, 7, 33–48. 42. Boochs, F.; Kupefer, G.; Dockter, K.; Kubauch, W. Shape of the red edge as vitality indicator for plants. Int. J. Remote Sens. 1990, 11, 1741–1753. 43. Jackson, R.D.; Slater, P.N.; Pinter, P.J., Jr. Discrimination of growth and water stress in wheat by various vegetation indices through clear and turbid atmospheres. Remote Sens. Environ. 1983, 13, 187–208. 44. Hagger, R.J.; Stent, C.J.; Rose, J. Measuring spectral differences in vegetation canopy by a reflectance ratio meter. Weeds Res. 1984, 24, 59–65. 45. Kleman, J.; Fagerland, E. Influence of different nitrogen and irrigation treatments on the spectral reflectance of barley. Remote Sens. Environ. 1987, 21, 1–14. 46. Gausman, H.W.; Allen, W.A.; Escobar, D.E.; Rodriguez, R.R.; Cardenas, R. Age effects of cotton leaves on light reflectance, transmittance and absorbance and on water content and thickness. Agron. J. 1971, 63, 465–469. 47. Knipling, E.B. Physical and physiological basis for the reflectance of visible and near infrared radiation from vegetation. Remote Sens. Environ. 1970, 1, 155–159. 48. Moges, S.M.; Mullen, W.R.R.R.W.; Freeman, K.W.; Johnson, G.V.; Solie, J.B. Evaluation of green, red, and near infrared bands for predicting winter wheat biomass, nitrogen uptake, and final grain yield. J. Plant Nutr. 2004, 27, 1431–1441. 49. Schepers, J.S.; Blackmer, T.M.; Francis, D.D. Predicting N fertilizer needs for corn in humid regions: Using chlorophyll meters. In Predicting N Fertilizer Needs for Corn in Humid Regions. Bull. Y-226; Bock, B.R., Kelley, K.R., Eds.; National Fertilizer and Environmental Research Center: Muscle Shoals, AL, USA, 1992; pp. 105–114. 50. Varvel, G.E.; Schepers, J.S.; Francis, D.D. Ability for in-season correction of nitrogen deficiency in corn using chlorophyll meters. Soil Sci. Soc. Am. J. 1997, 59, 1233–1239. 51. Bullock, D.G.; Anderson, D.S. Evaluation of the Minolta SPAD-502 chlorophyll meter for nitrogen management in corn. J. Plant Nutr. 1998, 21, 741–755. 52. Shapiro, C.A. Using a chlorophyll meter to manage nitrogen applications to corn with high nitrate irrigation water. Commun. Soil Sci. Plan 1999, 30, 1037–1049. 53. Shanahan, J.F.; Schepers, J.S.; Francis, D.D.; Varvel, G.E.; Wilhelm, W.W.; Tringe, J.M.; Schlemmer, M.S.; Major, D.J. Use of remote sensing imagery to estimate corn grain yield. Agron. J. 2001, 93, 583–589. 54. Scharf, P.C.; Brouder, S.M.; Hoeft, R.G. Chlorophyll meter readings can predict nitrogen need and yield response of corn in the north-central USA. Agron. J. 2006, 98, 655–665. 55. Kitchen, N.R.; Sudduth, K.A.; Drummond, S.T.; Scharf, P.C.; Palm, H.L.; Roberts, D.F.; Vories, E.D. Ground-based canopy reflectance sensing for variable-rate nitrogen corn fertilization. Agron. J. 2010, 102, 71–84.
Sensors 2015, 15
27852
56. Shaver, T.M.; Khosla, R.; Westfall, D.G. Evaluation of two ground-based active crop canopy sensors in corn: Growth stage, row spacing, and sensor movement speed. Soil Sci. Soc. Am. J. 2010, 74, 2101–2108. 57. Franzen, D.W. North dakota fertilizer recommendation tables and equations. Available online: https://www.ndsu.edu/fileadmin/soils/pdfs/sf882.pdf (accessed on 15 August 2015). 58. Peters, J.; Nathan, M.; Laboski, C. pH and lime requirement, Chapter 4. In Recommended Soil Test Chemical Procedures for the North Central Region. NCERA-13, 2012. Available online: http://extension.missouri.edu/explorepdf/specialb/sb1001.pdf (accessed on 15 August 2015). 59. Frank, K.; Beegle, D.; Denning, J. 1998. Phosphorus. Chapter 8. In Chemical Soil Test Procedures for the North Central Region. Missouri Agr. Exp. Sta. SB-1001, Revised August, 2015. Available online: http://extension.missouri.edu/explorepdf/specialb/sb1001.pdf (accessed on 15 August 2015). 60. Warncke, D.; Brown, J.R. Potassium and other basic cations. Chapter 7. In Recommended Chemical Soil Test Procedures for the North Central Region. NCERA-13 Publication, 2012. Available online: http://extension.missouri.edu/explorepdf/specialb/sb1001.pdf (accessed on 15 August 2015). 61. Whitney, D.A. Micronutrients: Zinc, iron, manganese and copper, Chapter 9. In Recommended Chemical Soil Test Procedures for the North Central Region. NCERA-13 Publication, 2012. Available online: http://extension.missouri.edu/explorepdf/specialb/sb1001.pdf (accessed on 15 August 2015). 62. Combs, S.M.; Nathan, M.V. Soil organic matter. Chapter 12. In Recommended Chemical Soil Test Procedures for the North Central Region. NCERA-13, 2012. Available online: http://extension.missouri.edu/explorepdf/specialb/sb1001.pdf (accessed on 15 August 2015). 63. NDAWN, North Dakota Agricultural Weather Network. North Dakota State University, Fargo, ND. Available online: http//ndawn.ndsu.nodak.edu (accessed on 15 August 2015). 64. Franzen, M. Active-Sensor Analysis Tool; NDSU: Fargo, ND, USA, 2012. 65. Kipp, S.; Mistele, B.; Schmidhalter, U. The performance of active spectral reflectance sensors as influenced by measuring distance, device temperature and light intensity. Comput. Electron. Agric. 2014, 100, 24–33. 66. Daughtry, C.S.T. Discriminating crop residues from soil by shortwave infrared reflectance. Agron. J. 2001, 93, 125–131. 67. Daughtry, C.S.T.; McMurtrey, J.E., III; Chappelle, E.W.; Hunter, W.J.; Steiner, J.L. Measuring crop residue cover using remote sensing techniques. Theor. Appl. Climatol. 1996, 54, 17–26. 68. Obade, V.P.; Clay, D.E.; Carlson, C.G.; Dalsted, K.; Wylie, B.; Ren, C.; Clay, S.A. Estimating non-harvested corn residue cover dynamics using remote sensing. Biomass Energy Prod. 2011, 491–497. 69. Mallarino, A.P.; Oyarzabal, E.S.; Hinz, P.N. Interpreting within-field relationships between crop yields and soil and plant variables using factor analysis. Precis. Agric. 1999, 1, 15–25. 70. Machado, S.; Bynum, E.D., Jr.; Archer, T.L.; Lascano, R.J.; Wilson, L.T.; Bordovsky, J.; Segarra, E.; Bronson, K.; Nesmith, D.M.; Xu, W. Spatial and temporal variability of corn growth and grain yield: Implications for site-specific farming. Crop Sci. 2002, 42, 1564–1576. 71. Franzen, D.W. Soil fertility recommendations for corn. Available online: https://www.ndsu.edu/fileadmin/soils/pdfs/cornsf722.pdf (accessed on 15 August 2015).
Sensors 2015, 15
27853
72. Sharma, L.K.; Bu, H.; Franzen, D.W. Comparison of two ground-based active-optical sensors for in-season estimation of corn (Zea mays, L.) yield. J. Plant Nutr. 2014, accepted. 73. Raun, W.R.; Solie, J.B.; Stone, M.L.; Martin, K.L.; Freeman, K.W.; Mullen, R.W. Optical sensor-based algorithm for crop nitrogen fertilization. Commun. Soil. Sci. Plant Anal. 2005, 36, 2759–2781. 74. Solari, F.; Shanahan, J.; Ferguson, R.B.; Schepers, J.S.; Gitelson, A.A. Active sensor reflectance measurements of corn nitrogen status and yield potential. Agron. J. 2008, 100, 571–579. 75. Winterhalter, L.; Mistele, B.; Schmidhalter, U. Assessing the vertical footprint of reflectance measurements to characterize nitrogen uptake and biomass distribution in maize canopies. Field Crops Res. 2012, 129, 14–20. 76. Sogbedji, J.M.; van Es, H.M.; Klausner, S.D.; Bouldin, D.R.; Cox, W.J. Spatial and temporal processes affecting nitrogen availability at the landscape scale. Soil Tillage Res. 2001, 58, 233–244. 77. Van Es, H.M.; Yang, C.L.; Geohring, L.D. Maize nitrogen response as affected by soil type and drainage variability. Precis. Agric. 2005, 6, 281–295. 78. Winterhalter, L.; Mistele, B.; Schmidhalter, U. Evaluation of active and passive sensory systems in the field to phenotype maize hybrids with high-throughput. Field Crops Res. 2013, 154, 236–245. 79. National Corn Growers Association. World of corn. Unlimited possibilities. Washington, DC, USA, 2013. Available online: http://www.ncga.com/upload/files/documents/pdf/WOC%202013.pdf (accessed on 15 August 2015). © 2015 by the authors; licensee MDPI, Basel, Switzerland. This article is an open access article distributed under the terms and conditions of the Creative Commons Attribution license (http://creativecommons.org/licenses/by/4.0/).