16th IMEKO TC4 Symposium Exploring New Frontiers of Instrumentation and Methods for Electrical and Electronic Measurements Sept. 22-24, 2008, Florence, Italy
Actographic detection system based on infrared and computer vision technologies to measure the behaviour of species David Sarriá1, Joaquín del Río1, Antoni Mànuel1, Jacopo Aguzzi2, José Antonio García2, Francesc Sardà2 1
Centre Tecnològic de Vilanova i la Geltrú (SARTI). Rambla de l’Exposició 24, Edifici VG5. 08800 Vilanova i la Geltrú, Spain. E-mail:
[email protected] 2 Institut de Ciències del Mar (ICM-CSIC). Passeig Marítim de la Barceloneta 37, 08003 Barcelona, Spain. E-mail:
[email protected]
Abstract- An automated acquisition system has been developed to measure the behavioural activity rhythms of marine species. The system has been developed using infrared and computer vision technologies by a distributed topology, different experimentations can be done at the same time if the units are repeated and connected to the main computer. The developed system consists primarily in custom low cost acquisition and illumination units with USB interface that allows the acquisition from different photodiodes sensors and to illuminate with a programmable photoperiod. The main computer controls all the connected units and processes the incoming information of behaviour from the sensors to show the activity rhythm of the species under study in association with artificially generated light cycles. The system is complemented with low cost cameras, with different vision algorithms the behaviour of the animals can be extracted. I. Introduction The system described in this paper has been developed for the CSIC marine biologists group to study and measure the rhythmical burrow emergence of the Norway lobster. The Norway lobster, Nephrops norvegicus (L.), is a decapod crustacean inhabiting of complex burrow systems (the place on where they live) in the muddy continental shelves and slopes of the Atlantic and Mediterranean Europe. This specie is fished intensively in the Mediterranean by trawl tow gears and it is slightly nowadays overexploited. The design fitting biological perspectives was been installed in aquarium tanks with controlled conditions as water temperature, circulation and light cycle. Data obtained by the system can be used efficiently to study different environmental aspects that modulate emergence. Among these demographic variables such as variables like sex, size, food presence, isolation or coexistence in group were tested in different experiments in order to assess their role in the alteration of animal’s emergence rhythm. Since the lobsters are only captured when they are outside the burrows the estimations of the biomass populations of this important fishing resource are difficult without laboratory studies on its behaviour. The system developed solves this problem and biologists may quantify what number from the population emerges and the causes of that, very important factor because a great economic repercussion exists on the fishery management of this specie. Twelve aquariums with artificial burrows properly equipped with the implemented system were placed inside an isothermal room with a temperature of 14 ± 0.1 ºC. The central computer collects all data activity from the twelve aquariums and processes all the information (data sensors and images shots of the aquariums) returning filtered data that biologists can study. II. System design The solution we adopted in order to detect the behavioural activity of animals was use infrared emitters and receivers [1] organized into detection barriers complemented with low cost infrared cameras to take frames of the aquariums in darkness, and a custom illumination system that regulate the blue light
16th IMEKO TC4 Symposium Exploring New Frontiers of Instrumentation and Methods for Electrical and Electronic Measurements Sept. 22-24, 2008, Florence, Italy
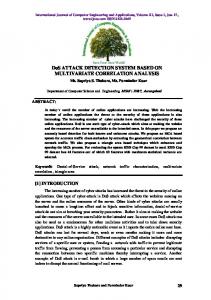
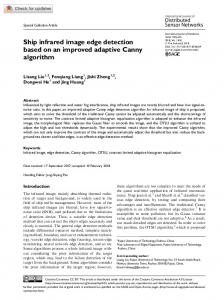
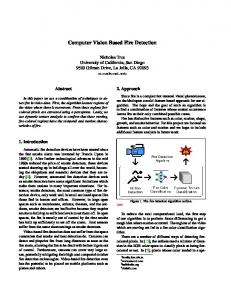
intensity level (monochromatic light at 480nm, wavelength of the light at the depths on the lobsters live), with programmable photoperiod (sunset and sunrise) and intensity power level. Lobsters are not sensitive to infrared wavelengths [2][3], and this type of measurement doesn’t produce stress to the animals, a very important fact to obtain the real behaviour of the specie otherwise will result in an alter behaviour and wrong data could be collected and studied. Emitters and receivers are placed forming vertical detection barriers and positioning them in strategic zones allows detecting the step and location of the specie in the zone of analysis, in our case inside the aquarium tank (Fig. 1). The actographic system was composed by three independent main subsystems all connected with USB interface [4] to the central computer, which controls them. Each subsystem is repeated by aquarium, a feature that makes of this construct a distributed topology design (Fig. 2). Firstly, a low cost acquisition system was developed to acquire up to 64 photodiodes. In this subsystem the infrared analog signals are multiplexed (analog multiplexer), conditioned with a very simple I-V conversion (only a resistor and an operational amplifier is needed), and acquired by a low-cost microcontroller with an integrated successive approximation AD converter [5]. The microcontroller besides controlling the acquisition from all the sensors connected, sent all the data collected to the central computer using the USB interface. The second subsystem was developed in order to control the day light photoperiod and to illuminate the aquarium from above with IR and blue radiation (480nm), predominant wavelength in natural Nephrops habitat [3]. The system couple light intensity controls to produce a photoperiod modulable photophase length. If the specie under study needed another spectral illumination, only a change of panel light board is necessary. The illumination system is not integrated with the light panel, in this way we could connect other panel boards with different spectral light without any other change. The last part of this design is represented by a low cost vision system that uses USB infrared cameras that allow the lateral view of each aquarium tank in total darkness conditions (Fig. 3). Applying image algorithms [6] is possible to contrast the results obtained with infrared sensors. A laptop computer with a LabVIEW application implemented [7], controls the subsystems and stores the IR signal and digital frames separately for each aquarium, also treats and processes the IR signals applying a detection algorithm. Finally a remote server permits the control and visualization of the experiments through Internet.
5 0: barrier #0 1: barrier #1 2: barrier #2 3: IR emitter 4: IR receiver 5: blue led
3 0
1
2
4 0
0 0
1 1
2 2
Fig 1. Parts of the design and assembly in one aquarium
1
2
16th IMEKO TC4 Symposium Exploring New Frontiers of Instrumentation and Methods for Electrical and Electronic Measurements Sept. 22-24, 2008, Florence, Italy
Internet
AQUARIUM #1
EXTERNAL HARD DISK & HUB USB
AQUARIUM #5 DATA ACQ #5
DATA ACQ #9
LIGHT #1
LIGHT #5
LIGHT #9
AQUARIUM #6
AQUARIUM #2 DATA ACQ #2 LIGHT #2
HUB USB #1
AQUARIUM #3
POWER PLUG 220V
UPS
AQUARIUM #9
DATA ACQ #1
DATA ACQ #6 LIGHT #6
AQUARIUM #10 HUB USB #4
AQUARIUM #7
DATA ACQ #10 LIGHT #10
AQUARIUM #11
DATA ACQ #3
DATA ACQ #7
DATA ACQ #11
LIGHT #3
LIGHT #7
LIGHT #11
AQUARIUM #4 DATA ACQ #4 LIGHT #4
AQUARIUM #8 HUB USB #2
DATA ACQ #8 LIGHT #8
HUB USB #5
AQUARIUM #12 HUB USB #3
DATA ACQ #12 LIGHT #12
HUB USB #6
Fig 2. System structure without the presence of the cameras
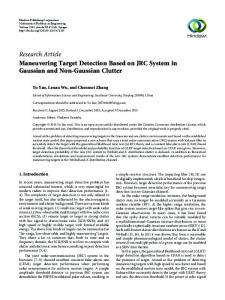
II. Detection algorithm In order to detect and compute the presence of the animals when the specie crosses the infrared barriers an algorithm was required, the decision is taken by the computer rather than the acquisition units, the reason of that is presented below. After several tests, we observed that the intensity infrared light received by the sensors in normal conditions changes over consecutive days. This is due to the turbidity of the water or the presence of impurities next to the sensors. So the algorithm could not be as simple as comparing the signal with a generic threshold. On the other hand, could happen that during an experiment the light board or one or more sensors were damaged. We wanted to avoid this situation and found an optimal detection threshold for each sensor. The solution that we presented consists in comparing the signal from each sensor with an adaptive threshold, which is a percentage below the signal tendency of each sensor. With a 65% we obtained good performance. The signal tendency of each sensor is calculated and corrected every day applying the cubical regression of the samples collected. Because samples must be stored in order to calculate the adaptive threshold and the acquisition units do not have enough memory, the algorithm is executed in the central computer making easy to upgrade or adjust the algorithm rather than program all the acquisitions units with a new firmware. This technique (threshold based on signal tendency) is possible because the activity in the sensors occur in a very small degree compared with the data collected; the regression approximates the signal without detection, in other words acts as a filter removing activity from the signal. Comparing both signals (signal collected and signal tendency), we can detect presence in the sensor (Fig 4). This algorithm discard the incorrect detection mentioned cases, as well as some sensors didn’t work (no signal reception in the AD converter), this fact is very important because the surroundings are detrimental for emitters and receivers due to the high humidity and salinity, also a possible contact with water. In these situations the defective signal is detected by the algorithm and moreover is filtered, the software notifies to the user that the system needs a board change or revision. III. Image Acquisition and processing LabVIEW with NI-IMAQ for USB Cameras software driver doesn’t support for the moment multiple camera acquisition. This problem was solved with Matlab software and the image acquisition toolbox.
16th IMEKO TC4 Symposium Exploring New Frontiers of Instrumentation and Methods for Electrical and Electronic Measurements Sept. 22-24, 2008, Florence, Italy
Fig 3. Aquarium images in darkness and camera positioning
Since is possible to call Matlab scripts from LabVIEW we have integrated all the interface, system control and data treatment in a single program application. Images with a resolution of 640x480 are stored in jpg format with low compression 15%. We are working for a reliable machine vision algorithm that track the crustacean in the aquarium, subtract of temporally consecutive images gave us good results, but this technique isn’t good with noisy images. We apply this algorithm with a another that study the contours of the image using the Sobel operator, this other technique improve the performance, also applying pattern matching of static parts of the aquarium in order to detect the presence of the animal in different zones. We are working to integrate all of these algorithms recursively to improve the performance, for the moment we haven’t exceed the 70 percent of successful results. The final vision algorithm will permit to contrast and complement the results already obtained with infrared barriers and extract information that the detection infrared design can’t offer. IV. Results Sixteen successful experiments have been done up to the present and processed data is being analyzed by the biologists. These investigators are finding enlightening results on the emergence activity rhythms of the Nephrops norvegicus. The first conclusions we obtained by exposing animals to photoperiod schedules of 12 hours light-darkness (ON, OFF at 7 am and 7 pm, respectively) are that animals’ activity is noticeably nocturnal and the same behaviour is repeated day after day following a pattern.
Fig 4. Infrared signals with adaptive threshold (left) and results (right)
16th IMEKO TC4 Symposium Exploring New Frontiers of Instrumentation and Methods for Electrical and Electronic Measurements Sept. 22-24, 2008, Florence, Italy
Fig 5. Aquarium tanks, developed units and central computer
Present experiments are currently performed under new illumination conditions in order to demonstrate that activity and emergence of animals depends on an optimum light intensity threshold and photoperiod length. This will permit to describe the behaviour of this specie at different depths into a laboratory, hence recreating reported catchability patterns in the field. Also other environmental variables (e.g. dissolved oxygen and food presence) will be used in the next future to determinate their influence on the modulation of the Neprophs behavior. V. Conclusions An actographic system was developed in order to measure the burrow emergence activity rhythm of an important crustacean for the Mediterranean and Atlantic fishery. The developed system had a distributed topology that offers a great flexibility, is easily expandable by repeating the modular subsystems. That expansion is allowed by the USB hubs, which is limited to the USB specification, 127 devices by each USB port of the main computer could be connected. Two were the interfaces that fitted with this distributed design: USB and Ethernet, we implemented the first one because gave us more flexibility, with the USB power lines we avoid external power supplies and also the assembly complexity (less wiring) is reduced. Is important to notice that the system is not limited and it can be used in other biological application on behavioural and physiological monitoring, solving and offering a nonexistent technology in the market. VI. References [1] E.L. Dereniak, G.D. Boreman, Infrared detectors and systems, John Wiley & Sons, New York, 1996. [2] E.R. Loew, Light and phtoreceptor degeneration in the Norway Lobster Nephops norvegicus (L.), Proc. R. Soc. London B. 193:31-44, 1976. [3] N.G. Jerlov, Optical Oceanography, Elsevier, Amsterdam, 1968. [4] J. Axelon, USB Complete. Everything you need to develop custom USB peripherals, Lakeview Research, Madison, 2005, [5] J.M. Angulo, S. Romero, I. Angulo, Microcontroladores PIC, diseño práctico de aplicaciones segunda parte, Mc Graw Hill, Madrid, 2000. [6] A. De la Escalera Hueso, Visión por computador, fundamentos y métodos, Prentice Hall, Madrid, 2001. [7] A. Mànuel, J. del Río, LabVIEW 7.1 Programación gráfica para el control de instrumentación, Thompson, Madrid, 2005.