large number of adaptive circuit loops into a SoC is introduced, where ... using the traditional six sigma circuit design methodology, in part because of their.
This article has been accepted for publication in a future issue of this journal, but has not been fully edited. Content may change prior to final publication. Citation information: DOI 10.1109/MDAT.2014.2343192, IEEE Design and Test
Adaptive Circuit Design Methodology and Test Applied to Millimeter-wave Circuits J.-O. Plouchart1, F. Wang2, X. Li2, B. Parker, M. A. T. Sanduleanu1,3, A. Balteanu1,4, B. Sadhu1, A. Valdes-Garcia1, and D. Friedman1 1
IBM T. J. Watson Research Center, Yorktown Heights, NY, USA, 10598 Electrical & Computer Engineering Department, Carnegie Mellon University, Pittsburgh, PA, USA, 15213 3 Now with Masdar Institute of Science and Technology, Masdar City, Abu Dhabi, UAE 4 Now with Electrical & Computer Engineering Department, University of Toronto, Toronto, Canada
2
Abstract- Communication circuits that can adapt to environmental and process variations have the potential to maximize production yield and minimize the energy per transmitted bit. An indirect sensing approach using Bayesian model fusion methodology is proposed to enable on-chip circuit adaptability. An architecture for the integration of a large number of adaptive circuit loops into a SoC is introduced, where adaptation algorithms are run on a micro-controller. An effective software-hardware co-design methodology for the implementation and verification of the proposed adaptive scheme is also discussed. An adaptive 60GHz LNA was designed to demonstrate the proposed methodology.
1 2168-2356 (c) 2013 IEEE. Personal use is permitted, but republication/redistribution requires IEEE permission. See http://www.ieee.org/publications_standards/publications/rights/index.html for more information.
This article has been accepted for publication in a future issue of this journal, but has not been fully edited. Content may change prior to final publication. Citation information: DOI 10.1109/MDAT.2014.2343192, IEEE Design and Test
1.
Introduction
Mmwave transceivers integrated in advanced nanometer CMOS are difficult to design using the traditional six sigma circuit design methodology, in part because of their sensitivities to process (P),supply voltage (V), temperature (T) and also to model unknowns, thus motivating new research work focused on developing self-healing circuit capabilities [1]-[2]. One of the primary goals of self-healing has been to use on-chip sensors, actuators and algorithms to increase high-frequency TRx yield. This objective can be formalized using the following inequality, where Mspec,i is the measured specification i, and Tspec,i is the target specification i for a set of n specifications. spec,i P,V , T , Act spec,i for all i=1 to n (1) The measured specifications are functions of P, V, T, and actuators (Act). The circuit specifications are typically derived from system analysis and hardware measurements. By meeting or exceeding the set of TRx circuit specifications, it is possible to achieve a bit error rate target for a given communication channel. Therefore, the target expression can be re-formulated as a single bit-error rate inequality: (2) BER P,V , T , Chan, Act TBER , where TBER is the targeted bit error rate for the communication link. Based on circuit sensor information and driven by a resident algorithm, actuators will be set such that adaptive circuits will use the minimum power to transmit data at a targeted bit error rate. As shown by the close relationship between (1) and (2), self-healing design techniques focused on yield maximization may also enable data communication energy minimization. Note that the bit error rate target can be dependent on the type of data sent. For example, the bit error rate can be relaxed for voice or picture, and be more stringent for text or code. Even though the inequality appears to be simple, it in fact represents a complex non-linear optimization problem. Another level of complexity is that for wireless communication the channel can change rapidly with time. Several initial adaptive RF circuits have already been reported [3]-[8]. In [3], an automatic amplitude control circuit was proposed and its feedback ratio was optimized for noise minimization. In [4], a self-calibrated frequency-domain on-chip phase-noise measurement circuit is designed to accurately measure phase noise. In [5], a cost-effective alternative-test-based performance calibration method is introduced, where a number of performance models are created by considering process and knob variations separately. These models are then used to adaptively configure the knobs and improve the yield during production test. In [6], an orthogonally tunable LNA is designed, where the performance specifications (i.e. gain and linearity) can be independently controlled to explore trade-offs between circuit performance and power consumption. In [7]-[9], an indirect performance sensing method is developed to adaptively tune a VCO to improve its performance and/or yield. The key idea of indirect performance sensing is to use a set of easily measurable metrics (e.g., DC bias current) to predict other performance metrics of interest that are difficult to measure by on-chip sensors. In this paper, we describe a design and test methodology which adaptively configures mmwave circuits for performance and/or yield enhancement by on-chip self-healing. In 2 2168-2356 (c) 2013 IEEE. Personal use is permitted, but republication/redistribution requires IEEE permission. See http://www.ieee.org/publications_standards/publications/rights/index.html for more information.
This article has been accepted for publication in a future issue of this journal, but has not been fully edited. Content may change prior to final publication. Citation information: DOI 10.1109/MDAT.2014.2343192, IEEE Design and Test
section 2, we will review a novel approach, indirect performance sensing based upon Bayesian model fusion (BMF) that can effectively enable sophisticated mmwave performance prediction without demanding integrated mmwave circuit measurement infrastructure. In section 3, we present an adaptive system on-chip architecture that allows the efficient integration of a large number of sensors, actuators, and adaptive control loops. Also in this section, we discuss how to practically integrate hardware, software and test. Finally, in section 4 we will show a design example of an adaptive mmwave LNA.
2.
Design and Test Methodology for Adaptive Circuits Integration
Analog knobs Algorithm
Tunable analog circuit
Sensor #1
Sensing
Controlling
Digital knobs
Sensor #k
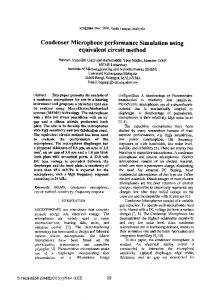
Fig. 1. Design of an adaptive circuit must take into account three critical components: sensing, controlling and integration. Designing an effective adaptive circuit is not a trivial task. The major challenge stems from the requirement that the circuit must adaptively respond to changes in process and environmental conditions and automatically correct its behavior. In general, three critical components must be carefully considered for adaptive circuit design, as shown in Fig. 1. Sensing: The behaviors and performance variables of an adaptive circuit must be accurately monitored by on-chip sensors. The power consumption and silicon area of these on-chip sensors must be minimized so that the overhead of an adaptive circuit is sufficiently small. Controlling: Based on the information collected by on-chip sensors, an efficient algorithm must be implemented to optimally control the tuning knobs (e.g., bias current, capacitor array, etc.) to maintain the desired circuit behavior. Integration: All on-chip sensors and tuning knobs must be seamlessly integrated with other core circuit blocks with small silicon area and low power consumption, while quickly and automatically accommodating environmental changes. Among these three components, on-chip performance sensing is the most challenging, because many analog performance metrics (e.g., noise figure) cannot be easily measured by on-chip sensors. To address this issue, we propose the idea of indirect performance 3 2168-2356 (c) 2013 IEEE. Personal use is permitted, but republication/redistribution requires IEEE permission. See http://www.ieee.org/publications_standards/publications/rights/index.html for more information.
This article has been accepted for publication in a future issue of this journal, but has not been fully edited. Content may change prior to final publication. Citation information: DOI 10.1109/MDAT.2014.2343192, IEEE Design and Test
sensing [9] where the performance of interest (PoI) is not directly measured by an on-chip sensor. Instead, it is accurately predicted from a set of other performance metrics, referred to as the performances of measurement (PoM), that are highly correlated with PoI and are easy to measure. In the following, we will discuss the algorithms and methodologies of the proposed indirect performance sensing in detail. 2.1. On-Chip Indirect Performance Sensing Without loss of generality, we denote a PoI as f and the PoM as:
x x1 x2 xM , 1 (3) where M stands for the number of performance metrics belonging to the PoM.The objective of indirect performance sensing is to build a mathematical model f(x) to accurately estimate the PoIf from the PoMx. Generating an indirect sensor model f(x) typically consists of three major steps: T
Pre-silicon feature extraction aims to identify a set of important performance metrics (i.e., the POM) that are highly correlated with the POI and can be easily measured by on-chip sensors. Pre-silicon model training aims to approximate the indirect sensor model f(x) by linear regression based on pre-silicon simulation data. Post-silicon model calibration aims to calibrate the indirect sensor model f(x) based on post-silicon measurement data so that the errors posed by pre-silicon simulation can be appropriately corrected. To facilitate efficient generation of indirect sensor models, advanced statistical algorithms must be developed to keep the modeling cost affordable. In other words, since both pre-silicon simulation and post-silicon measurement can be expensive, the aforementioned three steps for indirect sensor modeling must be accomplished with limited simulation and measurement data. As such, the overhead of indirect performance sensing and, eventually, the overhead of adaptive analog circuit can be minimized. 2.2. Pre-Silicon Indirect Sensor Modeling As previously mentioned, the objective of pre-silicon modeling is to identify a set of important performance metrics as the POM x (i.e., feature selection) and then fit the mathematical model f(x) (i.e., model training). To achieve this goal, we propose to adopt the sparse regression (SR) technique [9] to seamlessly integrate the feature selection step and the modeling training step into a unified framework. In general, a mathematical function f(x) can be approximated as the linear combination of a set of basis functions: K
2
f x k gk x ,
(4)
k 1
where {gk(x); k = 1, 2, …, K} contains the basis functions (e.g., linear and quadratic polynomials), {αk; k = 1, 2, …, K} contains the model coefficients, and K is the total number of basis functions. To intuitively illustrate the basic idea of SR, we consider the following simple case where the basis functions are linear:
4 2168-2356 (c) 2013 IEEE. Personal use is permitted, but republication/redistribution requires IEEE permission. See http://www.ieee.org/publications_standards/publications/rights/index.html for more information.
This article has been accepted for publication in a future issue of this journal, but has not been fully edited. Content may change prior to final publication. Citation information: DOI 10.1109/MDAT.2014.2343192, IEEE Design and Test
M
3
f x m xm 0 ,
(5)
m 1
where {αm; m = 1, 2, …, M} are the linear model coefficients and α0 is the constant term. Since we do not know the POM x (i.e., the important performance metrics that should be measured by on-chip sensors) in advance, our proposed strategy is to take a large number of possible candidates and apply SR to fit the model coefficients {αm; m = 0, 1, …, M} as in (5), such that only a small number of these coefficients are non-zero and all other coefficients are zero. Hence, based on the SR results, we can find the set of important performance metrics {xm; αm≠0} as the features of interest. In addition, the model coefficients associated with the selected POM are simultaneously determined during the aforementioned SR procedure. Unlike the conventional least-squares fitting that solves an over-determined linear equation by minimizing the mean squared error, SR formulates a convex optimization problem with a unique constraint (e.g., based on L1-norm regularization) that is able to promote sparse model coefficients. Such a convex optimization can be solved both efficiently (i.e., with low computational cost) and robustly (i.e., with guaranteed global convergence). More details regarding the SR algorithm can be found in [9]. The aforementioned SR method can be efficiently applied to pre-silicon feature selection and model training. However, the device and parasitics models used for presilicon simulation are not perfectly accurate and may differ from the post-silicon measurement results. For this reason, there is a strong need to further calibrate the proposed indirect sensor models based on post-silicon measurement data, as will be discussed in the next sub-section. 2.2. Post-Silicon Indirect Sensor Calibration The objective of post-silicon sensor calibration is to further correct the modeling error arising from pre-silicon simulation inaccuracies and also to accommodate the process shift associated with manufacturing lines. One straightforward approach for sensor calibration is to collect a large amount of post-silicon measurement data and then completely re-fit the indirect sensor model. Such a simple approach, however, can be practically unaffordable, since post-silicon testing is time-consuming and, hence, it is overly expensive to collect a large set of post-silicon measurement data. To address this cost issue, we propose a novel statistical framework, referred to Bayesian model fusion (BMF) [10], for efficient post-silicon sensor calibration. BMF relies on an important observation, namely, that even though the simulation and/or measurement data collected at multiple stages (e.g., pre-silicon vs. post-silicon) are not exactly identical, they are expected to be strongly correlated. Hence, it is possible to borrow the data from an early stage (e.g., pre-silicon) for sensor calibration at a late stage (e.g., post-silicon). In this context, even a small number of post-silicon measurements can be leveraged effectively to enhance model accuracy, allowing the cost of sensor calibration to be substantially reduced. More specifically, our indirect sensor models are initially fitted by using the early-stage (e.g., pre-silicon) data. Next, a model template is statistically extracted and encoded as our prior knowledge based on the early-stage model. Finally, the model template is further calibrated by applying Bayesian inference to very few late-stage (e.g., post-silicon) measurements to accurately update these sensor models. Here, by “fusing” the early-stage
5 2168-2356 (c) 2013 IEEE. Personal use is permitted, but republication/redistribution requires IEEE permission. See http://www.ieee.org/publications_standards/publications/rights/index.html for more information.
This article has been accepted for publication in a future issue of this journal, but has not been fully edited. Content may change prior to final publication. Citation information: DOI 10.1109/MDAT.2014.2343192, IEEE Design and Test
and late-stage sensor models through Bayesian inference, the amount of required measurement data (hence, the measurement cost) can be substantially reduced. To fully understand the proposed BMF method, we need to first explain the common characteristics between the early-stage and late-stage sensor models. To this end, we represent both the early-stage model fE(x) and the late-stage model fL(x) as the linear combinations of K basis functions, similar to (4) K
4
f E x E ,k g k x
(6)
k 1
K
5
f L x L,k g k x ,
(7)
k 1
where {αE,k; k = 1, 2, ..., K} and {αL,k; k = 1, 2, ..., K} denote the early-stage and late-stage model coefficients, respectively. Since both fE(x) and fL(x) model the same POI of the same circuit, we expect that the model coefficients αE,k and αL,k are similar, but not exactly identical. Such prior knowledge can be statistically encoded as a prior distribution. Next, we apply Bayesian inference to statistically combine the prior distribution and very few late-stage measurements to accurately estimate the late-stage model coefficients {αL,k; k = 1, 2, ..., K} based on the posterior distribution. Such an approach is referred to as maximuma-posteriori (MAP) estimation in the statistics community. Additional mathematical details regarding BMF can be found in [10]. In summary, sparse regression (SR) and Bayesian model fusion (BMF) are two core techniques that facilitate our proposed on-chip indirect performance sensing for adaptive analog circuits. In Section 4, we will describe several mm-wave circuit examples where indirect performance sensing has been successfully applied to enable adaptive circuit operations.
3.
System on Chip architecture for Adaptive Circuits
3.1 Adaptive SoC architecture The implementation of on-chip adaptive algorithms requires complex SoC design, especially for mmwave TRx. Fig. 2 shows the proposed SoC architecture intended to enable circuits to be adaptive. In this architecture, the serial interface and microcontroller data flows are multiplexed such that the algorithm can be run either outside of the chip on a host or inside the chip on the microcontroller. A microcontroller was chosen to run most of the algorithms, because it offers much more flexibility (as compared to direct algorithm implementation in hardware) to enhance the algorithm once the chip is tested or in the field. Each circuit is connected through a data bus that allows writing and reading registers. The data bus includes a control scheme that allows writing to a single or multiple circuits (broadcast mode). For added flexibility, a control circuit can be used to control multiple circuits. The enablement of series and parallel register writing and series register reading allows the proper synchronization and control of multiple tasks running in parallel. A synthesizer is required to generate the multiple clocks used in the different circuits and the clock used for the micro-controller. Because multiple clock domains co-exist inside the SoC, careful task orchestration and synchronization is required.
6 2168-2356 (c) 2013 IEEE. Personal use is permitted, but republication/redistribution requires IEEE permission. See http://www.ieee.org/publications_standards/publications/rights/index.html for more information.
This article has been accepted for publication in a future issue of this journal, but has not been fully edited. Content may change prior to final publication. Citation information: DOI 10.1109/MDAT.2014.2343192, IEEE Design and Test
DAC 1
vin
DAC
bandgap
DAC
sensor 1
control
T sensor
ADC
control
μC
ADC
sensor n SRAM
(a)
(b)
μC SRAM
DAC 1
DAC i
circuit
sensor 1
control
ADC
sensor j
μC SRAM
(c)
Fig. 2. Healing and adaptive control loops (a) ADC control loop, (b) sensor control loop and (c) adaptive circuit control loop. 3.2 ADC control loop A large number of control loops may be required to enable a complete adaptive TRx. Since most sensor outputs are analog and must be digitized to enable algorithmic control, the first loops that must be established at start-up are those for the ADCs. As shown in Fig. 2(a),the ADC can be, for example, calibrated by applying one or several bandgap voltages to its inputs. Different analog to digital conversion modes can be supported by selecting different DAC settings, thus enabling ADC range programmability. In operation, it is desirable for the self-healing control system to periodically check the temperature sensor output, using this result to evaluate temperature drift and then decide whether a new calibration is required. 3.3 Sensor control loop Once the self-healing control system has completed the ADC calibration, it can start to calibrate the sensors that are sensitive to process, supply voltage and temperature variations. An implementation example is shown in Fig. 2(b). Since the ADC circuit area is typically much larger than the sensor area, it is advantageous to group local sensors and select the sensor that needs to be read with an analog multiplexer (Fig. 2(b)). Of course, sensors that are far away from a given ADC might require the instantiation of an additional ADC, since the sensitive analog voltage might be contaminated for example by digital or clock circuit noise. The sensor calibration algorithm can take into account not only the sensor output, but also that of other internal sensor nodes (Fig. 2(b)), as well as temperature. The algorithm integrates all the different inputs and adjusts the DAC setting to adjust and calibrate the sensor. An algorithm methodology (using direct and indirect measurements)
7 2168-2356 (c) 2013 IEEE. Personal use is permitted, but republication/redistribution requires IEEE permission. See http://www.ieee.org/publications_standards/publications/rights/index.html for more information.
This article has been accepted for publication in a future issue of this journal, but has not been fully edited. Content may change prior to final publication. Citation information: DOI 10.1109/MDAT.2014.2343192, IEEE Design and Test
similar to the one described in section 2 can be used to calibrate the sensor across P, V, and T. 3.4 Adaptive circuit control loop Once the self-healing control system has completed the sensor calibrations, it can start to run the adaptive circuit algorithms. As shown in Fig. 2(c), the analog information coming from j sensors is digitized one by one. The digital information is used by the adaptive algorithms to set the circuit control bits and settings for the current control DACs. The DACs can be implemented using many different architectures, including capacitor, resistor or FET bank switching. The algorithms can take several iterations to converge to the optimum circuit setting. Each circuit can be set to target certain specifications across P, V, and T using the methodology discussed in section 2. We are also envisioning running adaptive algorithms for several circuits at once, which could allow further reduction in power consumption. Since the software algorithm latency is in the order of a microsecond to a millisecond, the fast adaptive algorithm must be implemented in hardware. Therefore, hardware and software adaptive algorithms will coexist on the same SoC. 3.5 Software and hardware co-design methodology Another important aspect of the self-healing approach is its software and hardware codesign. As shown in Fig. 3(a), the software is typically developed after the hardware is fabricated and is under test. This methodology has two drawbacks: first there is no development during the fabrication; and second, it is not possible to co-verify the software with the hardware, which can lead to some implementation issues that can only be discovered when the SoC is tested. uPro, SRAM, S.I. design Digital verification
TRx, PLL, ADC, Biasing, sensors, actuators, digital registers design
uPro, SRAM, S.I. design
TRx, PLL, ADC, Biasing, sensors, actuators, digital registers design
Digital verification
AMS verification Hardware integration
AMS verification Hardware integration
Software development
Fabrication Test
Software development
Behavioral model
Fabrication
Hardware/software verification & integration
Hardware/software integration Test
(a)
(b)
Fig. 3. (a) Typical SoC design, verification and integration flow (b) Proposed verification and software and hardware co-design flow using high-level behavioral models. In order to efficiently co-simulate the hardware and software, we have developed highlevel VHDL mathematical models for the mmwave, RF, analog and mixed-signal macros 8 2168-2356 (c) 2013 IEEE. Personal use is permitted, but republication/redistribution requires IEEE permission. See http://www.ieee.org/publications_standards/publications/rights/index.html for more information.
This article has been accepted for publication in a future issue of this journal, but has not been fully edited. Content may change prior to final publication. Citation information: DOI 10.1109/MDAT.2014.2343192, IEEE Design and Test
used in our designs. The advantage of using VHDL is that continuous analog signals can be applied to the circuits and can be processed by the behavioral models. Thus analog and digital signals can be computed efficiently by the VHDL simulator. The other means of acceleration exploited in our work is that the software is initially run externally, with sense data and control signals applied to the mmwave circuit through its serial interface. The software is written in TCL, which is also the language used to drive the VHDL simulations. By using this methodology (refer to figure 3(b)), we can avoid time-consuming, resourceintensive emulation of the microcontroller, instead natively running the TCL code on the simulation computer, resulting in a speedup of several orders of magnitude. Another important advantage of using TCL is that the testing code used to test the hardware can be the same as that used to verify the chip using the simulator, allowing unification of testing and verification flows.
4.
Case Study: An Adaptive Mmwave LNA
4.1 Performance Variability of LNA The effects of process variations have become a challenging issue for RF LNA design [5][6], and are even more significant at mmwave frequencies [1][2]. In particular, the gain, noise figure (NF) and matching of the LNA are susceptible to process variations. Fig. 4 (a) and (b) show the design schematic and layout of a 60GHz LNA designed in a 32nm SOI process. The FETs, along with all the wire parasitics, were extracted from the layout to enable more accurate simulation. The circuit was simulated using high frequency models for the transmission lines, capacitors, and resistors used in the design. In Fig. 4 (c) we show the LNA initial S-parameters measurements results. The simulated S-parameters shown in Fig. 4 (c)are in agreement with the measured one, thus validating our models. Fig. 4 (d) shows the simulated NF sweeping vs. current biasing DAC code DI at different temperatures. DI directly controls IS in Fig. 4 (a).Monte Carlo simulation results show that both gain (with mean value of 17.04dB and standard deviation of 2.19dB) and NF (with mean value of 5.15dB and standard deviation of 0.49dB) present large variability for this design. The variation of NF and gain of the LNA will significantly affect the performance of the whole receiver system. In our case, the first stage of the receiver is the LNA, followed by an RF mixer as the second stage and an IQ mixer as the third stage. According to Friis' formula, the total noise factor of the receiver system FRX is represented as: F 1 FIQ _ MIXER 1 FRX FLNA RF _ MIXER ... , 6 (8) GLNA GLNA GRF _ MIXER where F represents the noise factor, G represents the gain, and subscripts represent the name of the stage. We can see that the noise factor of all stages after the LNA will be attenuated by the gain of LNA, so the noise factor of the receiver, FRX, is mostly determined by LNA noise factor and gain. It is therefore essential to overcome the variations in the LNA to achieve low noise for the overall receiver. In this paper, we assume that the gain of LNA will be measured by an on-chip peak detector, and we focus on NF self-healing only.
9 2168-2356 (c) 2013 IEEE. Personal use is permitted, but republication/redistribution requires IEEE permission. See http://www.ieee.org/publications_standards/publications/rights/index.html for more information.
This article has been accepted for publication in a future issue of this journal, but has not been fully edited. Content may change prior to final publication. Citation information: DOI 10.1109/MDAT.2014.2343192, IEEE Design and Test
Fig. 4. 32nm SOI 3-stage 60GHz LNA (a) Schematic. (b) Physical design. (c) Simulated and measured S-parameters comparison. (d) Simulated 60GHz NF vs. current DAC code DI at T=85oC, 25oC and -25oC. 4.2 Indirect Noise Figure Sensing NF is generally difficult and expensive to measure directly on chip. Hence, here we apply the indirect sensing technique, correlating NF with easy-to-measure PoMs. We collect a set of transistor-level Monte Carlo simulation data over the joint space of process, temperature T and bias current IS. After the simulation data are collected, we are able to apply the pre-silicon indirect sensor modeling procedure described in section 2.2. In this LNA example, there are multiple possible PoMs (e.g. peak detector output voltage, DC voltages, temperature) that can be correlated with NF. We need to mention here that the LNA chip in Fig. 4 does not include a peak detector at 60GHz. This is because the LNA will be integrated with a down-conversion mixer that will include a peak detector at the IF frequency which is easier to design. In this work, we assume that the output signal amplitude is sensed by a ‘virtual’ peak detector. In simulations, we record the 60GHz output signal amplitude and use it as one of PoM. By applying the sparse regression algorithm, we are able to find the most important PoMs and select the important high-order terms associated with them. The final PoM set includes VPD (the output voltage of the peak detector), VN (the drain DC voltage in the biasing stage in Fig. 4 (a)), DI (the digital code controlling the bias current IS in tunable current mirror),and T (temperature). The correlation coefficient between NF and VPD, VN, DI, T are -0.82, -0.81, -0.67, and 0.30 respectively. Here VPD can be measured by a peak detector, VN can be measured by an on-chip ADC and T can be measured by an on-chip temperature sensor. DI can be directly known from the digital code. The indirect sensor model solved from sparse regression is:
10 2168-2356 (c) 2013 IEEE. Personal use is permitted, but republication/redistribution requires IEEE permission. See http://www.ieee.org/publications_standards/publications/rights/index.html for more information.
This article has been accepted for publication in a future issue of this journal, but has not been fully edited. Content may change prior to final publication. Citation information: DOI 10.1109/MDAT.2014.2343192, IEEE Design and Test
7
NF (VPD , DI , T ,VN ) a1000VPD a0100 DI a0010T a2000VPD 2
. (9) a0200 DI 2 a0020T 2 a0030T 3 a0003VN 3 a1010VPDT a3000VPD 3 a0000 The mean error of this indirect sensor model is 0.170dB. Given that VPD, VN and T require on-chip measurements, the impact of quantization error is also considered for the proposed indirect sensor. According to the variation range of VPD, VN and T in simulation data, the sensors’ dynamic range are 0 to 0.1V for VPD, 0.2V to 0.4V for VN, and -20°C to 80°C for T. A sweeping analysis for the bits is performed to evaluate the error under different quantization conditions. The final decision for quantization bits for VPD, VN and T are 5-bits, 4-bits and 4-bits respectively. The quantization bits are selected as the minimum bits where not much accuracy is lost. With the quantization effect considered, the NF indirect sensor error is 0.175dB. 4.3 Self-healing Algorithm and Results Using the indirect sensor model, we can predict NF according to on-chip sensor measurements. In this context, we propose the following self-healing algorithm: (a) Set bias current of all chips to minimum value. (b) VPD, VN and T are measured using on-chip sensors. (c) Calculate predicted NF of each chip using the indirect sensor model and compare the result with the NF specification. If the NF meets the specification, the algorithm stops. Otherwise, the bias current is increased by a small value, after which steps (b) and (c) are repeated until the NF specification is met or the maximum DAC control word is reached. The algorithm generally tries to find the minimum bias current that meets the NF specification. Indirect sensor model error must be carefully considered during self-healing. Due to the NF prediction error, the estimated NF will be different from the actual NF. To handle the uncertainty in NF prediction, therefore, a guard band is required. The guard band is the extra margin we leave for NF in self-healing, so that high yield can be achieved. The size of the guard band is determined by statistically modeling indirect sensor error. We first collect the error data from indirect sensor model fitting. The error data is then fitted against a distribution by using kernel density estimation. The guard band can then be optimally determined once the error distribution is known. The calculated guard band is added to the predicted NFs for all chips to guarantee high yield. To validate the self-healing algorithm with guard band at the simulation and design level, 40 chips are randomly generated from transistor-level simulations. After applying the selfhealing procedure and adding guard band, the 40 chips achieve 100% yield with the NF specification of 5.5dB. The average total LNA current for all chips is 14.7mA. The histograms of NF and total current are shown in Fig. 5 (a) and (b). We also consider the fixed-biasing cases for comparison purpose. In the fixed-biasing cases, all the chips select the same tuning knob configuration. The power and yield of a set of fixed biasing cases are compared with the proposed self-healing method (with peak detector) in Fig. 5 (c). The self-healing method is able to achieve 25% power reduction compared to the best fixed biasing case (with 19.4mA total current), while not losing any yield. The key reason for the proposed self-healing method achieving better performance is that it adaptively selects an optimum bias current for each chip. For the chips with good NF, the algorithm will try to bias at low current so that power consumption is low. For the chips with bad NF, the 11 2168-2356 (c) 2013 IEEE. Personal use is permitted, but republication/redistribution requires IEEE permission. See http://www.ieee.org/publications_standards/publications/rights/index.html for more information.
This article has been accepted for publication in a future issue of this journal, but has not been fully edited. Content may change prior to final publication. Citation information: DOI 10.1109/MDAT.2014.2343192, IEEE Design and Test
algorithm tends to bias at a high current value so that the chip can meet the NF specification. We also compare the fixed biasing cases with the self-healing method (without peak detector) in Fig. 5 (d). The indirect sensor model, quantization and guard band are formulated similarly as the case with peak detector. In this case, the self-healing method is able to achieve the same performance as the best fixed-biasing case. In future work, we plan to implement the algorithm on the microcontroller and perform all the mmwave measurement across P, V, and T.
1
Yield
# of Chips
10
5
0 4.5
5
NF (dB)
0 0
5.5
25% Power Reduction
0.5
Fixed-biasing Self-healing
(a)
Yield
# of Chips
10 5 0 0
10
20
Total Current (mA)
30
30
(c)
1
15
20
10
Total Current (mA)
0.5
0 0
Fixed-biasing Self-healing
10
20
Total Current (mA)
30
(d) (b) Fig. 5. Monte Carlo simulation results (a) and (b) NF and total current histograms after self-healing. (c) Comparison between self-healing with peak detector and fixed-biasing cases. (d) Comparison between self-healing without peak detector and fixed-biasing.
5. Conclusion In this paper we propose a theoretical framework that allows the prediction of RF and mmwave circuit performance with on-chip sensors through the use of indirect sensing with Bayesian model fusion instead of through costly and difficult direct integrated measurement. Because the simpler sensors required by indirect sensing, along with the circuit actuators, can be efficiently integrated, a large number of adaptive circuit loops can be envisioned which will allow transceivers to adapt to process variability and external changes such that the energy spent by bit transmitted is minimized. The adaptation can be performed by algorithms running on an integrated microcontroller, or, alternately, using off-chip compute engines accessing internal sensors and actuators. We proposed a design and test methodology that allows the verification and integration of the software with the digital, mixed-signal, RF and mmwave circuits. This methodology also enables significant convergence between the code used for circuit verification and that use for test. Finally, we 12 2168-2356 (c) 2013 IEEE. Personal use is permitted, but republication/redistribution requires IEEE permission. See http://www.ieee.org/publications_standards/publications/rights/index.html for more information.
This article has been accepted for publication in a future issue of this journal, but has not been fully edited. Content may change prior to final publication. Citation information: DOI 10.1109/MDAT.2014.2343192, IEEE Design and Test
described the design example of a 60GHz LNA that can be self-healed using indirect noisefigure sensing and adaptive biasing. Monte-Carlo simulations show that the LNA average power consumption can be improved by 25% with adaptive biasing while achieving the same 100% yield as that achieved with the optimum fixed bias.
6. Acknowledgements This work is sponsored by the DARPA HEALICS (Self-Healing Mixed-Signal Integrated Circuits) program under Air Force Research Laboratory (AFRL) contract FA8650-09-C-7924. The views expressed are those of the author and do not reflect the official policy or position of the Department of Defense or the U.S. Government. References [1] C. Maxey, G. Creech, S. Raman, and J. Rockway, “Mixed-signal SoCs with in situ self-healing circuitry,” IEEE Design & Test of Computers, vol. 29, no. 6, pp. 27-39, Dec. 2012. [2] C. Chien, A. Tang, F. Hsiao, and M. F. Chang, “Dual-control self-healing architecture for highperformance radio SoCs,” IEEE Design & Test of Computers, vol. 29, no. 6, pp. 40-51, Dec. 2012. [3] M. Margarit, J. L. Tham, R. Meyer, and M. Deen, “A low-noise, low-power VCO with automatic amplitude control for wireless applications,” IEEE Journal of Solid-State Circuits, vol. 34, no. 6, pp. 761 –771, Jun. 1999. [4] W. Khalil, B. Bakkaloglu, and S. Kiaei, “A self-calibrated on-chip phase-noise measurement circuit with -75 dBc single-tone sensitivity at 100 kHz offset,” IEEE Journal of Solid-State Circuits, vol. 42, no. 12, pp. 2758 –2765, Dec. 2007. [5] N. Kupp, H. Huang, Y. Makris, and P. Drineas, “Improving analog and RF device yield through performance calibration,” IEEE Design & Test of Computers, vol. 28, no. 3, pp. 64-75, May. 2011. [6] S. Sen, D. Banerjee, M. Verhelst, and A, Chatterjee, “A power-scalable channel-adaptive wireless receiver based on built-In orthogonally tunable LNA,” IEEE Transactions on Circuits and Systems, vol. 59, no. 5, pp. 946-957, May. 2012. [7] J.-O. Plouchart, M. Ferriss, A. Natarajan, A. Valdes-Garcia, B. Sadhu, A. Rylyakov, B. Parker, M. Beakes, A. Babakani, S. Yaldiz, L. Pileggi, R. Harjani, S. Reynolds, J. Tierno, and D. Friedman, “A 23.5 GHz PLL with an adaptively biased VCO in 32 nm SOI-CMOS,” IEEE Transactions on Circuits and Systems, vol. 60, no. 8, pp. 2009-2017, Aug. 2013. [8] B. Sadhu, M. Ferriss, A. Natarajan, S. Yaldiz, J.-O. Plouchart, A. Rylyakov, A. Valdes-Garcia, B. Parker, A. Babakhani, S. Reynolds, X. Li, L. Pileggi, R. Harjani, J. Tierno, and D. Friedman, “A linearized, low-phase-noise VCO-based 25-GHz PLL with autonomic biasing,” IEEE Journal of SolidState Circuits, vol. 48, no. 5, pp. 1138-1150, May. 2013. [9] S. Yaldiz, V. Calayir, X. Li, L. Pileggi, A. Natarajan, M. Ferriss, and J. Tierno, “Indirect phase noise sensing for self-healing voltage controlled oscillators,” in Proceedings of IEEE Custom Integrated Circuits Conference, pp. 1-4, Sep. 2011. [10] X. Li, “Finding deterministic solution from underdetermined equation: large-scale performance modeling of analog/RF circuits,” IEEE Transactions on Computer-Aided Design of Integrated Circuits and Systems, vol. 29, no. 11, pp. 1661-1668, Nov. 2010. [11] F. Wang, W. Zhang, S. Sun, X. Li, C. Gu, “Bayesian model fusion: large-scale performance modeling of analog and mixed-signal circuits by reusing early-stage data,” in Proceedings of Design Automation Conference, pp. 1-6, Jun. 2013.
13 2168-2356 (c) 2013 IEEE. Personal use is permitted, but republication/redistribution requires IEEE permission. See http://www.ieee.org/publications_standards/publications/rights/index.html for more information.