0615155, #CCF-0342615 #CNS-0509326), by the NIH NIBIB BISTI (#P20EB000591), NCI. caBIG core middleware development (79077CBS10). References. 1.
Adaptive Discriminant Wavelet Packet Transform and Local Binary Patterns for Meningioma Subtype Classification Hammad Qureshi1 *, Olcay Sertel2 , Nasir Rajpoot1 , Roland Wilson1 and Metin Gurcan2 1. Department of Computer Science, University of Warwick, United Kingdom. 2. Department of Biomedical Informatics, The Ohio State University, United States.
Abstract. The inherent complexity and non-homogeneity of texture makes classification in medical image analysis a challenging task. In this paper, we propose a combined approach for meningioma subtype classification using subband texture (macro) features and micro-texture features. These are captured using the Adaptive Wavelet Packet Transform (ADWPT) and Local Binary Patterns (LBPs), respectively. These two different textural features are combined together and used for classification. The effect of various dimensionality reduction techniques on classification performance is also investigated. We show that high classification accuracies can be achieved using ADWPT. Although LBP features do not provide higher overall classification accuracies than ADWPT, it manages to provide higher accuracy for a meningioma subtype that is difficult to classify otherwise.
1
Introduction
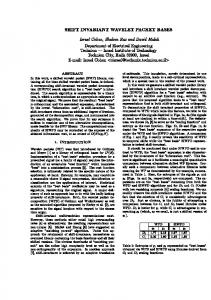
Meningiomas are tumours of the brain and the nervous system. They account for 20% of all brain tumours and exist in three different grades of malignancy (WHO Grade I-III), most being benign (over 80%) but some showing an increased propensity to recurrence and rare cases being malignant. Most benign WHO Grade I meningiomas belong to one of the four subtypes shown in Figure 1. The problem of meningioma subtype classification essentially involves discriminating between four different subtypes of meningiomas, each having distinct characteristics and unique textural properties.
a.
b.
c.
d.
Fig. 1. Meningioma Images for each subtype a. Meningiothelial (cells form synctium), b. Fibroblastic (spindle shaped cells in collagen-rich matrix), c. Transitional (cells form whorls with psammoma bodies), d. Psammomatoes (high number of psammoma bodies)
Histopathological diagnosis of tumors of the brain and spinal cord requires decision making by human experts. The diagnosis and decision making is hampered by the fact that
2
reviewing of the histological slides is time consuming and is subject to the availability of the expert and secondly there is considerable inter-rater variability. Although a lot of effort has been made to exactly define diagnostic criterion for all tumor entities within the World Health Organization (WHO) Classification of Tumors [1] but the inter-rater variability still remains considerable (see e.g., [2]). Hence, a bias is introduced which influences further therapy regimens. Due to the progress in digital image retrieval and analysis technologies, computer-assisted decision making can be used to support histopathologists by providing more objective diagnostic parameters (that may be used to define the tumor categories better) and allow high-throughput analysis. A first step, however, when developing new algorithms for image classification is to test whether an automated technique can reproduce human assignment of single tumor samples to diagnostic classes. In order to develop such a technique, we have focussed on meningiomas. Correct histopathological diagnosis can be made in most cases by a trained human expert i.e. a neuropathologist. Therefore, this tumor is well suited for testing diagnostic properties of a computer-assisted diagnosis system. In [3], meningioma subtype visualization has been attempted by Lessman et. al. who describe how self organizing maps can be combined with wavelet transforms for clustering of meningioma images. Work on meningioma cell classification was carried out by Wirjadi et al. [4] by employing supervised learning method called the Classification and Regression Trees (CART). In the context of texture segmentation and classification, wavelet frames [5] and Gabor transform [6, 7] have been shown to be effective compared to non-transform based methods. Valkealahti and Oja [8] provide evidence that in some applications Reduced Multidimensional Co-occurrence (RMC) histograms may perform better than Wavelet Packets. Rajpoot [9] developed discriminant wavelet packets for optimal subband selection for texture classification which forms the basis of our work. We are using Local Binary Patterns (LBP) and the wavelet packets based technique called the Adaptive Wavelet Packet Transform (ADWPT) for texture analysis of meningionma subtypes. Subsequently different combinations of dimensionality reduction methods and classifiers are employed for classification. The paper presents the comparative results of classification using both feature sets separately and in combination.
2 2.1
Methods Adaptive Discriminant Wavelet Packet Transform (ADWPT)
In any image based pattern recognition problem, the issue of feature selection and reduction is of paramount importance. Feature selection ensures that irrelevant information is not provided to the classifier. The optimal the feature set provided to the classifier, the better the classification performance. ADWPT not only obtains a discriminant representation but yields feature reduction as well. Adaptive Discriminant Wavelet Packet Transform Algorithm A generalization of the wavelet transform led to the development of wavelet packets. Coifman and Wickerhauser came up with the technique in early 1990s [10]. ADWPT aims to obtain a wavelet based optimal representation by optimizing the discrimination power of the decompositions representing various textures. The first stage of the technique is the computation of a full wavelet packet transform. First, the image is decomposed into its respective subbands and then each subband is decomposed further until a predefined maximum depth is reached. The next stage is the
3
selection of the best basis or pruning of the tree. Before pruning can be done, the discrimination power of each subband must be computed. First, a pseudo probability density function (ppdf) is obtained for each subband using the normalized energy of the subband coefficients. A ppdf is computed by dividing the energy of a coefficient by the total energy of the subband and is given by : sm,n = (xm,n )2 /
M X N X
x2i,j
(1)
i=1 j=1
where M × N is the size of the subband, sm,n is the ppdf of the coefficient xm,n located at indices (m, n) of the subband. Next, we compute the pseudo average probability density functions (papdf) of each subband by iteratively taking the pairwise average of the training images. It is important to note that these are computed for each class separately as follows: 2 1 2 Aam,n = (sam,n + sam,n )/2
(2)
i i−1 i Aam,n = (Aam,n + sam,n )/2, i > 2
(3)
i sam,n
th
where is the ppdf of the (m, n) coefficient in a subband for the training image ai belonging to class a. This process is repeated for all the subbands of the training images. It is important to note that an average of two subbands is computed per iteration. The objective is to acquire a basic model of the probability distribution values for each class so that the difference between the various classes may be estimated. This averaging is to be referred as pseudo averaging as it is different from the simple averaging. This is done to counter any sudden rise or fall in the probability distribution estimates. The pairwise discriminating power of the (p,q)th subband located at depth d is calculated using the Hellinger distance as follows: a ,b
i j Dd,p,q =
q M X N X p bj i − Am,n )2 ( Aam,n
(4)
m=1 n=1
where Aam,n and Abm,n denote the final average pseudo pdf’s of the (m, n)th coefficient of the (p, q)th subband at depth d for classes ai and bj respectively. This distance is calculated pairwise as indicated. So for a four class problem six such distances are computed. Subsequently the calculation of the overall discriminatory power P is computed as: Pd,p,q =
n−1 X
n X
a ,b
i j Dd,p,q
(5)
i=1 j=i+1
where i and j represent the different class indices, p, q represents the subband index at depth d and n is the total number of classes. The process is repeated for all the subbands at various levels in the full wavelet packet decomposition. The next stage is the best basis selection. Best Basis Selection The algorithm for the best basis selection is stated below. 1. Compute the J-level full wavelet packet tree decomposition. 2. Calculate the discrimination power of each subband based upon the procedure described above.
4
3. Initialize d = J − 1. 4. For all 0 ≤ p < 2j , 0 ≤ q < 2j , do the following: a If Pd,p,q < max[Pd+1,p,q , Pd+1,p,q+1 , Pd+1,p+1,q , Pd+1,p+1,q+1 ] keep the four child subbands at depth d + 1 b otherwise keep the parent at depth d and remove the child subbands. 5. Decrement d by 1. 6. If d < 0, then stop, otherwise goto step 4. Subbands Extraction and Ordering The next stage is the extraction of the subbands representing the decomposition and there ordering. The subbands are obtained from the leaves of the quad-tree structure holding all the subbands. Then they are ordered based upon their discrimination power starting from the most discriminant to the least discriminant. Feature Extraction Once the most discriminant subbands from the best basis are obtained (which is a total of 64), the next stage is the extraction of the gray level co-occurrence matrix (GLCM) features. The GLCM features employed were contrast, correlation, energy and homogeneity. The use of GLCM features with ADWPT allows us to perform spatial analysis on the ADWPT subbands. We are able to exploit the spatial correlation inherent in the texture for classification purposes. The GLCM analysis is aided by the fact that ADWPT achieves image frequency decomposition which reduces the range of coefficients for GLCM analysis rendering it more useful. The GLCM is computed over each subband with the value of r = 1 (represents the distance) and θ = 0, 90 (represents the angle). The GLCM features used are contrast, correlation, energy and homogeniety. 2.2
Local Binary Patterns
Another set of texture features we utilize for meningioma subtype classification is Local Binary Patterns (LBPs). Similar to conventional texture analysis methods based on spatial filtering (e.g., Gabor and Laws’ filters), LBPs capture the micro-features in the image by encoding them in a single 3 × 3 operator per pixel [11]. As illustrated in Figure 2(a), for each pixel, a binary number is computed by thresholding eight neighbor pixel values with center pixel value. The histogram of the resulting binary patterns can be used as a discriminative feature for texture analysis [12, 13]. Ojala et al. extended the conventional LBP operator to introduce a robust, illumination and orientation invariant texture feature [14]. In this extension, the LBP value is computed using the pixel values that lie on a circular pattern with a radius r around the center pixel. Figure 2(b) shows a sample circular LBP neighborhood with r = 1. Points used to compute the LBP values are indicated by pi , i ∈ [1, 8], where the values at diagonal pixels (p1 , p3 , p5 , and p7 ) are determined by linear interpolation. Moreover, the 256 distinct output values corresponding to 256 different local binary patterns defined in a 3 × 3 neighborhood is reduced to ten by defining a measure of uniformity, which is based on the number of transitions in the circular bitwise representation. Uniform LBPs are grouped such that circularly shifted patterns correspond to the same histogram bins. The resulting histogram contains information about the distribution of micro-structures such as bright and dark spots and edges with varying orientations.
5 p
p
2
1
p
5
5
5
4
5
5
0
5
2
1
1
3
1
( 1
5
1
1
1
1
1
1
0
0
0
1
)
=
2
4
1
1
p
8
2 p
p
4
9
4
9
4
8
0
0
p
7
p
p
(
a
4
0
0
)
(
5
6
b
)
Fig. 2. (a) The conventional LBP operator; (b) circular pattern used to compute rotation invariant uniform patterns
2.3
Dimensionality Reduction and Classification
The analysis of high dimensional data is quite delicate especially if the number of samples is relatively few compared to the number of the features (or attributes). This is known as the curse of dimensionality or in general the bias variance dilemma, which leads to peaking phenomena in classifier design as indicated in [15]. In other words, the large number of features may overfit the data if the number of training samples are small. Therefore, we considered several linear and non-linear dimensionality reduction methods such as Principal Components Analysis (PCA), Linear Discriminant Analysis (LDA) [16] and Diffusion Maps. Diffusion maps are a non-linear dimensionality reduction technique which employ manifold learning for features selection [17]. Additionaly, we employed several statistical classifiers to perform classification and compared the accuracies using different combinations of dimensionality reduction and classifiers to analyze the feature spaces constructed by applying ADWPT and LBP features as well as the combined feature space. We used Bayesian classifier (which estimate the class-conditional multi-variate normal distributions and maximize the conditional a posteriori probabilities), k -nearest neighbor (KNN) classifier (which is a non-parametric classifier based on local density estimation) and support vector machines (SVM) with a Gaussian kernel.
3
Experimental Results and Discussion
The meningioma dataset used in our experiments comprises of 320 images with equal number of samples from each of the four subtypes with five different patients per subtype. We applied a 4 or 5-fold cross validation to evaluate the performance of our algorithm. At each fold, we leave out images associated with one patient from each class for testing and use the rest for training. The classification accuracies were subsequently averaged. Results using different methods are presented below in Tables 1 through 4. Table 1 presents the classification accuracies using the ADWPT features as discussed in Section 2.1. The Daubechies 8-tab filter is used for the computation of the ADWPT decomposition. Cross-validated classification accuracies associated with each subclass are reported together with the average overall classification accuracy. As can be seen, for the ADWPT feature set, the SVM classifier provided remarkably better results when compared to other classifiers. The best accuracy has been obtained using SVM classifier over the feature set selected based on the discrimination power of the subbands as mentioned in Section 2.1. Besides, dimensionality reduction using the PCA and Diffusion Maps followed by the SVM classifier provided comparable results.
6 Table 1. Cross validated classification results for meningiomas (F=Fibroblastic, M=Meningiotheliamatous, P=Psammomatous, T=Transitional) for ADWPT features using different combinations of dimensionality reduction and classifiers Dim. reduction Classifier PCA PCA PCA PCA&LDA PCA&LDA Diffusion Maps Diffusion Maps
SVM (Gaussian) SVM (Gaussian) KNN Bayesian Bayesian KNN MD SVM (Gaussian)
No. Features
F
M
P
T
Average
64 37 35 34 3 3 19 67
92.20 70.00 40.00 67.50 58.75 62.50 68.75 67.00
60.90 63.00 61.25 33.75 52.50 52.50 27.50 92.00
98.50 100 93.75 85.00 91.25 92.50 77.50 94.00
76.60 86.00 41.25 50.00 58.75 58.75 31.25 69.00
82.10 80.00 59.06 59.06 65.31 66.56 51.25 80.00
Classification accuracies over the LBP feature set are shown in Table 2 in a similar way. This time, the Bayesian classifier provided slightly better classification accuracy than SVM. Table 2. Cross validated classification results for meningiomas for LBP features
Dim. reduction Classifier PCA PCA PCA PCA&LDA PCA&LDA Diffusion Maps Diffusion Maps
SVM (Gaussian) SVM (Gaussian) KNN Bayesian Bayesian KNN MD SVM (Gaussian)
No. Features
F
M
P
T
Average
26 3 4 4 3 3 26 7
62.50 72.00 58.75 73.75 73.75 72.50 62.50 66.00
95.00 72.00 70.00 66.25 68.75 58.75 51.25 81.00
80.00 91.00 83.75 95.00 95.00 90.00 88.75 78.00
41.00 39.00 36.25 42.50 38.75 33.75 46.25 20.00
68.00 68.00 62.19 69.38 69.06 63.75 62.19 61.00
Table 3 shows the classification accuracies over the combined feature set. The ADWPT features are combined with LBP features by concatenating them. The classification accuracy of the meningiotheliamatous feature set has improved by more than 7%. Hence, the strength of LBP in classifying meningiotheliamatous can be seen here. The results for diffusion maps are interesting in the Table 3 due to the fact that high accuracy results are obtained with a high reduction in dimensionality. Finally, the sensitivity and specificity values are compared for each feature space in Table 4. It can be seen from the Table 4 that the sensitivity of the meningiotheliamatous tumour improves when ADWPT and LBP features are combined.
4
Conclusions
In this study, we proposed an image analysis approach for meningioma subtype classification. The proposed approach utilizes the wavelet transform based ADWPT and LBP features. Comparative analysis of these feature sets as well as the classification performance achieved by combining them has been presented. A discussion of various dimensionality reduction
7 Table 3. Cross validated classification results for meningiomas for ADWPT+LBP features
Dim. reduction Classifier PCA PCA PCA PCA&LDA PCA&LDA Diffusion Maps Diffusion Maps
No. Features
F
M
P
T
Average
90 47 35 35 3 3 61 9
84.40 73.00 56.25 77.50 78.75 77.50 91.25 61.00
67.18 61.00 73.75 23.75 67.50 72.50 16.25 94.00
93.75 100 98.75 97.50 100 100 85.00 94.00
68.75 84.00 45.00 50.00 58.75 65.00 37.50 69.00
78.53 80.00 68.44 62.19 76.25 78.75 57.50 79.00
SVM (Gaussian) SVM (Gaussian) KNN Bayesian Bayesian KNN MD SVM (Gaussian)
Table 4. Cross validated specificity (SPEC) and sensitivity (SENS) results (%) for 3 types of features
SENSADW P T SPECADW P T SENSLBP SPECLBP SENSADW P T +LBP SPECADW P T +LBP
F
M
P
T
Average
92.19 90.51 62.50 91.67 84.38 93.25
60.94 94.49 95.00 86.25 67.19 91.02
98.44 96.14 80.00 97.92 93.75 96.77
76.56 89.70 41.00 83.33 68.75 85.63
82.03 92.71 68.00 89.69 78.52 92.12
techniques is also presented and diffusion maps is introduced as a viable dimensionality reduction technique for meningioma classification. It has been shown that the ADWPT performs better than LBP in most of the feature selection and classifier combinations that we have tried. The LBP features provide 59% to 73% classification accuracy on their own. Although the combined feature set does not improve the overall classification accuracy, it improves the classification accuracy of meningiotheliamatous, which is a difficult subtype to classify correctly, by 7%. The reason for low classification accuracies, in the case of LBP, is due to the complexity of the texture especially in the case of fibroblastic and transitional meningiomas. At each instance, the meningioma image may contain many textural trends with the overall texture not being regular over the whole slide. This implies that different areas on a slide may have different textural properties. Hence, LBP suffers with low classification accuracies as it looks for local binary patterns whereas ADWPT is able to resolve the inherent complexity of the images by decomposing the image into various subbands. These subbands capture different textural trends and therefore, their analysis renders higher classification accuracies. The SVM classifier using a Gaussian kernel outperformed Bayesian and k-NN classifiers while dimensionality reduction using PCA followed by SVM yields comparable results.
5
Acknowledgements
The authors would like to acknowledge the support and guidance provided by Tim Nattkemper at the University of Bielefeld and Volkmar Hans at the Institute of Neuropathogy, Evangelisches Krankenhaus, Bielefeld, Germany. This work is supported in part by ICT R&D Fund (Pakistan), the US National Science Foundation (#CNS-0643969, #CNS-0403342, #CNS-
8
0615155, #CCF-0342615 #CNS-0509326), by the NIH NIBIB BISTI (#P20EB000591), NCI caBIG core middleware development (79077CBS10).
References 1. Kleihues, P., Cavenee, W.K.: World Health Organization Classification of Tumours. Pathology and Genetics. Tumours of the Nervous System. IARC Press (2000) 2. Burger, P.: What is an oligodendroglioma? Brain Pathol (2002) 12 (2002) 257–259 3. Lessmann, B., Hans, V., Degenhard, A., Nattkemper, T.W.: Feature space exploration of pathology images using content-based database visualization. In: Proceedings SPIE Medical Imaging. (2006) 4. Wirjadi, O., Breuel, T., Feiden, W., Kim, Y.J.: Automated feature selection for the classification of meningioma cell nuclei. In Handels, H., Ehrhardt, J., Horsch, A., Meinzer, H.P., Tolxdorff, T., eds.: Bildverarbeitung fr die Medizin. Informatik Aktuell, Springer (2006) 76–80 5. Unser, M., Eden, M.: Multiresolution feature extraction and selection for texture segmentation. IEEE Transactions on Pattern Analysis and Machine Intelligence 11(7) (1989) 717–728 6. Leung, M.M., Peterson, A.M.: Scale and rotation invariant texture classification. In: Record of The Twenty-Sixth Asilomar Conference on Signals, Systems and Computers. (1992) 7. Porter, R., Canagarajah, N.: Gabor filters for rotation invariant texture classification. In: Proceedings of 1997 IEEE International Circuits and Systems. (1997) 8. Valkealahti, K., Oja, E.: Reduced multidimensional co-occurrence histograms in texture classification. IEEE Transactions on Pattern Analysis and Machine Intelligence 20(1) (1998) 90–94 9. Rajpoot, N.: Local discriminant wavelet packet basis for texture classification. In: Proceedings SPIE Wavelets X, San Diego, California. (2003) 10. Coifman, R.R., Wickerhauser, M.V.: Entropy-based algorithms for best basis selection. IEEE Transactions on Information Theory 38(2) (1992) 713–718 11. Ojala, T., Pietikainen, M.: Unsupervised texture segmentation using feature distributions. Pattern Recognition 32 (1999) 477–486 12. Ruiz, A., Sertel, O., Ujaldon, M., Catalyurek, U., Saltz, J., Gurcan, M.: Pathological image analysis using the gpu: Stroma classification for neuroblastoma. In: Proc. of IEEE Int. Conf. on Bioinformatics and Biomedicine (BIBM). (2007) 78–85 13. Sertel, O., Kong, J., Shimada, H., Catalyurek, U., Saltz, J., Gurcan, M.: Computr-aided prognosis of neuroblastoma: Classification of stromal development on whole-slide images. In: Proc. of SPIE Medical Imaging. (2008) 14. Ojala, T., Pietikainen, M., Maenpaa, T.: Multiresolution gray-scale and rotation invariant texture classification with local binary patterns. IEEE Trans. on PAMI 24 (2002) 971–987 15. Jain, A.K., Duin, R.P.W., Mao, J.: Statistical pattern recognition: A review. IEEE Trans. on PAMI 22 (2000) 4–37 16. Duda, R.O., Hart, P.E., Stork, G.: Pattern Classification. John Wiley (2001) 17. Coifman, R., Lafon, S.: Diffusion maps. Applied and Computational Harmonic Analysis, Special Issue on diffusion maps and wavelets 21 (July 2006) 5–30