Adaptive Flow Classification in IP Switching – The Measurement Based Approach Mika Ilvesm¨aki, Raimo Kantola and Marko Luoma Helsinki University of Technology Laboratory of Telecommunications Technology Otakaari 5 A ESPOO, Finland ABSTRACT In this work, we first briefly introduce the concept of IP flow classification on a general conceptual level. The intention is to rise above the technological details and create a conceptual point of view on flow classification and closely related issues. Then we move on to study and compare earlier flow classification methods such as the all and selected flow classifier and the packet count flow classifier. The comparison of these methods is done with actual network traffic and various performance metrics are presented. It is found that while the traditional methods of flow classification are found to reduce the resource usage of the network elements, they provide the user with an ambiguous traffic profile at the best. A measurement based learning approach to flow classification is then presented. We first introduce the list based flow classification algorithm to act as the reference point to the novel approach of using learning vector quantization in flow classification. It is found that both the list classifier and the learning vector quantization algorithm, when used in flow classification, require only moderate performance from the network elements while producing an intuitive and user-comprehensible traffic profile being able to adapt to traffic profile changes. The learning vector quantization flow classifier is more sensitive to changing network traffic profiles and functions somewhat more accurately than the list classifier. While all measurement-based approaches suffer the delay of analyzing the measurement data our results indicate that measurement-based approach to flow classification is able to provide users more accurate service profiles in changing traffic environment while stating reasonable performance demands to the network equipment. Keywords: Flow classification, Traffic Measurements, Internet, IP switching, Learning Vector Quantization
1. INTRODUCTION With the growth of Internet traffic the routers are becoming the forwarding bottlenecks in the Internet. Several solutions approaching this problem have been proposed. These include the speeding up of the routers by implementing the software functionality on hardware or improving the architecture of router solutions1–8 and enhancing the route look-up procedure, algorithms and software architecture.9–12 These solutions do not address the redundancy in performing consecutive similar route look-ups, they only aim to do the route look-ups faster and more efficiently. Neither do the aforementioned solutions explicitly utilize the connection oriented and Quality of Service/Grade of Service capable lower layers, such as ATM or Frame Relay which are used more and more as the link layer technologies in the contemporary and future Internet. One set of solutions, commonly called multi–layer routing or Internet Protocol (IP) switching with different solutions proposed,2,13–19 aims to combine the connection oriented link layer technologies and the connectionless Internet protocol. Multi–layer routing aims to decrease the router workload by directing long lasting packet flows to the connection oriented link layer (switching) away from the network layer (routing), thus eliminating having to look up the same routing decisions to consecutive packets. Flow classification is used in IP switching systems as means to detect long–lasting flows that contain a substantial number of packets. The flow classification is a problematic issue because the resources for both routing and switching Other author information: (Send correspondence to M.I.) M.I.: E-mail:
[email protected] R.K.: E-mail:
[email protected] M.L.: E.mail:
[email protected] Fax: +358 9 451 2474
are limited and therefore the packet flows that reduce the router workload the most, i.e., flows containing most of the packets, need to be detected. The ideal solution would be to map as many packets to as few flows as possible and at the same time provide enough differentiation of services so that the users in the network could be offered some kind of prioritization, whether it be Grade of Service (GoS) or even absolute Quality of Service (QoS). Some applications used in the Internet might function adequately without any particular service level while others could substantially benefit if they were offered higher service levels. This division between basic and higher service levels essentially constitutes the outcome of the flow classification process. The use of flow classification introduces also the problem of identifying a single packet to a particular flow – the packet classification problem. There exists recent suggestions to use packet classification and modifications of fast lookup algorithms to determine the packet class8,20–22 based on the flow classification criteria. These solutions extend from the fast address lookup algorithms and they do not provide any new perspective to the flow classification problem. Several studies have been conducted on different flow classification methods.23–28 These studies mostly concentrate on optimizing the performance of the routing component. All aforementioned studies either explicitly or implicitly suppose that flows which contain a large amount of packets are beneficial to the user if prioritized and the flow classification schemes aim to detect flows with large packets to flows –ratio. Very little emphasis is, however, put to study the actual effect that these flow classification methods have to the user of the network. In this work we examine flow classification on a general conceptual level and proceed further to develop a measurement based flow classifier that emphasizes also the effect the classification process has to the user. We do this under the assumption that flows containing a large number of packets are also the same flows that contain traffic from interactive Internet applications and are thus benefiting the user if prioritized. We intend to show that the measurement based Learning Vector Quantization (LVQ) classifier, introduced and studied in Refs. 29–31, and shown to perform well also in terms of processing capacity, detects these traffic flows from interactive applications with satisfactory precision.
2. METHODS OF FLOW CLASSIFICATION 2.1. General issues Flow classification should co-exist with and be an aid to the resource management and connection admission control mechanisms. Flow classification determines whether future packets belonging to the same IP flow should be prioritized and directed straight to the connection oriented link layer, or continue to be forwarded by the IP routing engine.18 An IP flow is defined32,33 to be a series of packets traveling from a constant source to a constant destination. The definitions of source and destination, and therefore the definition of flow, may be freely chosen to include anything from IP address prefixes defining parts of networks and coarse flow granularity to IP address and TCP port quadruples defining applications and fine flow granularity. Also the flow timeout value plays a major role when analyzing results and performance of flow classification. In this work two packets belong to the same flow if they have similar IP address and TCP port quadruples and there is no more than 60 seconds between the consecutive packets with similar flow identifier. This fine level of flow granularity enables us to pick out individual service flows needing prioritization. An IP service is defined in this work by the TCP source port number. If the service definition would also take into account the destination port number we would experience an abundance of detected services since the destination port numbers are used in various ways depending on the implementation of the receiving TCP client. Flow classification may be used for several purposes in the network. The most intuitive use detects flows between applications and enables the other network devices to offer this flow prioritization, such as Quality or Grade of Service. Depending on the definition of the flow the classification process may also detect flows traveling from one part of the network to another. If these flows are divided to groups so that these groups contain only certain application flows we might be able to offer these groups of flows prioritization. A much-debated subject34,35 is the initiation of the flow setup procedure. Basically this is the question between letting either the user or the network make suggestions on what flows should be prioritized. • User Requested Flow Classification methods include the likes of signaling, use of RSVP or any other method that requests better performance to the flow it explicitly specifies. The analysis of these kinds of flow classification methods is quite useless since the problems lie more in the area of connection admission control (CAC) and resource allocation. The prioritized service profile is formed by the explicit requests by the users; the network gives requested performance to the user at her request. In the current Internet these explicit flow classification methods are not yet widely applied.
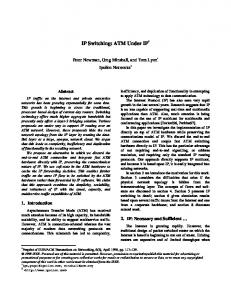
• Network Controlled Flow Classification means that the flow classification decision is made in the network equipment. Most of these classification methods take, or could be easily modified to take, into account the status and resource restrictions of the network equipment (routers). If no weight is placed on the effect the user is experiencing from the use of the flow classification scheme the user may not be experiencing any performance improvement although the network equipment is functioning in an optimal fashion. These solutions include the packet count and the adaptive packet count solutions.18,23–25,27,29 The Network Controlled Flow Classification method further contains a much-debated issue whether setting up the connections should be made based on knowledge of network topology or occurrences of new traffic. In topology– based schemes the connections are established based on the information gathered from routing protocols, and possibly also from traffic measurements. The topology–based solutions are planned to be able to aggregate traffic, but the mechanisms, since they are bound on the information extracted from the routing protocols, are not able to extend beyond the (domain) area controlled by the specific routing protocol. In addition it seems that the methods of applying QoS/GoS in topology–based IP switched networks remains an issue with no clear solution. Traffic–based set-ups, in which connections are established as the network (through monitoring the packets) detects new traffic flows. The traffic–based solutions are more general and not dependent up on the underlying control mechanisms. However, the traffic–based solutions suffer from various problems such as misordered packets due to flow setup delays and difficulties in dealing with network topology changes. How to effectively combine the different views of traffic– and topology–based classification schemes remains an open question, but is addressed19 for instance in the Multi Protocol Label Switching (MPLS)–workgroup of the IETF. Whether to spread information of the classification decisions locally or globally is yet another question still remaining unanswered. Basically two opposite approaches exist: 1. Local decision making lets the involved network elements do their flow classification process independently from the others. This may be considered as the traditional ”Internet way” as the connection state is maintained possibly only in one network element. To have any use of the flow classification decisions two or preferably three consecutive routers should be made aware of decision. This method is used in traffic–based IP switching solutions.18,36 The local decision making might lead to a fluctuating and inconsistent QoS/GoS if such is provided by the routers. This happens because the flow classification criteria or the flow classification decisions are not distributed to all routers in the route. Local decisions lead to hop by hop decisions concerning resource allocation and offer policy based relative prioritization in the network at the best. 2. Global decision making requires the network elements (switches, routers) to be aware and negotiate on the flow classification criteria and decisions of other network elements. This has the advantage of being able offer consistent QoS/GoS through the involved network. However, the distribution of flow criteria results in additional traffic; when networks are big and traffic is flowing this might create a substantial increase in traffic. RSVP37 (see also Ref. 38 for discussion on RSVP) and signaling solutions are one way of spreading information on flow classification, the methods and protocols for distributing labels17,19 is another, more related to the Network Controlled Flow Classification method. Combining these two views we may advance to a kind of negotiated local decision making, where the flow classification criteria is distributed inside (an autonomous area of) the IP switched network but the final decision on the classification is made in the entry point of the flow. The different practical methods of flow classification presented in this work and their relation to each other in terms of control of flow set–up, dynamism in flow detection criteria and the benefits the scheme is seen to contribute have been illustrated in Figure 1. In this paper we assume that the flow classifier can divide the observed traffic into two classes; One that is prioritized (switched to a separate connection) and the other that is not prioritized (forwarded in the default connection). This is by no means meant to be an absolute and strict division, but it makes observing the results easier and more intuitive.
Dynamic classification criteria LVQ classifier List classifier User based Explicit classification (- RSVP)
Packetcount - Dynamic value
All flow classifier
Network controlled classification
User controlled classification
Interarrival time classifier
Static selected applications classifier
Resource based Packetcount - Static value Static classification criteria
Figure 1. Flow classifiers and their relation to each other
2.2. All flow classification All flow classifier prioritizes every flow it detects. This is the worst–case scenario when using fine granularity flows where IP switch resources are heavily used. Practical use of the All flow classifier is limited especially in the fine flow granularity level because the classifier uses connection space and flow setup resources in excess. In this work the All Flow Classifier serves as a reference point to which other classifier methods are compared to. Classifiers of similar behavior have been previously used and analyzed in Refs. 18,25,29,30,39.
2.3. Selected service flow classification In some solutions the network makes the decision for prioritizing a flow based on the pre-defined set of services that are given priority.23–25,29,30 The set of services is decided by the network manager based upon experiences and preferences on the network traffic. These service set based flow classification schemes have so far had static service sets, which have been intelligently guessed or determined by the network managers. The change in the services switched needs the intervention of the network manager. The selected service classifier offers very low performance requirements to the network elements but to use it effectively the service sets would be better if determined automatically according to the service profile changes in the network.
2.4. Packet count flow classification The Packet count flow classifier24,25,39 detects flow candidates and waits that a certain amount of packets arrive on this candidate flow. After this packet count threshold is reached the packet flow is directed to its own connection. Packet count flow classifier could also be used to balance and control the use of IP switch resources if the threshold value is dynamically altered according to resource usage.27 The packet count classifier is able to filter out those flows that do not contain a sufficient amount of packets in a given time. The resource demand has been shown to drop significantly24,25,39 but the service profile has been shown to be widespread and contains lots of services that do not benefit the user of the network when prioritized.29
3. ADAPTIVE MEASUREMENT BASED FLOW CLASSIFICATION 3.1. Learning vector quantization classifier An improvement to the selected service flow classification category of flow classifiers is the LVQ classifier introduced first in Ref.,29 which updates the service set according to measurements made in the network thus being able to
adapt to changes in the network traffic and service profile. The LVQ classifier is used because we want to see if any information affecting the performance of flow classifiers is lost when we switch from 2–dimension measurement data (packets and flows dealt separately) to 1–dimension measurement data (packets to flows ratio). As we apply the LVQ algorithm to the flow classification problem we use the basic program package∗ explained in Ref. 40. The algorithm itself is extensively explained and clarified in Ref. 41 so only a brief introduction of the particular algorithm and its application to flow classification are offered here. The LVQ classifier was first introduced and compared to other classifiers in Ref. 29. We apply the LVQ classifier to the flow classification problem as illustrated in Figure 2. Service profile
Checking recognition accuracy
Balancing
Initialization Codebook training with OLVQ1
Figure 2. The construction of the LVQ classifier We first measure the network for flows and the packets on these flows respectively. After the measurement we have a list of all the services seen in the network together with the total amount of packets and flows measured for these services. We then normalize the results to the total number of packets and flows seen in the trace respectively. Training vectors are then constructed. We form a training data set possessing clear qualifications for either switching or routing. At the moment we are only using common sense (manual labor) to determine the training data. This is done by using a combined set of largest/smallest packets / flow –pairs from detected services. We then determine the initial codebook vectors that have to be within the borders of corresponding classes by using the teaching vectors. After initializing the codebook vectors we balance the amount of entries in any of the classes. The final codebook vectors are then trained using (1) and the training vectors: mc (t + 1) = [1 − s(t)αc (t)]mc (t) + s(t)αc (t)x(t)
(1)
where s(t) = +1 if the classification is correct, and s(t) = −1 if the classification is not correct and αc (t) is determined for each codebook vector mi individually. The αc (t) is defined to be αc (t) =
αc (t − 1) 1 + s(t)αc (t − 1)
(2)
which enables us to determine the near optimal values of αi (t) recursively. Finally we determine the class for each measurement result letting the c in mc , the nearest codebook vector mi to the unknown measurement result x, to be c = arg min{kx − mi k}
(3)
Performance analysis is then performed in addition to the teaching trace also with the other traffic traces that have not been used in the teaching process to observe the performance of the LVQ classifier and the network service profile. ∗
Available via WWW from http://www.cis.hut.fi/nnrc/lvq pak/
In this work we are also interested in the kind of service profile we are getting and the number of services that are detected. In essence, by using the LVQ classifier we hope to be able to establish a measurement based flow classifier to an IP switching system regardless of flow granularity level and thus to provide more generality, sensitivity and flexibility to the classifying process.
3.2. List classifier The list classifier is a simple measurement based classifier created mainly to be of reference to the LVQ classifier. The list classifier measures the network for packets/flows –ratio and then orders these measurement results to a list where the values descend from the largest to the lowest value. By choice a classification border is set which divides the prioritized and default traffic. The placing of the border in this work is determined so that the border is set to the 20th and 50th percentile of detected services. For instance, if we measure the network to contain one thousand services the border is placed to include all services up to the 200th and 500th service respectively. This placing is arbitrary and is done to observe the effects that adding services introduces to the system. Also one could set some restrictive resource, such as the connection space, to guide the border placement.
4. PERFORMANCE RESULTS 4.1. Quantitative analysis with qualitative aspects To adequately observe the quantitative performance of the flow classification scheme we introduce a model containing four different factors of quantitative flow classification performance. These factors also aim to monitor the use of restrictive resources. The model in this work is always used in relation to a reference model, thus observing and comparing different classification schemes in relation to each other. The following four factors are determined for those flow classification schemes that are simulated in this work: • Flow factor gives an indication how much the average flow setup speed and the number of flows needed to set up in the trace differ from the reference point. It also portrays the proportionate amount of flows needed to prioritize the classified packets. This factor does not take into account the additional cost of actually setting up the flow since this is a protocol specific issue and therefore not in the scope of this work. The cost model taking into account the relative cost of setting up a flow is presented in Ref. 28. • Connection space factor shows how the maximum number of connections needed to set up according to the suggestions of the flow classification component changes. • Prioritization factor indicates how many packets in the total traffic are prioritized and subsequently gives us the indication of the overall efficiency of the flow classification scheme. This factor indicates also how much the forwarding workload is reduced. The more packets are mapped to fewer flows the lesser demand for performance is experienced by the forwarding component and the route look-up procedure of the IP router. This is one of the essential goals of IP switching and flow classification. Observing this factor together with the flow factor one can determine whether it is practical to implement the flow classification scheme in question. • Service factor, according to the service definition earlier, indicates how many different services are present in the trace. This factor is highly dependent on the definition of the service and therefore varies if the definition of service is altered. Together with the qualitative performance analysis this factor gives a reasonably accurate picture on how the user is experiencing the flow classification scheme. It is also clear that an abundance of services or traffic flows results in an ambiguous traffic profile and might be wasting especially connection space and resources used in realizing prioritization in the network (e.g. bandwidth and buffer resources). The other restrictions of IP switching (bandwidth/transmission rate, flow setup delay)42 that are not dealt with here are seen to be independent of the actual flow classification procedure and therefore not relevant to this study. More specifically the restrictions on transmission rate, i.e., the methods which bandwidth should be allocated to flows are definitely of great interest, but deserve a committed research effort. Flow setup delay is similar to the actual cost of setting up a flow. It is a protocol and implementation dependent metric and varies according to the technological environments.
Connectionless technologies
Connection oriented technologies
Packet prioritization
Flow state setups
Flow state setups
50%
Flow state space
Applications 50%
50%
Packet prioritization
50% Applications
User Flow state space
Figure 3. Quantitative performance model for comparing flow classification methods
To visualize the four quantitative factors we introduce the quantitative performance model, the quadrilateral model, for comparing different flow classification schemes in Figure 3. The quadrilateral model in Figure 3 gives us an illustrative picture on how the different flow classification schemes perform. The ends of axis present the maximum of the factor in a certain network environment. Since we are trying to observe relative performance the measured factors, except for the prioritization factor, are normalized to the performance of the all flow classifier. In addition to the quadrilateral model, an important tool to analyze the performance of the classifiers is observing the services a particular classification scheme is picking up for prioritization. To avoid confusion and to achieve clarity we list those services defined by the source port in the well-known port area that have a definite status to them. In the upper regions of port numbers we rely on a similar behavior; if the flow classifier scheme picks up flows of interactive nature in the well-known service (port) area it is assumed that it can pick up flows with similar characteristics also in the upper region of port numbers.
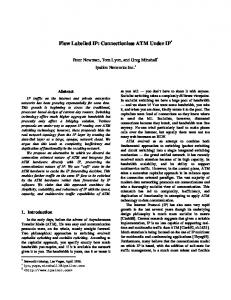
4.2. Results The traces used in the simulations are described in Table 2. Regarding the LVQ classifier the dec2 trace is used to train the classifier which is subsequently used for the other test networks dec4 and ebb130. The number of codebook vectors in the classifier is chosen to be 400, which is an arbitrary amount, but somewhat substantiated in.31 The teaching set is constructed manually by observing the service list and choosing clear candidates for regular handling (routing, forwarding) and prioritized handling (cut–through switching). As has been stated in Refs. 25,29,39 and as can be seen from Figure 4 when packet count flow classification is used with fine granularity IP switching we may, in average, use only 10–20 % flow capacity using reasonable packet count threshold values compared to when using the all flow classifier. Also we can see in Figure 4 that the use of connection space drops significantly using at the best only 10–20 % of the connection space compared to the all flow classifier. Also the amount of packets prioritized and thus moved away from the router’s forwarding engines is even up to 80 to 90 %. However, the amount of services that are detected drops at the best case, with almost unrealistically high packet count threshold value, only to approximately 30 % and is on the average as high as 40 to 60 % percents of all services seen in the trace. This means that a large number of services are being prioritized without the need for such actions and thus wasting resources from those services needing the prioritization.
Comaparison of all flow and packetcount classifiers / dec2
Nr of services
Flows 100,00 % 90,00 % 80,00 % 70,00 % 60,00 % 50,00 % 40,00 % 30,00 % 20,00 % 10,00 % 0,00 %
Comaparison of all flow and packetcount classifiers / dec4 Flows 100,00 % 90,00 % 80,00 % 70,00 % 60,00 % 50,00 % 40,00 % 30,00 % 20,00 % 10,00 % 0,00 %
All flow PktCnt(5) PktCnt(10) PktCnt(15) PktCnt(20) PktCnt(25)
Nr of services
Connection space
Prioritization
All flow PktCnt(5) PktCnt(10) PktCnt(15) PktCnt(20) PktCnt(25)
Connection space
Prioritization
Comaparison of all flow and packetcount classifiers / ebb130
Nr of services
Flows 100,00 % 90,00 % 80,00 % 70,00 % 60,00 % 50,00 % 40,00 % 30,00 % 20,00 % 10,00 % 0,00 %
All flow PktCnt(5) PktCnt(10) PktCnt(15) PktCnt(20) PktCnt(25)
Connection space
Prioritization
Figure 4. Comparison of the packet count and all flow classifiers
When looking at Figure 5 and comparing it to Figure 4 we can immediately see that as far as the flow capacity, use of connection space and packet prioritization is concerned the list and the LVQ classifiers perform as good as, or even better than, the packet count classifier. Figure 5 also shows how the selected flow classifier acts, but one can deduct that while performance is in its own class the static service set does not provide the paying customer the best possible prioritized service profile. The amount of services detected is with the LVQ classifier and 20 % list classifier equal or lower when compared to the amount of services that the packetcount classifier detects. To determine which classifier, the list or the LVQ, detects better service profiles we turn to Table 1. We see in Table 1 that the quality of the 20 % list classifier is somewhat unstable. While it succeeds in the case of dec4 network to obtain practically identical service profile to the LVQ classifier it fails to include some important services in the dec2 trace, such as 79 and 80, the gopher and the www–services, and picks up altogether too many services to be prioritized in the ebb130 trace.
5. CONCLUSIONS The traffic measurements clearly indicate that all the presented classifiers are able to pick up the minority of the flows that contain the majority of the packets. This behavior is the fundamental requirement for applying flow classification in the Internet. The greatest differences arise in the amount and kind of services that the different classifier schemes detect. With the packet count classifiers, depending on the threshold level, the amount of services detected for prioritization ranges from 20% to 90% of all services present in the network. This suggests that the packetcount classifier detects also services not needing the prioritization and this way possibly wastes resources in IP switched networks.
Comparison of selected service, list and LVQ classifiers/dec2
Nr of services
Flows 100,00 % 90,00 % 80,00 % 70,00 % 60,00 % 50,00 % 40,00 % 30,00 % 20,00 % 10,00 % 0,00 %
Comparison of selected service, list and LVQ classifiers/dec4 Flows 100,00 % 90,00 % 80,00 % 70,00 % 60,00 % 50,00 % 40,00 % 30,00 % 20,00 % 10,00 % 0,00 %
All flow Selected List(20%) List(50%) LVQ
Connection space
Nr of services
Prioritization
All flow Selected List(20%) List(50%) LVQ
Connection space
Prioritization
Comparison of selected service, list and LVQ classifiers/ebb130
Nr of services
Flows 100,00 % 90,00 % 80,00 % 70,00 % 60,00 % 50,00 % 40,00 % 30,00 % 20,00 % 10,00 % 0,00 %
All flow Selected List(20%) List(50%) LVQ
Connection space
Prioritization
Figure 5. Comparison of the selected service, list and LVQ classifiers
When comparing the LVQ and the 20% list classifier we can see that even at the worst performance level the LVQ classifier detects little over 20% of all the services present in the network. Adding to this when observing the services that the LVQ classifier detects we can safely state that the LVQ classifier is very well able to extract the services that may need prioritization from the network. While the 20% list classifier performs also well in terms of quantitative factors one could cautiously notice that the qualitative performance is not quite up to the level of the LVQ classifier. The strong side of the LVQ classifier seems to be the ability to filter out the top services that really do require prioritization at the moment of measurement. The amount of services it detects seems to be in accordance to the size and traffic profile of the network. However, as the LVQ classifier detects services it also prioritizes very short flows with only a few packets leading to an increased use of connection space. This could be tolerable provided that the services prioritized benefit the user. The list classifiers main weakness is that it blindly classifies the set amount of flows without taking into account the varying traffic profiles in different networks. In this regard the LVQ classifier is better able to adapt to changing traffic profiles and service usage. The LVQ classifier is a measurement based classifier. It suffers from the learning delay meaning that it has to gather data to adapt to the service profile of the network it is connected to. This delay may be reduced by carefully constructing the training data sets and using enhanced LVQ–algorithms, such as LVQ2 and LVQ3.41,40 The solution presented here does not take into account the limited connection space or flow setup resources but in an actual implementation of the LVQ classifier these factors should also be accounted for. Future issues of research include an extensive testing of the list and the LVQ classifiers with actual network traffic traces. The automated construction of the teaching vectors for the LVQ classifier is also under study.
Classifier / Network name dec2
dec4
ebb130
a
List(20%)
List(20%) 1056 services, 6 shown 20, 119, 179, 210, 514, 520 List(20%) 1766 services, 34 shown 0, 20, 21, 23, 26, 27, 69, 70, 79, 80, 119, 179, 210, 259– 279, 520 List(20%) 880 services, 25 shown 0, 20, 21, 22, 23, 25, 33, 52, 57, 68, 79, 80, 110, 119, 139, 175, 213, 443, 513, 515, 520, 618, 708, 801, 901
List(50%) 2640 services, 12 shown 20, 21, 25, 70, 79, 80, 119, 179, 210, 514, 520 List(50%) 4415 services, 46 shown 0, 2, 6, 20, 21, 23–27, 69, 70, 79–83, 119, 179, 210, 251, 259–279, 320, 321, 514, 520, 540 List(50%) 2129 services, 33 shown 0, 20, 21, 22, 23, 25, 33, 52, 53, 57, 68, 70, 79, 80, 81, 82, 110, 119, 139, 175, 213, 443, 513, 515, 520, 618, 706, 720, 752, 801, 901, 993, 995
LVQ 1186 services, 10 shown 20, 21, 25, 79, 80, 119, 179, 210, 514, 520 LVQ 1269 services, 14 shown 20, 21, 23, 25, 26, 27, 70, 79, 80, 119, 123, 179, 210, 520
LVQ 100 services, 18 shown 0, 20, 22, 23, 33, 52, 68, 79, 80, 110, 111, 113, 119, 139, 213, 520, 801, 901
Only those services in the lower TCP port area are listed.
Name dec-pkt-2 (dec2)
dec-pkt-4 (dec4) ebb130 a
Table 1. Services from different classifiers Service listsa List(50%) LVQ
Table 2. Traffic traces used in this Trace information Location Length Digital’s primary Inter- 1 hr net access point (DIAP) 02:00, March 9th, 1995 DIAP 14:00, Thu March 1 hr 9th, 1995 HUT/Campus Area Net- 1 hr work 13.30 May 27, 1997
work Nr of packets 5.0 million
Other information WWW–archivea
5.0 million
WWW-archive, Test trace Test trace
1.2 million
All dec-pkt-x traces are freely available at http://ita.ee.lbl.gov/html/contrib/DEC-PKT.html
ACKNOWLEDGMENTS This work was funded by IPANA– and MITTA–projects in the Helsinki University of Technology.
REFERENCES 1. G. Parulkar, D. C. Schmidt, and J. S. Turner, IP on ATM: a Strategy for Integrating IP with ATM, Washington University. 2. P. Newman, G. Minshall, T. Lyon, and L. Huston, “IP switching and gigabit routers,” IEEE Communications Magazine , pp. 64–69, January 1997. 3. F. Hoymany and D. Moss´e, “Switch-borne router for high performance packet forwarding of connectionless traffic in atm networks,” in ICCCN ’96, October 1996. 4. F. A. Tobagi, “Fast packet switch architectures for broadband integrated services digital networks,” in Proceedings of the IEEE, vol. 78, pp. 133–167, IEEE, IEEE, January 1990. 5. T.-B. Pei and C. Zukowski, “Putting routing tables in silicon,” IEEE Network Magazine , pp. 42–50, January 1992.
¨ 6. R. J. Walsh and C. M. Ozveren, “The GIGAswitch control processor,” IEEE Network , pp. 36–43, January/February 1995. 7. A. Tantawy, O. Koufopavlou, M. Zitterbart, and J. Abler, “On the design of a multigigabit IP router,” Journal of High Speed Networks 3(3), 1994. 8. S. Keshav and R. Sharma, “Issues and trends in router design,” IEEE Communications Magazine 36, pp. 144– 151, May 1998. 9. M. Degermark, A. Brodnik, S. Carlsson, and S. Pink, Small Forwarding Tables for Fast Routing Lookups, Lule˚ a University of Technology, 1997. 10. J. T. Marcel Waldwogel, George Varghese and B. Plattner, “Scalable high speed IP routing lookups,” in Proceedings of SIGCOMM ’97, pp. 25–36, ACM/SIGCOMM, ACM/SIGCOMM, 1997. 11. S. Nilsson and G. Karlsson, “Fast address lookup for internet routers,” in Broadband Communications: The Future of Telecommunications, P. Kuhn and R. Ulrich, eds., pp. 11–22, IFIP, Chapman & Hall, 1998. 12. D. Decasper, Z. Dittia, G. Parulkar, and B. Plattner, “Router plugins a software architecture for next generation routers,” in Proceedings of SIGCOMM ’98, IEEE/ACM, IEEE/ACM, 1998. 13. Y. Katsube, K.-I. Nagami, and H. Esaki, Cell Switch Router - Basic Concept and Migration Scenario, Toshiba Corporation, 1996. 14. H. Esaki, S. Matsuzawa, A. Mogi, K.-I. Nagami, T. Jinmei, T. Kon’no, and Y. Katsube, “Cell switch router (CSR) – label switching router supporting standard ATM interfaces,” in Broadband Networking Technologies, S. Civanlar and I. Widjaja, eds., vol. 3233, pp. 2–10, SPIE, SPIE, November 1997. 15. Y. Rekhter, “Tag switching architecture - overview,” in Broadband Networking Technologies, S. Civanlar and I. Widjaja, eds., vol. 3233, pp. 11–19, SPIE, SPIE, November 1997. 16. H. M. Ahmed, R. Callon, A. G. Malis, and J. Moy, “IP switching for scalable IP services,” in Proceedings of the IEEE, vol. 85, pp. 1984–1997, IEEE, December 1997. 17. B. Davie, P. Doolan, and Y. Rekhter, Switching in IP Networks – IP Switching, Tag Switching and Related Technologies, Morgan Kaufmann Publishers, Inc., 1998. 18. P. Newman, G. Minshall, and T. L. Lyon, “IP switching – ATM under IP,” IEEE/ACM Transactions on Networking 6, pp. 117–129, April 1998. 19. A. Viswanathan, N. Feldman, Z. Wang, and R. Callon, “Evolution of multiprotocol label switching,” IEEE Communications Magazine 36, pp. 165–173, May 1998. 20. V. P. Kumar, T. Lakshman, and D. Stiliadis, “Beyond best effort: Router architectures for the differentiated services of tomorrow’s internet,” IEEE Communications Magazine 36, pp. 152–164, May 1998. 21. T. Lakshman and D. Stiliadis, “High–speed policy–based packet forwarding using efficient multi–dimensional range matching,” in Proceedings of SIGCOMM ’98, IEEE/ACM, IEEE/ACM, 1998. 22. V. Srinivasan, G. Varghese, S.Suri, and M. Waldvogel, “Fast and scalable layer four switching,” in Proceedings of SIGCOMM ’98, IEEE/ACM, 1998. 23. N. Peter, L. Tom, and M. Greg, “Flow labelled ip: A connectionless approach to atm,” in IEEE Infocom, San Francisco, IEEE, March 1996. 24. S. Lin and N. McKeown, “A simulation study of IP switching,” in ACM SIGCOMM ’97, 1997. 25. M. Ilvesm¨aki, K. Kilkki, and M. Luoma, “Packets or ports - the decisions of IP switching,” in Broadband Networking Technologies, S. Civanlar and I. Widjaja, eds., vol. 3233, pp. 53–64, SPIE, SPIE, November 1997. 26. M. Ilvesm¨aki and M. Luoma, “IP switching in a simplified ATM environment,” in Broadband Networking Technologies, S. Civanlar and I. Widjaja, eds., vol. 3233, pp. 65–76, SPIE, SPIE, November 1997. 27. H. Che, S.-Q. Li, and A. Lin, “Adaptive resource management for IP/ATM hybrid switching systems,” in Broadband Networking Technologies, S. Civanlar and I. Widjaja, eds., vol. 3233, pp. 328–339, SPIE, SPIE, November 1997. 28. J. Karvo and M. Ilvesm¨aki, “Nondeterministic classifier performance evaluation for flow based IP switching,” in High Performance Networking, H. R. V. As, ed., pp. 613–624, Kluwer Academic Publishers, 1998. IFIP TC-6 Eighth International Conference on High Performance Networking (HPN’98) Vienna, Austria, September 21-25,1998. 29. M. Ilvesm¨aki, M. Luoma, and R. Kantola, “Flow classification schemes in traffic–based multilayer IP switching — comparison between conventional and neural approach,” Computer Communications 21, pp. 1184–1194, September 1998.
30. M. Ilvesm¨aki, M. Luoma, and R. Kantola, “Learning vector quantization in flow classification of IP switched networks,” in IEEE 1998 Global Telecommunications Conference, vol. 5, pp. 3017–3022, IEEE, IEEE, November 1998. 31. M. Ilvesm¨aki, “Neural approach to flow classification,” Submitted to IEEE Journal on Selected Areas in Communications , 1998. 32. K. C. Claffy, H.-W. Braun, and G. C. Polyzos, “A parameterizable methodology for internet traffic flow profiling,” IEEE Journal On Selected Areas In Communications 13, pp. 1481–1494, October 1995. 33. K. C. Claffy, Internet Traffic Characterization. PhD thesis, University of California, San Diego, 1994. 34. S. Shenker, “Fundamental design issues for the future internet,” IEEE Journal on Selected Areas in Communications 13, pp. 1176–1188, September 1995. 35. L. Breslan and S. Shenker, “Best–effort versus reservations: A simple comparative analysis,” in Proceedings of SIGCOMM ’98, IEEE/ACM, IEEE/ACM, 1998. 36. P. Newman, W. Edwards, R. Hinden, E. Hoffman, F. Ching Liaw, T. Lyon, and G. Minshall, Ipsilon Flow Management Protocol Specification for IPv4, May 1996. 37. P. P. White, “Rsvp and integrated services in the internet: A tutorial,” IEEE Communications Magazine 35, pp. 100–106, May 1997. 38. U. Schwantag, “An analysis of the applicability of RSVP,” Master’s thesis, Universit¨at Karlsruhe (TH), July 1997. 39. P. Newman, T. Lyon, and G. Minshall, “Flow labelled IP: Connectionless ATM under IP,” in Networld & Interop, Las Vegas, April 1996. 40. T. Kohonen, J. Hynninen, J. Kangas, J. Laaksonen, and K. Torkkola, “LVQ PAK: The learning vector quantization program package,” Tech. Rep. Report A30, Helsinki University of Technology, 1996. 41. T. Kohonen, Self-Organizing-Maps, Springer Series in Information Sciences, Springer–Verlag, 2 ed., 1997. 42. T. Worster and A. Doria, “Levels of aggregation in flow switching networks,” in Electronics Industries Forum, IEEE, 1997.