Pre-print version The final publication is available at Springer via http://doi.org/10.1007/s10994-017-5642-8
Adaptive Random Forests for Evolving Data Stream Classification Heitor M. Gomes1 · Albert Bifet2 · Jesse Read2,3 · Jean Paul Barddal1 · Fabr´ıcio Enembreck1 · Bernhard Pfharinger5 · Geoff Holmes5 · Talel Abdessalem2,4
Received: date / Accepted: date
Abstract Random Forests is currently one of the most used machine learning algorithms in the non-streaming (batch) setting. This preference is attributable to its high learning performance and low demands with respect to input preparation and hyper-parameter tuning. However, in the challenging context of evolving data streams, there is no Random Forests algorithm that can be considered state-ofthe-art in comparison to bagging and boosting based algorithms. In this work, we present the Adaptive Random Forest (ARF) algorithm for classification of evolving data streams. In contrast to previous attempts of replicating Random Forests for data stream learning, ARF includes an effective resampling method and adaptive operators that can cope with different types of concept drifts without complex optimizations for different data sets. We present experiments with a parallel implementation of ARF which has no degradation in terms of classification performance in comparison to a serial implementation, since trees and adaptive operators are independent from one another. Finally, we compare ARF with state-of-the-art algorithms in a traditional test-then-train evaluation and a novel delayed labelling evaluation, and show that ARF is accurate and uses a feasible amount of resources.
Heitor M. Gomes
[email protected] Jesse Read
[email protected] Fabr´ıcio Enembreck
[email protected] Geoff Holmes
[email protected] 1 2 3 4 5
Albert Bifet
[email protected] Jean Paul Barddal
[email protected] Bernhard Pfharinger
[email protected] Talel Abdessalem
[email protected]
PPGIa, Pont´ıcia Universidade Cat´ olica do Paran´ a, Brazil LTCI, T´ el´ ecom ParisTech, Universit´ e Paris-Saclay, France ´ LIX, Ecole Polytechnique, France UMI CNRS IPAL & School of Computing, National University of Singapore, Singapore Department of Computer Science, University of Waikato, New Zealand
2
Heitor M. Gomes1 et al.
Keywords Data Stream Mining, Random Forests, Ensemble Learning, Concept Drift
1 Introduction As technology advances, machine learning is becoming more pervasive in real world applications. Nowadays many businesses are aided by learning algorithms for several tasks such as: predicting users’ interests on advertisements, products or entertainment media recommendations, spam filters, autonomous driving, stock market predictions, face recognition, cancer detection, weather forecast, credit scoring, and many others. Some of these applications tolerate offline processing of data, which can take from a few minutes to weeks, while some of them demand real-time – or near real-time – processing as their source of data is non-stationary, i.e. it constitutes an evolving data stream. While learning from evolving data streams one must be aware that it is infeasible to store data prior to learning as it is neither useful (old data may not represent the current concept) nor practical (data may surpass available memory). Also, it is expected that the learning algorithm is able to process instances at least as fast as new ones are made available, otherwise the system will either collapse due to lack of memory or start discarding upcoming data. This evolving data stream learning setting has motivated the development of a multitude of methods for supervised [35, 32, 13, 20, 27], unsupervised [28, 40, 7], and more recently semi-supervised learning [39, 41, 37]. Ensemble learners are often preferred when learning from evolving data streams, since they are able to achieve high learning performance, without much optimization, and have the advantageous characteristic of being flexible as new learners can be selectively added, updated, reset or removed [32, 14, 13, 20]. Bagging [16], Boosting [25] and Random Forests [17] are classic ensemble methods that achieve superior learning performance by aggregating multiple weak learners. Bagging uses sampling with reposition (i.e. resampling) to train classifiers on different subsets of instances, which effectively increases the variance of each classifier without increasing the overall bias. Boosting iteratively trains classifiers by increasing the weight of instances that were previously misclassified. Random Forests grow decision trees by training them on resampled versions of the original data (similarly to Bagging) and by randomly selecting a small number of features that can be inspected at each node for split. There are multiple versions of Bagging and Boosting that are part of the current state-of-the-art for evolving data stream learning, such as Leveraging Bagging [13] and Online Smooth-Boost [21]. Random Forests for evolving data stream learning is currently represented by the Dynamic Streaming Random Forests [2], which lacks a resampling method, uses a drift detection algorithm with no theoretical guarantees, and was evaluated only on limited synthetic data (1 data set with 7 million instances, 5 attributes and 5 classes). In this work we present the Adaptive Random Forests (ARF) algorithm, a new streaming classifier for evolving data streams. ARF is an adaptation of the classical Random Forest algorithm [17], and can also be viewed as an updated version of previous attempts to perform this adaptation [1, 2]. Therefore, the main novelty of ARF is in how it combines the batch algorithm traits with dynamic
Adaptive Random Forests for Evolving Data Stream Classification
3
update methods to deal with evolving data streams. In comparison to previous adaptations of Random Forest to the stream setting [1, 2], ARF uses a theoretically sound resampling method based on Online Bagging [35] and an updated adaptive strategy to cope with evolving data streams. This adaptive strategy is based on using a drift monitor per tree to track warnings and drifts, and to train new trees in the background (when a warning is detected) before replacing them (when a drift is detected). We avoid bounding ARF to a specific drift detection algorithm to facilitate future adaptations, thus we present experiments using both ADWIN [10] and Page Hinkley Test [36]. The main contributions of this paper are the following: – Adaptive Random Forests (ARF): a new Random Forests algorithm for evolving data stream classification. As shown in the empirical experiments in Section 6, ARF is able to obtain high classification in data streams with different characteristics without further hyper-parameter tuning. Since it is a sustainable off-the-shelf learner for the challenging task of evolving data stream classification, it is going to be useful for both practical applications and as a benchmark for future algorithms proposals in the field. – Drift Adaptation: we propose a drift adaptation strategy that does not simply reset base models whenever a drift is detected. In fact, it start training a background tree after a warning has been detected and only replace the primary model if the drift occurs. This strategy can be adapted to other ensembles as it is not dependent on the base model. – Parallel implementation: we present experiments in terms of CPU time and RAM-Hours of a parallel implementation of ARF. – Comprehensive experimental setting: very often experiments with novel classifiers are focused on the well known test-then-train setting, where it is assumed that labels for an instance are available before the next instance arrives. We discuss the implications of a setting where labels are not readily available (delayed setting) and report experiments based on it. Besides using accuracy to measure classification performance, we also report Kappa M [9] and Kappa Temporal [43], which allow better estimations for data sets with imbalanced classes and temporal dependencies, respectively. – Open source: All data sets and algorithms used in this paper are going to be available as an extension to the MOA software [11], the most popular open source software on data stream mining1 , as a public available benchmark that other researchers can use in their research when developing new algorithms. The remainder of this work is organized as follows. In Section 2 we describe the challenges, characteristics and different settings concerning evolving data streams classification. In Section 3 we briefly discuss related works for data stream classification. Section 4 contains the description of our novel algorithm, i.e. Adaptive Random Forests. In Section 5 the experimental setting and data sets used are described. In Section 6 the results of the experiments are presented and thoroughly discussed. Finally, Section 7 concludes this work and poses directions for future work. 1
https://github.com/hmgomes/AdaptiveRandomForest
Heitor M. Gomes1 et al.
4
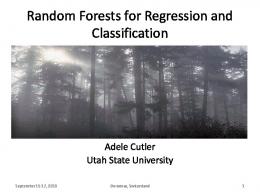
2 Problem Statement Data stream classification, or online classification, is similar to batch classification in the sense that both are concerned with predicting a nominal (class) value y of an unlabeled instance represented by a vector of characteristics x. The difference between online and batch resides in how learning, and predictions, take place. In data stream classification, instances are not readily available for training as part of a large static data set, instead, they are provided as a continuous stream of data in a fast-paced way. Prediction requests are expected to arrive at any time and the classifier must use its current model to make predictions. On top of that, it is assumed that concept drifts may occur (evolving data streams), which damage (or completely invalidate) the current learned model. Concept drifts might be interleaved with stable periods that vary in length, and as a consequence, besides learning new concepts it is also expected that the classifier retains previously learned knowledge. The ability to learn new concepts (plasticity) while retaining knowledge (stability) is known as the stability-plasticity dilemma [33, 26]. In other words, a data stream learner must be prepared to process a possibly infinite amount of instances, such that storage for further processing is possible as long as the algorithm can keep processing instances at least as fast as they arrive. Also, the algorithm must incorporate mechanisms to adapt its model to concept drifts, while selectively maintaining previously acquired knowledge. Formally, a data stream S presents, every u time units, new unlabeled instances xt to the classifier for prediction, such that xt represents a vector of features made available at time t. Most of the existing works on data stream classification assumes that the true class label y t corresponding to instance xt is available before the next instance xt+1 is presented to the learning algorithm, thus the learner can use it for training immediately after it has been used for prediction. This setting may be realistic for problems like short-term stock marketing predictions, although this is not the only meaningful setting for data stream learning. In some real-world problems labels are not readily available, or some are never available, after predictions. In Figure 1 we represent the characteristics of a stream learning problem according to when labels are made available, and briefly discuss them below: – Immediate: labels are presented to the learner before the next instance arrives. – Delayed: labels arrive with delay d which may be fixed or vary for different instances. – Never: labels are never available to the learner. Situations where labels are never available (unsupervised learning) or where some percentage p of labels will never arrive (semi-supervised learning) are outside the scope of this work. Also, when labels are presented in a delayed fashion, it may be the case that they arrive in batches of size greater than one, and the learner must rapidly use these batches to update its model as new instances for prediction might arrive concomitantly. In this paper we evaluate our Adaptive Random Forests (ARF) algorithm in both immediate and delayed settings. As well as comparing the results from both settings in terms of classification accuracy, we also report CPU time and memory consumption (RAM-hours) as estimates of computational resources usage.
Adaptive Random Forests for Evolving Data Stream Classification
5
3 Related Work Ensemble classifiers are often chosen for dealing with evolving data stream classification. Besides ensembles achieving (on average) higher classification performance than single models, this decision is also based on the distinctive trait that ensembles allow selective reset/remove/add/update of base models in response to drifts. Many state-of-the-art ensemble methods for data stream learning [35, 21, 38, 8] are adapted versions of Bagging [16] and Boosting [24]. The standard Online Bagging algorithm uses λ = 1, which means that around 37% of the values output by the Poisson distribution are 0, another 37% are 1, and 26% are greater than 1. This implies that by using Poison(1) 37% of the instances are not used for training (value 0), 37% are used once (value 1), and 26% are trained with repetition (values greater than 1). Subsequent algorithms like Leveraging Bagging [13] and the Diversity for Dealing with Drifts ensemble (DDD) [34] uses different values of λ to use more instances for training the base models (as in Leveraging Bagging) or to induce more diversity to the ensemble by using varying values of λ (as in DDD). One advantage of adapting existing batch ensembles is that they have already been thoroughly studied, thus as long as the adaptation to online learning retains the original method properties it can benefit from previous theoretical guarantees. The first attempt to adapt Random Forests [17] to data stream learning is the Streaming Random Forests [1]. Streaming Random Forests grow binary Hoeffding trees while limiting the number of features considered for split at every node to a random subset of features and by training each tree on random samples (without replacement) of the training data. Effectively, trees are trained sequentially on a fixed number of instances controlled by a hyper-parameter tree window, which means that after a tree’s training is finished its model will never be updated. As a result, this approach is only reasonable for stationary data streams. To cope with evolving data streams, ensembles are often coupled with drift detectors. For instance, Leveraging Bagging [13] and ADWIN Bagging [14] use the ADaptive WINdowing (ADWIN) algorithm [10], while DDD [34] uses Early Drift Detection Method (EDDM) [6] to detect concept drifts. Another approach to deal with concept drifts while using an ensemble of classifiers is to constantly reset low performance classifiers [32, 20, 27]. This reactive approach is useful to recover from gradual drifts, while methods based on drift detectors are more appropriate for rapidly recovering from abrupt drifts. The same authors from Streaming Random Forests [1] presented the Dynamic Streaming Random Forests [2] to cope with evolving data streams. Dynamic
Stream learning
Immediate
Delayed
Never (Unsupervised)
Fixed
Varying
All labeled (Supervised)
Some labeled (Semi-Supervised)
Fig. 1 Stream learning according to labels arrival time
6
Heitor M. Gomes1 et al.
Streaming Random Forests replaces the hyper-parameter tree window by a dynamically updated parameter tree min which is supposed to enforce trees that achieve performance at least better than random guessing. Dynamic Streaming Random Forests also includes an entropy-based drift detection technique that outputs an estimate percentage of concept change. According to this estimated percentage of concept change, more trees are reset. However, if it is 0, at least 25% of the trees are reset whenever a new block of labelled instances is available. Our Adaptive Random Forests (ARF) algorithm resembles Dynamic Streaming Random Forests as both use Hoeffding trees as base learners and include a drift detection operator. The first difference between both algorithms is that ARF simulates sampling with reposition via online bagging [35] instead of growing each tree sequentially on different subsets of data. This is not only a more theoretically sustainable approach, but also has the practical effect of allowing training trees in parallel. Another difference is that Dynamic Streaming Random Forests reset 25% of its trees every new batch of labelled instances, while ARF is based on a warning and drift detection scheme per tree, such that after a warning has been detected for one tree, another one (background tree) starts growing in parallel and replaces the tree only if the warning escalates to a drift. Finally, ARF hyper-parameters are limited to the subset of features size m, the number of trees n and the thresholds that control the drift detection method sensitivity, thus it does not depend on difficult to set hyper-parameters such as the number of instances a tree must be trained on, or the minimum accuracy that a tree has to achieve before training stops.
4 Adaptive Random Forests Random Forests [17] is a widely used learning algorithm in non-stream (batch) classification and regression tasks. Random Forests can grow many trees while preventing them from overfitting by decorrelating them via bootstrap aggregating (bagging [16]) and random selection of features during node split. The original Random Forests algorithm requires multiple passes over input data to create bootstraps for each tree, while for each internal node of every tree a pass over some portion of the original features. In data stream learning it is infeasible to perform multiple passes over input data. Thus, an adaptation of Random Forests to streaming data depends on: (1) an appropriate online bootstrap aggregating process; and (2) limiting each leaf split decision to a subset of features. The second requirement is achieved by modifying the base tree induction algorithm, effectively by restricting the set of features considered for further splits to a random subset of size m, where m < M and M corresponds to the total number of features. To explain our adaptations to address the first requirement we need to discuss how bagging works in non-streaming, and how it is simulated in a streaming setting. In non-streaming Bagging [16], each of the n base models is trained in a bootstrap sample of size Z created by drawing random samples with replacement from the training set. Each bootstrapped sample contains an original training instance K times, where P (K = k) follows a binomial distribution. For large values of Z this binomial distribution adheres to a Poisson(λ = 1) distribution. Based on that, authors in [35] proposed
Adaptive Random Forests for Evolving Data Stream Classification
7
Algorithm 1 RFTree Train. Symbols: λ: Fixed parameter to Poisson distribution; GP : Grace period before recalculating heuristics for split test. 1: function RFTreeTrain(m, t, x, y) 2: k ← P oisson(λ = 6) 3: if k > 0 then 4: l ← F indLeaf (t, x) 5: U pdateLeaf Counts(l, x, k) 6: if InstancesSeen(l) ≥ GP then 7: AttemptSplit(l) 8: if DidSplit(l) then 9: CreateChildren(l, m) 10: end if 11: end if 12: end if 13: end function
the Online Bagging algorithm, which approximates the original random sampling with replacement by weighting instances2 according to a Poisson(λ = 1) distribution. In ARF, we use Poisson(λ = 6), as in Leveraging Bagging [13], instead of Poisson(λ = 1). This “leverages” resampling, and has the practical effect of increasing the probability of assigning higher weights to instances while training the base models. The function responsible for inducing each base tree is detailed in Algorithm 1. Random Forest Tree training (RFTreeTrain) is based on the Hoeffding Tree algorithm (i.e. Very Fast Decision Tree) [23] with some important differences. First, RFTreeTrain does not include any early tree pruning. Second, whenever a new node is created (line 9, Algorithm 1) a random subset of features with size m is selected and split attempts (line 7, Algorithm 1) are limited to these features for the given node. Smaller values of GP 3 (line 6, Algorithm 1) causes recalculations of the split heuristic more frequently and tends to yield deeper trees. In general, deeper trees are acceptable, even desired, in Random Forests. It is acceptable because even if individual trees overfit, the variance reduction from averaging multiple trees prevents the whole forest from overfitting. It is desired as trees with very specialized models tend to differ more from one another. The overall ARF pseudo-code is presented in Algorithm 2. To cope with stationary data streams a simple algorithm where each base tree is trained according to RFTreeTraining function as new instances are available would be sufficient, i.e. the lines 11 to 21 could be ommited from Algorithm 2. However, in ARF we aim at dealing with evolving data streams, thus it is necessary to include other strategies to cope with concept drifts. Concretely, these strategies include drift/warning detection methods, weighted voting and training trees in the background before replacing existing trees. The rest of this section is dedicated to explain and justify these strategies. To cope with evolving data streams a drift detection algorithm is usually coupled with the ensemble algorithm [14, 13]. The default approach is to reset learners immediately after a drift is signaled. This may decrease the ensemble classification 2 In this context, weighting an instance with a value w for a given base model is analogous to training the base model w times with that instance. 3 GP was originally introduce in [23] as n min , we use GP for consistency with the rest of our nomenclature.
8
Heitor M. Gomes1 et al.
Algorithm 2 Adaptive Random Forests. Symbols: m: maximum features evaluated per split; n: total number of trees (n = |T |); δw : warning threshold; δd : drift threshold; c(·): change detection method; S: Data stream; B: Set of background trees; W (t): Tree t weight; P (·): Learning performance estimation function. 1: function AdaptiveRandomForests(m, n, δw , δd ) 2: T ← CreateT rees(n) 3: W ← InitW eights(n) 4: B←∅ 5: while HasN ext(S) do 6: (x, y) ← next(S) 7: for all t ∈ T do 8: yˆ ← predict(t, x) 9: W (t) ← P (W (t), yˆ, y) 10: RF T reeT rain(m, t, x, y) . Train t on the current instance (x, y) 11: if C(δw , t, x, y) then . Warning detected? 12: b ← CreateT ree() . Init background tree 13: B(t) ← b 14: end if 15: if C(δd , t, x, y) then . Drift detected? 16: t ← B(t) . Replace t by its background tree 17: end if 18: end for 19: for all b ∈ B do . Train each background tree 20: RF T reeT rain(m, b, x, y) 21: end for 22: end while 23: end function
performance, since this learner has not been trained on any instance, thus making it unable to positively impact the overall ensemble predictions. Instead of resetting trees as soon as drifts are detected, in ARF we use a more permissive threshold to detect warnings (line 11, Algorithm 2) and create “background” trees that are trained (line 16, Algorithm 2) along the ensemble without influence the ensemble predictions. If a drift is detected (line 15, Algorithm 2) for the tree that originated the warning signal it is then replaced by its respective background tree. ARF is not bounded to a specific detector. To show how different drift detection methods would perform in our implementation, we present experiments with ADWIN and Page Hinkley test (PHT) [36]. Some drift detection algorithms might depend on many parameters (this is the case for PHT), however to simplify our pseudocode we assume only two different parameters one for warning detection δw and another for drift detection δd . Effectively, for ADWIN δw and δd corresponds to the confidence level of the warning and drift detection, respectively, while in PHT each would comprise a set of parameters. In ARF votes are weighted based on the trees’ test-then-train accuracy (line 9, Algorithm 2), i.e., assuming the tree l has seen nl instances since its last reset and correctly classified cl instances, such that cl ≤ nl , then its weight will be cl /nl . Assuming the drift and warning detection methods are precise, then this weighting reflects the tree performance on the current concept. An advantage of using this weighting mechanism is that it does not require a predefined window or fading factor to estimate accuracy as in other data stream ensembles [19, 20, 27]. Similarly to the drift/warning detection method, other voting schemes could be used. To illustrate that we also present experiments using a simple majority vote.
Adaptive Random Forests for Evolving Data Stream Classification
9
4.1 Theoretical Insights Given the maximum features per split m, the number of classes c, the number of leaves l, and the maximum number of possible values per feature v, a single Hoeffding Tree [23] demands O (lmcv) memory assuming memory depends only on the true concept [23]. Given T as the total number of trees and lmax as the maximum number of leaves for all trees, the ARF algorithm, without warning/drift detection, requires O (T lmax mcv), while using drift detection requires the space allocated for each data structure per tree to be allocated. For example, ADWIN [10] requires O(M · log(W/M )), such that M is the number of buckets, while W is maximum numbers per memory word [10], thus ARF using ADWIN for warning and drift detection requires O (T ((M · log(W/M ) + lmax mcv)) of space. The number of background trees is never greater than the maximum number of trees, i.e. |B| ≤ n, thus in the worst case it is necessary to allocate 2n trees concurrently. However the warning/drift detection data structures are not activated in the background trees, thus they require less memory than an actual tree and this also prevents background trees from triggering warnings which could lead to multiple recursive creations of background trees. Finally, in the Hoeffding Tree algorithm [23] authors present a strategy to limit memory usage by introducing a threshold that represents the maximum available memory, in case this threshold is reached then the least promising leaves are deactivated. Assuming pl is the probability that a leaf node is reach, and el is the observed error rate at l, then pl · el is an upper bound on the error reduction achievable by refining l, the least promising leaves are those that achieve the lowest values of pl · el . Originally, Hoeffding Trees also include a pruning strategy that removes poor attributes early on, yet we do not include this operation in ARF as pruning in Random Forests reduces variability.
4.2 Parallelizing the Adaptive Random Forests algorithm The most time consuming task in ensemble classifiers is often training its base learners, exceptions being ensembles in which lazy learners are used. In a data stream configuration, base learners are recurrently responsible for other tasks, for example, keeping track of drift and updating individual data structures that represent their weights. In ARF, training a tree with an instance includes updates to the underlying drift detector, incrementing its estimate test-then-train accuracy, and, if a warning is signalled, starting a new background tree. The aforementioned operations can be executed independently for each tree, thus it is doable to execute them in separate threads. To verify the advantages of training trees in parallel we provide a parallel version ARF[M] and compare it against a standard serial implementation ARF[S]. Anticipating the results presented in the experiments section, the parallel version is around 3 times faster than the serial version and since we are simply paralleling independent operations there is no loss in classification performance, i.e., the results are exactly the same.
10
Heitor M. Gomes1 et al.
5 Experimental Setting In this section we present the experimental setting used. We evaluate the experiments in terms of memory, time and classification performance. Memory is measured in GBs and based on RAM-hours [15], i.e. one GB of memory deployed for one hour corresponds to one RAM-Hour. Processing time is measured in seconds and is based on the CPU time used for training and testing. To assess classification performance we perform 10-fold cross-validation prequential evaluation [9]4 . This evaluation ought not be confused with the standard cross-validation from batch learning, which is not applicable to data stream classification mainly because instances can be strongly time-dependent, thus making it very difficult to organize instances in folds that reflects the characteristics of the data. Three different strategies were proposed in [9] for cross-validation prequential evaluation, namely: k-fold distributed cross-validation, k-fold distributed split-validation and k-fold distributed bootstrap validation. These strategies share the characteristic of training and testing k models in parallel, while they differ on how the folds are built. In our evaluation framework we use the k-fold distributed cross-validation as recommended in [9]. In this strategy, each instance is used for testing in one randomly selected model and for training by all others. Since accuracy can be misleading on data sets with class imbalance or temporal dependencies, so we also report Kappa M and Kappa Temporal. In [9] authors show that Kappa M measure has advantages over Kappa statistic as it has a zero value for a majority class classifier. For data sets that exhibit temporal dependencies it is advisable to evaluate Kappa Temporal since it replaces majority class classifier with the NoChange classifier [43]. All the experiments were performed on machines with 40 cores5 and 200 GB of RAM. Experiments focusing resources usage were run individually and repeated 10 times to diminish perturbations on the results. We evaluate algorithms using the immediate setting and delayed setting. In the delayed setting, the delay was set to 1,000 instances and the classification performance estimates are calculated the same way as they are in the immediate setting, i.e. a 10-fold cross-validation. The only difference is ‘when’ labels become available to train the classifier, i.e., 1,000 instances after the instance is used for prediction. To verify if there were statistically significant differences between algorithms, we performed non-parametric tests using the methodology from [22]. For the statistical test we employ the Friedman test with α = 0.05 and the null hypothesis “there were no statistical difference between given algorithms”, if it is rejected, then we proceed with the Nemenyi post-hoc test to identify these differences. All experiments were configured and executed within the MOA (Massive Online Analysis) framework [11]. We use 10 synthetic and 6 real data sets on our experiments. The synthetic data sets include abrupt, gradual, incremental drifts and one stationary data stream, while the real data sets have been thoroughly used in the literature to assess the classification performance of data stream classifiers and exhibit multiclass, temporal dependences and imbalanced data sets. The 10-fold distributed crossvalidation for SPAM data set with 100 base models did not finish for LevBag, 4 Prequential evaluation is similar to test-then-train, the only difference between them is that prequential includes a fading factor to ‘forget’ old predictions performance. 5 Intel(R) Xeon(R) CPU E5-2660 v3 2.60GHz
Adaptive Random Forests for Evolving Data Stream Classification
11
Table 1 data sets configurations (A: Abrupt Drift, G: Gradual Drift, Im : Incremental Drift (moderate) and If : Incremental Drift (fast)). MF Label and LF Label stands for Most Frequent and Less Frequent class label, respectively. Data set LEDa LEDg SEAa SEAg AGRa AGRg RTG RBFm RBFf HYPER AIRL ELEC COVT GMSC KDD99 SPAM
# Instances 1,000,000 1,000,000 1,000,000 1,000,000 1,000,000 1,000,000 1,000,000 1,000,000 1,000,000 1,000,000 539,383 45,312 581,012 150,000 4,898,431 9,324
# Features 24 24 3 3 9 9 10 10 10 10 7 8 54 11 41 39,917
Type Synthetic Synthetic Synthetic Synthetic Synthetic Synthetic Synthetic Synthetic Synthetic Synthetic Real Real Real Real Real Real
Drifts A G A G A G N Im If If -
# Classes 10 10 2 2 2 2 2 5 5 2 2 2 7 2 23 2
MF Label 10.08% 10.08% 57.55% 57.55% 52.83% 52.83% 57.82% 30.01% 30.01% 50.0% 55.46% 57.55% 48.76% 93.32% 57.32% 74.4%
LF Label 9.94% 9.94% 42.45% 42.45% 47.17% 47.17% 42.18% 9.27% 9.27% 50.0% 44.54% 42.45% 0.47% 6.68% 0.00004% 25.6%
OzaBag and OzaBoost, as the machine run out of memory (we have tried using up to 200GB of memory). Therefore we only report SPAM results in the end of this report to show how ARF performs on a data set with a massive amount of features (see Figure 6). Our goal with this multitude of data sets with different characteristics is to show how ARF performs on each of these scenarios. Table 1 presents an overview of the data sets, while further details can be found in the rest of this section. LED. The LED data set simulates both abrupt and gradual drifts based on the LED generator, early introduced in [18]. This generator yields instances with 24 boolean features, 17 of which are irrelevant. The remaining 7 features corresponds to each segment of a seven-segment LED display. The goal is to predict the digit displayed on the LED display, where each feature has a 10% chance of being inverted. To simulate drifts in this data set the relevant features are swapped with irrelevant features. Concretely, we parametrize 3 gradual drifts each with an amplitude of 50k instances and centered at the 250k, 500k and 750k instance, respectively. The first drift swaps 3 features, the second drift swaps 5 features, and the last one 7 features. LEDg simulates 3 gradual drifts, while LEDa simulates 3 abrupt drifts. SEA. The SEA generator [42] produces data streams with three continuous attributes (f1 , f2 , f3 ). The range of values that each attribute can assume is between 0 and 10. Only the first two attributes (f1 , f2 ) are relevant, i.e., f3 does not influence the class value determination. New instances are obtained through randomly setting a point in a two dimensional space, such that these dimensions corresponds to f1 and f2 . This two dimensional space is split into four blocks, each of which corresponds to one of four different functions. In each block a point belongs to class 1 if f1 + f2 ≤ θ and to class 0 otherwise. The threshold θ used to split instances between class 0 and 1 assumes values 8 (block 1), 9 (block 2), 7 (block 3) and 9.5 (block 4). It is possible to add noise to class values, being the default value 10%, and to balance the number of instances of each class. SEAg simulates 3 gradual drifts, while SEAa simulates 3 abrupt drifts. AGRAWAL. AGRa and AGRg data sets are based on the AGRAWAL generator [4], which produces data streams with six nominal and three continuous
Heitor M. Gomes1 et al.
12
attributes. There are ten different functions that map instances into two different classes. A perturbation factor is used to add noise to the data, both AGRg and AGRa includes 10% perturbation factor. This factor changes the original value of an attribute by adding a deviation value to it, which is defined according to a uniform random distribution. AGRg simulates 3 gradual drifts, while AGRa simulates 3 abrupt drifts. RTG. The Random Tree Generator (RTG) [23] builds a decision tree by randomly selecting attributes as split nodes and assigning random classes to each leaf. After the tree is build, new instances are obtained through the assignment of uniformly distributed random values to each attribute. The leaf reached after a traverse of the tree, according to the attribute values of an instance, determines its class value. RTG allows customizing the number of nominal and numeric attributes, as well as the number of classes. In our experiments we did not simulate drifts for the RTG data set. RBF. RBFm and RBFf data sets were generated using the Radial Basis Function (RBF) generator. This generator creates centroids at random positions and associates them with a standard deviation value, a weight and a class label. To create new instances one centroid is selected at random, where centroids with higher weights have more chances to be selected. The new instance input values are set according to a random direction chosen to offset the centroid. The extent of the displacement is randomly drawn from a Gaussian distribution according to the standard deviation associated with the given centroid. To simulate incremental drifts, centroids move at a continuous rate, effectively causing new instances that ought to belong to one centroid to another with (maybe) a different class. Both RBFm and RBFf were parametrized with 50 centroids and all of them drift. RBFm simulates a “moderate” incremental drift (speed of change set to 0.0001) while RBFf simulates a more challenge “fast” incremental drift (speed of change set to 0.001). HYPER. The HYPER data set simulates an incremental drift and it was generated based on the hyperplane generator [30]. A hyperplane is a flat, n − 1 dimensional subset of that space that divides it into two disconnected parts. It is possible to change a hyperplane orientation and position by slightly changing its relative size of the weights wi . This generator can be used to simulate timechanging concepts, by varying the values of its weights as the stream progresses [12]. HYPER was parametrized with 10 attributes and a magnitude of change of 0.001. Airlines. The Airlines data set was inspired by the regression data set from Ikonomovska6 . The task is to predict whether a given flight will be delayed given information on the scheduled departure. Thus, it has 2 possible classes: delayed or not delayed. This data set contains 539, 383 records with 7 attributes (3 numeric and 4 nominal). Electricity. The Electricity data set was collected from the Australian New South Wales Electricity Market, where prices are not fixed. These prices are affected by demand and supply of the market itself and set every five minutes. The Electricity data set contains 45, 312 instances, where class labels identify the changes of the price (2 possible classes: up or down) relative to a moving average of 6
http://kt.ijs.si/elena_ikonomovska/data.html
Adaptive Random Forests for Evolving Data Stream Classification
13
the last 24 hours. An important aspect of this data set is that it exhibits temporal dependencies. Covertype. The forest covertype data set represents forest cover type for 30 x 30 meter cells obtained from the US Forest Service Region 2 Resource Information System (RIS) data. Each class corresponds to a different cover type. This data set contains 581,012 instances, 54 attributes (10 numeric and 44 binary) and 7 imbalanced class labels. GMSC. The Give Me Some Credit (GMSC) data set7 is a credit scoring data set where the objective is to decide whether a loan should be allowed. This decision is crucial for banks since erroneous loans lead to the risk of default and unnecessary expenses on future lawsuits. The data set contains historical data provided on 150,000 borrowers, each described by 10 attributes. KDD99. KDD’99 data set8 is often used for assessing data stream mining algorithms’ accuracy due to its ephemeral characteristics [3, 5]. It corresponds to a cyber attack detection problem, i.e. attack or common access, an inherent streaming scenario since instances are sequentially presented as a time series [3]. This data set contains 4, 898, 431 instances and 41 attributes. Spam. The Spam Corpus data set was developed in [31] as the result of a text mining process on an online news dissemination system. The work presented in [31] intended on creating an incremental filtering of emails classifying them as spam or ham (not spam), and based on this classification, deciding whether an email was relevant or not for dissemination among users. This data set has 9,324 instances and 39,917 boolean attributes, such that each attribute represents the presence of a single word (the attribute label) in the instance (e-mail).
5.1 Ensembles and Parametrization We compare ARF to state-of-the-art ensemble learners for data stream classification, including bagging and boosting variants with and without explicit drift detection and adaptation. Bagging variants includes Online Bagging (OzaBag) [35] and Leveraging Bagging (LevBag) [13]. Boosting inspired algorithms are represented by Online Boosting (OzaBoost) [35] and Online Smooth-Boost (OSBoost) [21]. The Online Accuracy Updated Ensemble (OAUE) [20] is a dynamic ensemble designed specifically for data stream learning and it is neither based on bagging nor boosting. All experiments use the Hoeffding Tree [23] algorithm with Naive Bayes at the leaves [29] as the base learner, which we refer to as Hoeffding Naive Bayes Tree (HNBT). ARF uses a√variation of HNBT that limits splits to m randomly selected features, where m = M +1 in all our experiments (see Section 6.1 for experiments varying m). An important parameter of the trees is the grace period GP , which is used to optimize training time [23] by delaying calculations of the heuristic measure G used to choose the test features (in this work we use Information Gain). By using smaller values of GP run time (and memory usage) is increased, and also causes trees to grow deeper, which enhances the overall variability of the forest, and consequently ARF’s classification performance. For consistency, we use 7 8
https://www.kaggle.com/c/GiveMeSomeCredit http://kdd.ics.uci.edu/databases/kddcup99/kddcup99.html
14
Heitor M. Gomes1 et al.
the same base learner configuration for all ensembles, i.e., HNBTs with GP = 50. We report statistics for ensembles of 100 members, with the exception of adhoc experiments that focus on CPU Time and RAM-Hours analysis. In the following sections we organize experiments as follows: (1) Comparisons among ARF and some of its variants; (2) Resource usage analysis; and (3) Comparisons of ARF against other state-of-the-art ensembles.
6 Experiments We start our experimentation by comparing variations of ARF to evaluate its sensitivity to parameters (e.g. drift and warning threshold, ensemble size and subspace size) and variations of the algorithm that deactivates some of its characteristics (e.g. drift detection, warning detection, weighted vote). The second set of experiments concerns the evaluation of computational resources usage (CPU time and RAM-Hours). Finally, we present experiments comparing ARF and other stateof-the-art ensemble classifiers in terms of accuracy, Kappa M and Kappa T, for immediate and delayed settings.
6.1 ARF variations Our first analysis is a comparison between 6 variations of the ARF algorithm, each of which ‘removes’ some characteristics from ARF (e.g. drift detection) or has a different parametrization (e.g. uses Page Hinkley drift detection). We did this comparison to illustrate the benefits of using ARF as previously stated in Section 4, and also to discuss how each strategy included in it contributes to the overall classification performance. Table 2 presents the immediate setting 10-fold cross-validation accuracy for these variations. Each variation configuration is as follows: – ARFmoderate : Adopts a parametrization to ADWIN that results in less drifts/ warnings being flagged (δw = 0.0001 and δd = 0.00001). – ARFfast : Uses a parametrization of ADWIN that causes more drifts/warnings to be detected (δw = 0.01 and δd = 0.001). – ARFPHT : Uses Page Hinkley test (PHT) to detected drifts/warnings (δw = 0.005, δd = 0.01, other parameters: λ = 50, α = 0.9999). – ARFnoBkg : Removes only the warning detection and background tree, therefore whenever drifts are detected the associated trees are immediately reset. – ARFstdRF : This is a ‘pure’ online Random Forests version as it deactivates the detection algorithm, does not reset trees and uses majority vote. – ARFmaj : Same configuration as ARFmoderate , but it uses majority vote instead of weighted majority. Without any drift detection (ARFstdRF ) the results on data streams that contains drifts are degraded severely. If trees are reset immediately whenever a drift (ARFnoBkg ) is detected the results improve in 2 real data sets (AIRL and COVT), although we observe better, yet small improvements, when using background trees and drift warnings (ARFmoderate and ARFf ast ), especially on the synthetic data sets. In general, the weighted majority vote is capable of improving performance
Adaptive Random Forests for Evolving Data Stream Classification
15
Table 2 Accuracy in the immediate setting for ARF variations (# learners = 100) Data set LEDa LEDg SEAa SEAg AGRa AGRg RTG RBFm RBFf HYPER Synthetic Avg Synthetic Avg Rank AIRL ELEC COVT GMSC KDD99 Real Avg Real Avg Rank Overall Avg Overall Avg Rank
ARFmoderate 73.72 72.87 89.66 89.24 89.75 84.54 93.91 86.02 72.36 85.16 83.72 2.7 66.26 88.54 92.32 93.55 99.97 88.13 3.6 85.19 3
ARFfast 73.74 72.89 89.66 89.23 89.98 84.6 93.91 86.19 72.46 85.44 83.81 1.8 66.48 89.44 91.85 93.55 99.97 88.26 2.4 85.29 2
ARFPHT 73.57 72.83 89.58 89.25 89.3 84.45 93.91 85.18 70.73 84.87 83.37 4.1 66.03 87.04 91.81 93.55 99.98 87.68 3.6 84.81 3.93
ARFnoBkg 73.73 72.84 89.66 89.24 89.75 84.73 93.89 86.05 72.45 85.42 83.78 2.6 66.66 88.6 92.35 93.55 99.97 88.23 2.8 85.26 2.67
ARFstdRF 66.5 66.36 87.27 87.2 79.88 76.96 93.89 74.96 47.02 78.68 75.87 5.9 65.09 85.81 88.18 93.55 99.97 86.52 4.6 79.42 5.47
ARFmaj 73.71 72.86 89.66 89.24 89.6 84.39 93.89 86.01 72.21 85.16 83.67 3.9 66.23 88.5 92.31 93.55 99.97 88.11 4 85.15 3.93
on almost every data set when we compare ARFmoderate and ARFmaj , such that both use the exact same configuration, but the latter uses majority vote instead of weighted majority. This behavior can be attributed to the variance in weights during periods of drift, such that trees adapted to the current concept shall receive higher weights and obfuscate outdated trees. However, if trees’ weights are overestimated (or underestimated) this can lead to a combination that is inferior to majority vote. Therefore, if it is infeasible to obtain accurate weights, e.g., accuracy is not a reasonable metric for the data set, then it is safer to use majority vote or change the weighting function. ARFmoderate and ARFf ast differ the most on the real data set ELEC (almost 1% accuracy), while the other results are quite similar with a slight advantage for ARFf ast . ARFf ast trains background trees for less time than ARFmoderate as it detects drifts sooner, while ARFnoBkg is an extreme case with no background training at all. In practice, it is necessary to experiment with the warning and drift detector parameters to find the optimal combination for the input data. However, it is less likely that not training the trees before adding them to the forest, even for short periods, would benefit the overall classification performance as the first decisions of a newly created tree are essentially random. On the other hand, it is expected that the improvements obtained by using background tree training might not differ a lot from the not using it, as the most important thing remains resetting trees when drifts occurs as short periods of random decisions can be ‘corrected’ as long as not all trees are undergoing this process at the same time. The best result for RTG is obtained by ARFP HT , however this data set does not contains any drift, thus it is not reasonable to attribute its classification performance to the Page Hinkley Test detector. Also, the difference between ARFmoderate and ARFP HT is after the second decimal place. The Friedman test based on the overall rankings of Table 2 (both synthetic and real data sets) indicated that there were differences among these ARF variations, the follow-up posthoc nemenyi test, presented in Figure 2, indicates that there are no significant differences between ARFf ast , ARFmoderate , ARFP HT , ARFnoBkg and ARFmaj . Further experiments in this work are based on the ARFmoderate configuration and referred to solely as ARF (or ARF[M] or ARF[S] when evaluating resources usage).
Heitor M. Gomes1 et al.
16 CD = 1.947 6
5
4
3
2
ARFstdRF ARFP HT ARFmaj
1
ARFf ast ARFnoBkg ARFmoderate
Fig. 2 ARF variations nemenyi test (95% confidence level) - Immediate setting with 100 learners.
To illustrate the impact of using different values for m (feature subset size) and n (ensemble size) we present 3D plots of six data sets in Figure 3. In Figures 3a, 3b and 3e it was clearly a good choice to use small values of m, however it might not always be the case as observed in Figures 3c, 3d and 3f. In the COVT, GMSC and RTG plots (Figures 3c and 3d and 3f) we observe a trend where increasing the number of features results in classification performance improvements. For RTG we can affirm that this behavior is associated with the fact that the underlying data generator is based on a random assignment of values to instances and a decision tree traversal to determine the class label (see Section 6), which causes that no unique feature, or subset of features (other than the full set), is strongly correlated with the class label. Therefore when each tree is assigned the full set of features, and use only sampling with reposition as the diversity induction, better performance per base tree is achieved, thus the overall ensemble obtains better performance as well. We cannot affirm this same behavior for the real data sets that exhibit similar behavior as RTG (GMSC and COVT) as the underlying data generator is unknown.
6.2 Resources comparison between ARF[S] and ARF[M] To assess the benefits in terms of resources usage we compare ARF[M] and ARF[S] implementations. We report average memory and processing time used to process all data sets for 10, 20, 50 and 100 classifiers. Figures 4a and 4b present the results of these experiments. It is expected that ARF[M] requires more memory than ARF[S], yet since it executes faster its average RAM-Hours is lower in comparison to ARF[S]. Ideally, a parallel implementation on elements that are independent, in our case the trees’ training, must scale linearly in the number of elements if enough threads are available. Although there are some factors that forestall scalability in our implementation of ARF[M], such as the number of available threads, overhead on job creation at every new training instance and operations that are not parallelized (e.g. combining votes). Examining Figures 4a and 4b one can see that when the number of trees is closer or less than 40 (number of available processors) the gains are more prominently, this is expected as there is a limited number of trees that can be trained at once.
6.3 ARF compared to other ensembles This section comprises the comparison of ARF against state-of-the-art ensemble classifiers. First, we report the CPU time and RAM-hours for ensembles with 100
Adaptive Random Forests for Evolving Data Stream Classification
AGRg
Z (accuracy)
size X(
ize)
X (s
)
96.00 94.89 93.78 92.67 91.56 90.44 89.33 88.22 87.11 86.00 90100 80 70 s) 60 ce 10 20 50 bspa 30 40 40 30 %su X (s50iz 60 70 80 e) 90100 1020 Y (
69.00 68.11 67.22 66.33 65.44 64.56 63.67 62.78 61.89 61.00 7
6 5 ) 4 bspaces u s 3 Y (#
Z (accuracy)
67.8 67.2 66.6 66.0 65.4 64.8 64.2 63.6 63.0
Z (accuracy)
88.8 88.2 87.6 87.0 86.4 85.8 1085.2 20 84.6 30 40 50 60 70 80 90 100 2
(a) AGRg
(b) AIRL
RTG
KDD99 93.575 99.97 93.550 99.96 93.525 99.96 93.500 99.95 93.475 99.95 93.450 99.95 93.425 99.95 93.400 99.94 99.94 1093.375 2030 99.94 X (405060 100 90 siz 70 80 e) 80 60 70 s) 90100 20 30 40 50 bspace 10 Y (%su
Z (accuracy)
Z (accuracy)
93.60 93.57 93.53 93.50 93.47 93.43 93.40 93.37 93.33 93.30 9 10 8 6 7aces) 4 5 bsp 3 su 2 Y (%
(d) GMSC
+9.994e1 98.00 0.018 96.67 0.016 95.33 0.014 94.00 0.012 92.67 0.010 91.33 0.008 90.00 0.006 88.67 0.004 87.33 0.002 86.00 1020 10 3040 8 9) 7 50 s 6 ace X (siz 6070 e) 8090 4 5 subsp 100 2 3 Y (#
(e) KDD99
(f) RTG
10
20
ARF[S]
0.1898
0.2
0.0975
0.15
0.0013
0.01
50
ARF[M]
(a) CPU Time
100
0
10
0.0247
0.0415
0.1
5 · 10−2
0.0046
703.14 321.69
133.32
261.44
534.97 0
RAM-Hours (GB-Hour)
1,277.79
0.25
1,000
74.39
CPU Time (s)
1,500
500
Immediate - RAM-Hours
0.2712
Immediate - CPU Time
1,903.6
Fig. 3 ARF: accuracy (immediate) x ensemble size (n) x subspace size (m). Marked lines √ highlights m = M + 1
2,000
95.2 94.4 93.6 92.8 92.0 91.2 90.4 89.6
(c) COVT
Z (accuracy)
GMSC
90100 1
COVT
AIRL
91.00 90.00 89.00 88.00 10 87.00 20 86.00 30 85.00 40 84.00 50 83.00 82.00 60 70 8 9 7 80 5 6paces) 90 100 2 3 4Y (#subs
1020 3040 X (s5060 ize) 70 80
17
20
ARF[S]
50
100
ARF[M]
(b) RAM-Hours
Fig. 4 ARF[M] and ARF[S] comparison in terms of CPU Time and Memory, for 10, 20, 50 and 100 learners.
base models in Tables 3 and 4. Since ARF[M] distributes the training and drift detection among several threads it is unsurprisingly the most efficient in terms of CPU time and memory used. Besides that, we note that ARF[S] outperforms Leveraging Bagging and is close to OAUE in terms of CPU time, while being very similar to others in terms of RAM-Hours, yet worse than OAUE, OzaBag and OSBoost.
97 96 95 94 93 92 91 90 89
Heitor M. Gomes1 et al.
18 Table 3 CPU Time - Immediate setting (# learners = 100) Data set LEDa LEDg SEAa SEAg AGRa AGRg RTG RBFm RBFf HYPER Synthetic Avg Synthetic Avg Rank AIRL ELEC COVT GMSC KDD99 Real Avg Real Avg Rank Overall Avg Avg Rank
ARF[S] 1251.31 1236.91 1293.37 1272.34 1864.13 2002.59 5910.1 1713.33 1711.51 1736.24 1999.18 5 2745.49 73.37 1230.93 189.55 4322.82 1712.43 5.2 1903.6 5.07
ARF[M] 582.31 679.68 490.08 461.99 818.63 821.73 475.57 1133.28 908.26 837.89 720.94 1.8 361.31 31.28 686.08 149.96 2109.04 667.53 2.2 703.14 1.93
OzaBag 1388.63 1244.97 466.27 459.96 710.86 804.08 571.51 1438.18 1389.02 976.29 944.98 2.8 544.75 30.01 1160.96 100.04 2945.59 956.27 2.8 948.74 2.8
OAUE 1659.16 1567.29 684.69 602.56 854 903.02 701.78 1876.86 1815.99 1050.43 1171.58 5 896.69 24.69 1603.41 152.69 4910.54 1517.6 4.6 1286.92 4.87
OzaBoost 1305.46 1154.88 507.4 491.54 828.83 801.96 889.57 1335.2 1273.64 922.73 951.12 3 626.04 34.69 1148.46 83.3 3462.14 1070.93 3.2 991.06 3.07
OSBoost 1778.47 1847.86 493.18 454.83 661.61 690.55 636.74 1822.05 1998.32 927.8 1131.14 3.5 448.45 28.01 1359.04 76.26 7553.36 1893.02 3.4 1385.1 3.47
LevBag 2698.73 2332.57 1431.29 1379.41 3981.14 3225.2 2865.09 3440.54 3517.02 3708.08 2857.91 6.9 4925.71 104.97 2906.84 306.23 4795.75 2607.9 6.6 2774.57 6.8
OzaBoost 0.279 0.244 0.062 0.06 0.329 0.332 0.317 0.177 0.1 0.361 0.226 4.9 0.196 0.001 0.557 0.004 1.335 0.419 5 0.29 4.86
OSBoost 0.162 0.163 0.015 0.014 0.114 0.123 0.065 0.144 0.131 0.116 0.105 3.1 0.216 0 0.178 0.001 0.992 0.278 3.4 0.162 3.07
LevBag 0.056 0.053 0.607 0.341 0.174 0.486 0.15 0.764 0.085 1.075 0.379 4.9 1.425 0.003 0.19 0.067 0.253 0.388 6 0.382 5.43
Table 4 RAM-Hours - Immediate setting (# learners = 100) Data set LEDa LEDg SEAa SEAg AGRa AGRg RTG RBFm RBFf HYPER Synthetic Avg Synthetic Avg Rank AIRL ELEC COVT GMSC KDD99 Real Avg Real Avg Rank Overall Avg Avg Rank
ARF[S] 0.054 0.054 0.219 0.229 0.855 0.856 1.121 0.038 0.01 0.173 0.361 4.8 0.422 0.001 0.002 0.02 0.013 0.092 4.4 0.271 4.86
ARF[M] 0.023 0.038 0.083 0.083 0.098 0.851 0.09 0.025 0.006 0.084 0.138 2.5 0.056 0.001 0.002 0.016 0.007 0.016 2.6 0.098 2.64
OzaBag 0.297 0.264 0.046 0.045 0.361 0.425 0.17 0.236 0.106 0.413 0.236 5.2 0.023 0.001 0.516 0.004 0.499 0.209 3.4 0.227 4.43
OAUE 0.151 0.109 0.022 0.03 0.13 0.096 0.18 0.036 0.008 0.035 0.08 2.6 0.337 0 0.089 0.005 0.039 0.094 3.2 0.084 2.71
The next step in our comparison of ARF to other ensembles is the evaluation of its overall classification performance according to Accuracy, Kappa M and Kappa Temporal. We group experiments per evaluation metric and setting used (delayed or immediate) in Tables 5, 6, 7, 8, 9, and 10. The variations in the rankings from delayed to immediate suggest that ARF is more suitable to the immediate setting. In Table 5 we highlight ARF performance in RBFm and RBFf data sets, both containing incremental drifts. As previously mentioned √ in Section 6.1 ARF cannot obtain good results in RTG while using only m = M + 1 features, this is emphasized when comparing ARF against other ensembles as ARF consistently obtains the worst results in RTG. ARF performs well on SEAa and SEAg , however
Adaptive Random Forests for Evolving Data Stream Classification
19
these results are not related to the random selection of features as SEA generator has only 3 features and each tree ends up using 3 features per split9 . Analysing the results from Kappa Temporal in Table 7 we observed that none of the classifiers were able to surpass the baseline (NoChange classifier [43]) on the COVT data set. This characteristic is accentuated on the experiments using the delayed setting displayed in Table 10, where algorithms also failed to overcome the baseline on the ELEC data set as well. Probably, using a temporally augmented wrapper, as suggested in [43], would aid this problem for the immediate setting, although it is unclear if it would solve the problem on the delayed setting. Through analysis of Kappa M on Tables 6 and 9 we observed that differences in accuracy that appeared to be not very large are actually highlighted in Kappa M, for example, ARF and OzaBoost in data set AIRL achieved 66.26% and 60.83% accuracy, respectively, in terms of Kappa M ARF achieves 24.24% while OzaBoost only 12.05%. We report only statistical tests based on the average rank of accuracy, since ranks did not change among Accuracy, Kappa M and Kappa Temporal. Concretely, we used the results from Tables 5 and 8. The Friedman test indicates that there were significant differences in the immediate and delayed setting. We proceeded with the Nemenyi post-hoc test to identify these differences, which results are plotted in Figure 5. The statistical tests for the immediate setting indicates that there are no significant differences between ARF, LevBag, OSBoost and OUAE. While differences in the delayed setting are less prominent, including OzaBag to the aforementioned classifiers. This suggests that sometimes the active drift detection techniques are less impactating in the delayed setting as ARF and LevBag have their overall performance degraded when training is delayed. This is especially true for incremental drifts, as drift signals (and warning signals in ARF) are delayed and action is taken to accommodate a potentially already outdated concept. This is observable by analysing the accuracy drop from the immediate to delayed setting for ARF and LevBag in RBFf (Tables 5 and 8). There is not much variation with respect to ranking changes while comparing the synthetic data sets results between the immediate and delayed settings. The only change is that OzaBag swaps rankings with LevBag in RBFf , which effectively boosts the overall OzaBag ranking. In the real data sets the variations are more prominent, such that ARF surpasses OzaBoost in the ELEC data set for the delayed setting, however ARF loses 1 average rank from the immediate to the delayed setting in the real data sets. Finally, OzaBag, OAUE and OSBoost improved their overall average rankings from the immediate results to the delayed results, while ARF, OzaBoost and LevBag, decreased their classification performances. Surprisingly, GMSC results improved in the delayed setting in comparison to those obtained in the immediate setting, this is better observable while comparing the Kappa M results from Tables 6 and 9 for the GMSC data set.
9
After rounding SEAg
√
3 + 1 to the closest integer we obtain 3, such that m = M for SEAa and
Heitor M. Gomes1 et al.
20 Table 5 Accuracy - Immediate setting (# learners = 100). Data set LEDa LEDg SEAa SEAg AGRa AGRg RTG RBFm RBFf HYPER Synthetic Avg Synthetic Avg Rank AIRL ELEC COVT GMSC KDD99 Real Avg Real Avg Rank Overall Avg Overall Avg Rank
ARF 73.72 72.87 89.66 89.24 89.75 84.54 93.91 86.02 72.36 85.16 83.72 2.5 66.26 88.54 92.32 93.55 99.97 88.13 1.6 85.19 2.2
OzaBag 69.18 69.17 87.19 87.12 82.83 79.26 97.2 62.62 38.33 80.2 75.31 5.4 64.96 82.51 84.05 93.52 99.93 84.99 4.8 78.54 5.2
OAUE 73.35 72.55 88.77 88.26 90.67 85.29 97 83.69 56.19 87.67 82.34 2.9 65.35 86.37 92.26 93.55 2.61 68.03 4 77.57 3.27
OzaBoost 68.88 69.57 88.21 87.87 88.49 84.39 95.97 36.23 26.16 85.93 73.17 5.1 60.83 90.17 93.83 92.64 99.01 87.29 3.8 77.88 4.67
OSBoost 72.53 72.47 89.15 88.92 91.02 87.73 97.25 65.84 42.38 87.88 79.52 2.6 65.62 87.05 86.34 92.95 99.93 86.38 3.8 81.8 3
LevBag 73.92 73.22 88.36 89.08 89.17 83.4 97.53 84.89 58.28 87.45 82.53 2.5 63.38 88.53 93.08 93.54 99.96 87.7 3 84.25 2.67
OSBoost 69.43 69.35 72.93 72.37 80.96 73.98 93.48 51.19 17.67 75.72 67.71 2.6 22.82 69.49 73.35 -5.54 99.85 51.99 3.8 62.47 3
LevBag 70.98 70.2 70.96 72.77 77.04 64.8 94.14 78.42 40.39 74.85 71.45 2.5 17.8 72.97 86.5 3.4 99.92 56.12 3 66.34 2.67
Table 6 Kappa M - Immediate setting (# learners = 100). Data set LEDa LEDg SEAa SEAg AGRa AGRg RTG RBFm RBFf HYPER Synthetic Avg Synthetic Avg Rank AIRL ELEC COVT GMSC KDD99 Real Avg Real Avg Rank Overall Avg Overall Avg Rank
ARF 70.75 69.8 74.21 73.16 78.26 67.22 85.56 80.03 60.51 70.27 72.98 2.5 24.24 73 85 3.51 99.93 57.14 1.6 67.7 2.2
OzaBag 65.7 65.68 68.05 67.86 63.61 56.04 93.36 46.59 11.88 60.33 59.91 5.4 21.34 58.79 68.87 3 99.83 50.37 4.8 56.73 5.2
OAUE 70.35 69.45 71.98 70.71 80.22 68.82 92.89 76.69 37.41 75.29 71.38 2.9 22.21 67.89 84.89 3.46 -128.21 10.05 4 50.94 3.27
OzaBoost 65.36 66.13 70.59 69.75 75.6 66.9 90.45 8.89 -5.5 71.81 58 5.1 12.05 76.84 87.96 -10.17 97.68 52.87 3.8 56.29 4.67
Table 7 Kappa Temporal - Immediate setting (# learners = 100). Data set LEDa LEDg SEAa SEAg AGRa AGRg RTG RBFm RBFf HYPER Synthetic Avg Synthetic Avg Rank AIRL ELEC COVT GMSC KDD99 Real Avg Real Avg Rank Overall Avg Overall Avg Rank
ARF 70.79 69.83 78.31 77.44 77.57 66.61 87.51 81.92 64.24 70.32 74.45 2.5 19.56 21.86 -55.59 48.29 -140.48 -21.27 1.6 42.54 2.2
OzaBag 65.74 65.72 73.13 72.98 62.45 55.22 94.26 51.63 20.2 60.4 62.17 5.4 16.48 -19.24 -222.99 48.01 -471.44 -129.84 4.8 -1.83 5.2
OAUE 70.38 69.48 76.43 75.37 79.59 68.24 93.86 78.89 43.32 75.33 73.09 2.9 17.39 7.08 -56.81 48.26 -769385.24 -153873.86 4 -51242.56 3.27
OzaBoost 65.41 66.17 75.27 74.57 74.82 66.29 91.74 17.49 4.46 71.87 60.81 5.1 6.61 32.99 -24.91 40.95 -7717.89 -1532.45 3.8 -470.28 4.67
OSBoost 69.46 69.39 77.23 76.77 80.35 73.5 94.37 55.8 25.44 75.77 69.81 2.6 18.05 11.73 -176.49 43.43 -416.24 -103.9 3.8 11.9 3
LevBag 71.01 70.23 75.58 77.11 76.31 64.15 94.93 80.45 46.02 74.9 73.07 2.5 12.71 21.78 -40.07 48.22 -177.84 -27.04 3 39.7 2.67
Adaptive Random Forests for Evolving Data Stream Classification
21
Table 8 Accuracy - Delayed setting (# learners = 100). Data set LEDa LEDg SEAa SEAg AGRa AGRg RTG RBFm RBFf HYPER Synthetic Avg Synthetic Avg Rank AIRL ELEC COVT GMSC KDD99 Real Avg Real Avg Rank Overall Avg Overall Avg Rank
ARF 73.57 72.76 89.57 89.17 89.58 84.48 93.85 83.45 29.12 84.85 79.04 2.5 64.93 75.36 83.79 93.55 98.72 83.27 2.6 80.45 2.53
OzaBag 69.01 69.03 87.11 87.03 82.67 79.11 97.13 56.69 28.76 79.97 73.65 5.1 64.82 74.27 78.34 93.52 99.53 82.1 4 76.47 4.73
OAUE 73.19 72.44 88.68 88.17 90.48 85.14 96.94 80.42 28.69 87.27 79.14 2.9 65.13 74.63 84.81 93.55 2.4 64.1 2.9 74.13 2.9
OzaBoost 68.72 69.44 88.14 87.81 88.31 84.28 95.91 34.7 26.12 85.57 72.9 5.1 60.63 71.07 84.48 92.67 98.62 81.49 5.2 75.76 5.13
OSBoost 72.37 72.36 89.06 88.84 90.84 87.59 97.19 59.72 28.43 87.39 77.38 2.6 65.32 72.91 80.11 92.96 99.59 82.18 3.4 78.98 2.87
LevBag 73.76 73.16 88.27 89 88.98 83.3 97.46 81.81 27.82 87.06 79.06 2.8 62.74 74.61 85.09 93.55 99.38 83.07 2.9 80.4 2.83
OSBoost 69.25 69.24 72.7 72.16 80.58 73.7 93.34 42.45 -2.26 74.74 64.59 2.6 22.14 36.19 61.19 -5.41 99.05 42.63 3.4 57.27 2.87
LevBag 70.79 70.13 70.74 72.57 76.65 64.6 93.98 74.02 -3.13 74.07 66.44 2.8 16.35 40.17 70.9 3.51 98.55 45.9 2.8 59.59 2.8
OSBoost 69.28 69.27 77.04 76.59 79.96 73.21 94.24 47.89 7.4 74.79 66.97 2.6 17.33 -84.65 -302.69 43.5 -3103.47 -685.99 3.4 -184.02 2.87
LevBag 70.83 70.16 75.39 76.94 75.9 63.94 94.79 76.47 6.61 74.12 68.52 2.8 11.17 -73.1 -201.9 48.28 -4775.42 -998.19 2.8 -287.05 2.8
Table 9 Kappa M - Delayed setting (# learners = 100). Data set LEDa LEDg SEAa SEAg AGRa AGRg RTG RBFm RBFf HYPER Synthetic Avg Synthetic Avg Rank AIRL ELEC COVT GMSC KDD99 Real Avg Real Avg Rank Overall Avg Overall Avg Rank
ARF 70.58 69.68 73.97 72.99 77.92 67.1 85.42 76.35 -1.27 69.64 66.24 2.5 21.26 41.96 68.36 3.53 97 46.42 2.6 59.63 2.53
OzaBag 65.51 65.53 67.84 67.65 63.25 55.71 93.2 38.11 -1.78 59.88 57.49 5.1 21.03 39.38 57.72 3.08 98.89 44.02 4 53 4.73
OAUE 70.16 69.32 71.77 70.5 79.82 68.5 92.74 72.03 -1.88 74.5 66.74 2.9 21.72 40.23 70.35 3.51 -128.69 1.42 3 44.97 2.93
OzaBoost 65.18 65.99 70.41 69.59 75.21 66.68 90.3 6.7 -5.56 71.09 57.56 5.1 11.61 31.85 69.71 -9.69 96.76 40.05 5.2 51.72 5.13
Table 10 Kappa Temporal - Delayed setting (# learners = 100). Data set LEDa LEDg SEAa SEAg AGRa AGRg RTG RBFm RBFf HYPER Synthetic Avg Synthetic Avg Rank AIRL ELEC COVT GMSC KDD99 Real Avg Real Avg Rank Overall Avg Overall Avg Rank
ARF 70.62 69.72 78.11 77.29 77.21 66.49 87.39 78.59 8.3 69.7 68.34 2.5 16.39 -67.95 -228.29 48.29 -10010.79 -2048.47 2.6 -637.26 2.53
OzaBag 65.55 65.57 72.95 72.8 62.08 54.89 94.12 43.96 7.83 59.95 59.97 5.1 16.14 -75.4 -338.67 48.05 -3644.79 -798.93 4 -226.33 4.73
OAUE 70.2 69.35 76.25 75.19 79.17 67.91 93.72 74.67 7.74 74.54 68.88 2.9 16.87 -72.95 -207.64 48.28 -771004.82 -154244.05 3 -51368.77 2.93
OzaBoost 65.23 66.02 75.11 74.43 74.42 66.06 91.61 15.52 4.41 71.15 60.39 5.1 6.14 -97.18 -214.26 41.21 -10839.44 -2220.7 5.2 -699.97 5.13
Heitor M. Gomes1 et al.
22
CD = 1.947 6
5
OZABAG OZABOOST OAUE
4
3
2
CD = 1.947 1
6
ARF LEVBAG OSBOOST
(a) Immediate setting with 100 learners.
OZABOOST OZABAG
5
4
3
2
1
ARF LEVBAG OSBOOST OAUE
(b) Delayed setting with 100 learners.
Fig. 5 Nemenyi test with 95% confidence level.
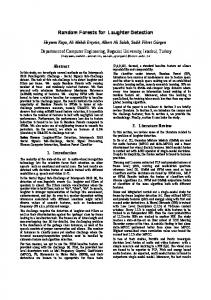
Focusing on the real world data sets it is clear that ARF consistently obtains the best results or at least results that could be considered reasonable in contrast with other algorithms that even though achieve very good results, sometimes fail to obtain a reasonable model (e.g. OAUE and OzaBoost on KDD99). In Figure 6 some of the experiments from the immediate setting (see Tables 5, 6 and 7). ARF is able to consistently achieve superior accuracy on RBFm (Figure 6c), which exhibits a moderate incremental drift. In LEDg (Figure 6a) and AGRa (Figure 6b), ARF obtain a reasonable performance, even though it was not the method with highest accuracy it was able to adapt to the abrupt and gradual drifts. Figures 6d and 6e are interesting as the analysis solely focused on accuracy would indicate that classifiers stabilize after 200 thousand instances, however by observing the Kappa M plot it is visible that classifiers are actually improving relatively to the majority class classifier. Similarly GMSC and KDD99 plots in Figures 6f, 6g, 6h and 6i shows that by using Kappa M on an imbalanced data set the differences between methods are intensified. Finally, on SPAM only ARF, OAUE and OSBoost could finish executing, the results in Figures 6j, 6k and 6l shows that Kappa M for OSBoost is below -100 (not showing in the plot) indicating that it is not a reasonable choice for this data set. Also, in every plot from SPAM it is observable that OAUE and OSBoost are degrading over time while ARF maintains its performance stable.
7 Conclusion In this work we have presented the Adaptive Random Forests (ARF) algorithm, which enables the Random Forests algorithm for evolving data stream learning. We provide a serial and a parallel implementation of our algorithm, ARF[S] and ARF[M], respectively, and show that the parallel version can process the same amount of instances in reasonable time without any decrease in the classification performance. As a byproduct and additional contribution of this work we discuss stream learning according to when labels are available (immediate and delayed settings). We also remark that several of the techniques that were implemented on ARF can be used in other ensembles, such as warning detection and background trees. We use a diverse set of data sets to show empirical evidence that ARF obtains good results in terms of classification performance (Accuracy, Kappa M and Kappa Temporal) and reasonable performance resources usage, even for the sequential version ARF[S], when compared to other state-of-the-art ensembles. The classification performance experiments are further divided into the usual imme-
Adaptive Random Forests for Evolving Data Stream Classification
LED - accuracy
23
AGRAWAL abrupt - accuracy
100
RBF moderate - accuracy
90
74 85
72
95
68 66
accuracy
80 accuracy
accuracy
70 90
75 70
64
ARF OzaBag OAUE
62 60
200
85
OzaBoost OSBoost LevBag 400 600 # instances (thousands)
800
(a) Accuracy LEDg
200
OzaBoost OSBoost LevBag 800
60
1000
75
800
1000
GMSC - accuracy
96 94
20
65
accuracy
10 Kappa M
accuracy
OzaBoost OSBoost LevBag 400 600 # instances (thousands)
30
70
0 10
60
ARF OzaBag OAUE
55 50
100
20
OzaBoost OSBoost LevBag
ARF OzaBag OAUE
30
200 300 400 # instances (thousands)
40
500
100
(d) Accuracy AIRL
92 90 88
OzaBoost OSBoost LevBag 200 300 400 # instances (thousands)
86
500
(e) Kappa M AIRL
GMSC - Kappa M
10
ARF OzaBag OAUE 20
40
KDD99 - accuracy
80
80
20
60
Kappa M
10 accuracy
120
140
KDD99 - Kappa M 100
30
OzaBoost OSBoost LevBag 60 80 100 # instances (thousands)
(f) Accuracy GMSC
100
0
Kappa M
200
(c) Accuracy RBFm
AIRLINES - Kappa M
40
ARF OzaBag OAUE
65
400 600 # instances (thousands)
(b) Accuracy AGRa
AIRLINES - accuracy
80
ARF OzaBag OAUE
80
1000
40
60 40
40
ARF OzaBag OAUE
50 20
40
OzaBoost OSBoost LevBag 60 80 100 # instances (thousands)
120
0
140
(g) Kappa M GMSC
Kappa M
accuracy
0
4000
40
SPAM - Kappa M
ARF OAUE 2000
4000
5000 6000 # instances
7000
8000
(j) Accuracy SPAM
9000
4000
SPAM - Kappa Temporal
50
0
0
50
OSBoost 3000
2000 3000 # instances (thousands)
100
50
20
1000
OzaBoost OSBoost LevBag
(i) Kappa M KDD99
50
60
ARF OzaBag OAUE
20
2000 3000 # instances (thousands)
100
80
0 1000
1000
OzaBoost OSBoost LevBag
(h) Accuracy KDD99
SPAM - accuracy
100
ARF OzaBag OAUE
20
Kappa Temporal
60
100 1000
ARF OAUE 2000
OSBoost 3000
4000
5000 6000 # instances
7000
8000
9000
(k) Kappa M SPAM
100 1000
ARF OAUE 2000
OSBoost 3000
4000
5000 6000 # instances
7000
8000
9000
(l) Kappa T SPAM
Fig. 6 Sorted plots of Accuracy, Kappa M and Kappa T over time (100 classifiers per ensemble). Solid and dashed vertical lines indicates drifts and drift window start/end, respectively.
diate setting and the delayed setting. From these experiments we highlight the following characteristics of ARF: – ARF obtains good classification performance on both delayed and immediate settings, especially on real world data sets; – ARF can be used to process data streams with a large number of features, such as SPAM data set with almost fourty thousand features, using a relatively small number of trees (in our experiments 100);
24
Heitor M. Gomes1 et al.
– ARF can train its base trees in parallel without affecting its classification performance. This is an implementation concern, but it is useful to investigate and make it available along with the algorithm as scalability is often a concern; – ARF might not be able to improve on data sets where all features are necessary to build a reasonable model (such as RTG). In future work we will investigate how to optimize the run-time performance of ARF by limiting the number of detectors, as it is wasteful to maintain several detectors that often trigger at the same time. Another possibility is to implement a big data stream version of ARF, as we show in this work that each tree can be trained independently (the most time consuming task) without affecting the classification performance. Besides enhancing execution performance we are also interested in investigating the development of a semi-supervised strategy to deal with different real world scenarios, which might also lead to better performance on the delayed setting.
Acknowledgments This project was partially financially supported by the Coordena¸ca ˜o de Aperfei¸coamento de Pessoal de N´ıvel Superior (CAPES) through the Programa de Suporte a ` P´ os-Gradua¸c˜ ao de Institui¸c˜ oes de Ensino Particulares (PROSUP) program for Doctorate students.
References 1. Hanady Abdulsalam, David B Skillicorn, and Patrick Martin. Streaming random forests. In Database Engineering and Applications Symposium, 2007. IDEAS 2007. 11th International, pages 225–232. IEEE, 2007. 2. Hanady Abdulsalam, David B Skillicorn, and Patrick Martin. Classifying evolving data streams using dynamic streaming random forests. In Database and Expert Systems Applications, pages 643–651. Springer, 2008. 3. Charu C. Aggarwal, Jiawei Han, Jianyong Wang, and Philip S. Yu. A framework for clustering evolving data streams. In Proceedings of the 29th International Conference on Very Large Data Bases - Volume 29, VLDB ’03, pages 81–92. VLDB Endowment, 2003. 4. Rakesh Agrawal, Tomasz Imilielinski, and Arun Swani. Database mining: A performance perspective. IEEE Trans. on Knowledge and Data Engineering, 5(6):914–925, Dec. 1993. 5. Amineh Amini and Teh Ying Wah. On density-based data streams clustering algorithms: A survey. Journal of Computer Science and Technology, 29(1):116–141, 2014. ´ 6. Manuel Baena-Garc´ıa, Jos´ e del Campo-Avila, Ra´ ul Fidalgo, Albert Bifet, Ricard Gavald` a, and Rafael Morales-Bueno. Early drift detection method. 2006. 7. Jean Paul Barddal, Heitor Murilo Gomes, and Fabr´ıcio Enembreck. Sncstream: A social network-based data stream clustering algorithm. In Proceedings of the 30th Annual ACM Symposium on Applied Computing, SAC ’15, pages 935–940, New York, NY, USA, 2015. ACM. 8. Alina Beygelzimer, Satyen Kale, and Haipeng Luo. Optimal and adaptive algorithms for online boosting. pages 2323–2331, 2015. 9. Albert Bifet, Gianmarco de Francisci Morales, Jesse Read, Geoff Holmes, and Bernhard Pfahringer. Efficient online evaluation of big data stream classifiers. In Proceedings of the 21th ACM SIGKDD International Conference on Knowledge Discovery and Data Mining, pages 59–68. ACM, 2015. 10. Albert Bifet and Ricard Gavald` a. Learning from time-changing data with adaptive windowing. In SIAM, 2007.
Adaptive Random Forests for Evolving Data Stream Classification
25
11. Albert Bifet, Geoff Holmes, Richard Kirkby, and Bernhard Pfahringer. Moa: Massive online analysis. The Journal of Machine Learning Research, 11:1601–1604, 2010. 12. Albert Bifet, Geoff Holmes, Richard Kirkby, and Bernhard Pfahringer. MOA Data Stream Mining - A Practical Approach. Centre for Open Software Innovation, 2011. http://heanet.dl.sourceforge.net/project/moa-datastream/documentation/ StreamMining.pdf. 13. Albert Bifet, Geoff Holmes, and Bernhard Pfahringer. Leveraging bagging for evolving data streams. In PKDD, pages 135–150, 2010. 14. Albert Bifet, Geoff Holmes, Bernhard Pfahringer, Richard Kirkby, and Ricard Gavald` a. New ensemble methods for evolving data streams. In Proceedings of the 15th ACM SIGKDD international conference on Knowledge discovery and data mining, pages 139– 148. ACM SIGKDD, Jun. 2009. 15. Albert Bifet, Geoffrey Holmes, Bernhard Pfahringer, and Eibe Frank. Fast perceptron decision tree learning from evolving data streams. In PAKDD, Lecture Notes in Computer Science, pages 299–310. Springer, 2010. 16. Leo Breiman. Bagging predictors. Machine Learning, 24(2):123–140, 1996. 17. Leo Breiman. Random forests. Machine learning, 45(1):5–32, 2001. 18. Leo Breiman, Jerome Friedman, Charles J Stone, and Richard A Olshen. Classification and regression trees. CRC press, 1984. 19. Dariusz Brzezi´ nski and Jerzy Stefanowski. Accuracy updated ensemble for data streams with concept drift. In Hybrid Artificial Intelligent Systems, pages 155–163. Springer, 2011. 20. Dariusz Brzezinski and Jerzy Stefanowski. Combining block-based and online methods in learning ensembles from concept drifting data streams. Information Sciences, 265:50–67, 2014. 21. Shang-Tse Chen, Hsuan-Tien Lin, and Chi-Jen Lu. An online boosting algorithm with theoretical justifications. In Proceedings of the International Conference on Machine Learning (ICML), June 2012. 22. Janez Demˇsar. Statistical comparisons of classifiers over multiple data sets. Journal of Machine Learning Research, 7:1–30, December 2006. 23. Pedro Domingos and Geoff Hulten. Mining high-speed data streams. In Proceedings of the sixth ACM SIGKDD international conference on Knowledge discovery and data mining, pages 71–80. ACM SIGKDD, Sep. 2000. 24. Yoav Freund and Robert E Schapire. A decision-theoretic generalization of on-line learning and an application to boosting. Journal of computer and system sciences, 55(1):119–139, 1997. 25. Yoav Freund, Robert E Schapire, et al. Experiments with a new boosting algorithm. In ICML, volume 96, pages 148–156, 1996. 26. Jo˜ ao Gama, Indre Zliobaite, Albert Bifet, Mykole Pechenizkiy, and Abderlhamid Bouchachia. A survey on concept drift adaptation. ACM Computing Surveys, 46(4):44:1– 44:37, March 2014. 27. Heitor Murilo Gomes and Fabr´ıcio Enembreck. Sae2: Advances on the social adaptive ensemble classifier for data streams. In Proceedings of the 29th Annual ACM Symposium on Applied Computing (SAC), SAC 2014, pages 199–206. ACM, March 2014. 28. Sudipto Guha, Nina Mishra, Rajeev Motwani, and Liadan O’Callaghan. Clustering data streams. In Foundations of computer science, 2000. proceedings. 41st annual symposium on, pages 359–366. IEEE, 2000. 29. Geoffrey Holmes, Richard Kirkby, and Bernhard Pfahringer. Stress-testing hoeffding trees. In PKDD, pages 495–502, 2005. 30. Geoff Hulten, Laurie Spencer, and Pedro Domingos. Mining time-changing data streams. In Proceedings of the seventh ACM SIGKDD international conference on Knowledge discovery and data mining, pages 97–106. ACM, 2001. 31. Ioannis Katakis, Grigorios Tsoumakas, Evangelos Banos, Nick Bassiliades, and Ioannis Vlahavas. An adaptive personalized news dissemination system. Journal of Intelligent Information Systems, 32(2):191–212, 2009. 32. Jeremy Z Kolter, Marcus Maloof, et al. Dynamic weighted majority: A new ensemble method for tracking concept drift. In Data Mining, 2003. ICDM 2003. Third IEEE International Conference on, pages 123–130. IEEE, 2003. 33. Chee Peng Lim and Robert F Harrison. Online pattern classification with multiple neural network systems: an experimental study. IEEE Transactions on Systems, Man, and Cybernetics, Part C: Applications and Reviews, 33(2):235–247, 2003.
26
Heitor M. Gomes1 et al.
34. Leandro L. Minku and Xin Yao. Ddd: A new ensemble approach for dealing with concept drift. IEEE Transactions on Knowledge and Data Engineering, 24(4):619–633, 2012. 35. N.C. Oza. Online bagging and boosting. In Systems, Man and Cybernetics, 2005 IEEE International Conference on, volume 3, pages 2340–2345 Vol. 3, Oct 2005. 36. ES Page. Continuous inspection schemes. Biometrika, 41(1/2):100–115, 1954. 37. Brandon Shane Parker and Latifur Khan. Detecting and tracking concept class drift and emergence in non-stationary fast data streams. In Twenty-Ninth AAAI Conference on Artificial Intelligence, 2015. 38. Raphael Pelossof, Michael Jones, Ilia Vovsha, and Cynthia Rudin. Online coordinate boosting. In Computer Vision Workshops (ICCV Workshops), 2009 IEEE 12th International Conference on, pages 1354–1361. IEEE, 2009. 39. Xiangju Qin, Yang Zhang, Chen Li, and Xue Li. Learning from data streams with only positive and unlabeled data. Journal of Intelligent Information Systems, 40(3):405–430, 2013. 40. Carlos Ruiz, Ernestina Menasalvas, and Myra Spiliopoulou. Discovery Science: 12th International Conference, DS 2009, Porto, Portugal, October 3-5, 2009, chapter C-DenStream: Using Domain Knowledge on a Data Stream, pages 287–301. Springer Berlin Heidelberg, Berlin, Heidelberg, 2009. 41. Tegjyot Singh Sethi, Mehmed Kantardzic, Elaheh Arabmakki, and Hanquing Hu. An ensemble classification approach for handling spatio-temporal drifts in partially labeled data streams. In Information Reuse and Integration (IRI), 2014 IEEE 15th International Conference on, pages 725–732. IEEE, 2014. 42. W Nick Street and YongSeog Kim. A streaming ensemble algorithm (sea) for large-scale classification. In Proceedings of the seventh ACM SIGKDD international conference on Knowledge discovery and data mining, pages 377–382. ACM, 2001. ˇ 43. Indr˙e Zliobait˙ e, Albert Bifet, Jesse Read, Bernhard Pfahringer, and Geoff Holmes. Evaluation methods and decision theory for classification of streaming data with temporal dependence. Machine Learning, 98(3):455–482, 2015.