TIC-STH 2009
Adaptive Segmentation and Normalization of Breathing Acoustic Data of Subjects with Obstructive Sleep Apnea Hisham Alshaer1,4, Geoff R. Fernie2, Ervin Sejdić3,4, T. Douglas Bradley1,5 1
The Sleep Research Laboratory, 2 Toronto Rehabilitation Institute, Toronto, Ontario, Canada 3 Bloorview Research Institute, Toronto, Ontario, Canada 4 Institute of Biomaterials and Biomedical Engineering, University of Toronto, Toronto, Ontario, Canada 5 The Centre for Sleep Medicine and Circadian Biology, University of Toronto, Toronto, Ontario, Canada Emails:
[email protected],
[email protected],
[email protected], and
[email protected] Abstract—Breath sounds in patients with obstructive sleep apnea are very dynamic and variable signals due to their versatile nature. In this paper, we present an adaptive segmentation algorithm for these sounds. The algorithm divides the breath sounds into segments with similar amplitude levels. As the first step, the proposed scheme creates an envelope of the signal characterizing its long term amplitude variations. Then, K-means clustering is iteratively applied to detect borders between different segments in the envelope, which will then be used to segment and normalize the original signal.
place as frequently as 100 times per one hour of sleep. Apneas alternate with periods of ventilation, in which breathing resumes. In standard respiratory practice, the most common signals used to monitor and diagnose OSA are nasal airflow and thoracic and abdominal movement. These signals are quasistationary over periods longer than three minutes and show minimal change in overall amplitude over extended time duration. In such signals, individual apneas can be identified as a gradual decrease in amplitude of the waveform (decrescendo pattern) followed by a complete cessation in the case of apnea, or a reduction in the signal amplitude in the case of hypopnea. On the other hand, breath sounds in patients with OSA are very dynamic with wide variations in amplitude due to alternating periods of loud snoring, mild snoring, snorting (intermittent snoring), normal breathing, hyperventilation, and silence during apneas. Apneas manifest as a reduction in amplitude of the sound waveform with a pattern similar to that described above. However, during the ventilatory phase between apneas, the amplitude of breath sounds tends to vary widely over time during sleep due to the varying nature of breath sounds. Apneas that occur in the middle of low level sounds will, therefore, be difficult to detect by an examiner. Therefore, in order for an examiner to detect the apneas in a breath sound waveform, the waveform should be normalized in amplitude. This normalization could be performed manually by detecting and normalizing segments that have stable ventilatory levels. However, such a process is time consuming, subject to examiner error, and requires medical personnel familiar with OSA and breath sounds. Another approach is fixed segmentation in which the waveform is sliced into short segments, presumably quasi-stationary and with a fixed length. Then each segment is normalized independently. This method results in segmentation of data regardless of the degree of stationary. Thus, this method can yield false positives, i.e., more segments than actually exist.
Keywords- sleep apnea, acoustic analysis, breath sounds, adaptive segmenation, K-means clustering
I.
INTRODUCTION
Acoustic analysis of respiratory sounds has gained an increasing role in the diagnosis of respiratory disorders because of advances in techniques for sound measurement and signal analysis [1]. For example, respiratory sound analysis has been used to identify pathological respiratory sounds, such as wheezes and crackles [2-8]. In addition, sound recording during sleep has also been used to diagnose obstructive sleep apnea (OSA) [9, 10]; a condition characterized by repeated cessation of airflow due to complete (apnea) or partial (hypopnea) collapse of the pharynx. For simplicity, both types of events will be referred to as apnea in this paper. These events alternate with episodes of hyperventilation (i.e. hyperpnea) during which loud snoring occurs [11]. Recurrent apneas lead to intermittent hypoxia that provokes arousal from sleep and sleep fragmentation, thus, causing restless sleep and excessive daytime sleepiness. Repetitive apneas and intermittent hypoxia also elicit repetitive surges in blood pressure at night and increase the risk of developing daytime hypertension, atherosclerosis, heart failure, and stroke, independently of other risk factors [12-16]. An individual apnea is usually 10-30 seconds in duration and can take
978-1-4244-3878-5/09/$25.00 ©2009 IEEE
279
Authorized licensed use limited to: The University of Toronto. Downloaded on April 19,2010 at 16:00:53 UTC from IEEE Xplore. Restrictions apply.
III.
Furthermore, whenever a segment is created and normalized, a distortion can be introduced at the border with other segments, potentially resulting in some information loss. Therefore, the best method is an adaptive segmentation algorithm that segments the data only when the characteristics of signal change significantly.
The propsed algorithm consists of two major parts that are described in the subsequent sections. A. Signal Envelope Creation The first step of the proposed algorithm is the creation of so-called low-pass envelopes. These signal envelopes are created to detect overall changes in the amplitude of the acquired signal, x(n), of length N, where 0 ≤ n ≤ N-1. Envelopes are calculated in such a way that sharp transitions in the signal’s levels are maintained because they represent the borders of varying segments.
When developing an automatic normalization algorithm, two important challenges specific to the breath sounds of patients with OSA are encountered. First, this segmentation process should not detect apnea as an individual segment. In such a case, the waveform within the apnea region will be normalized according to its own level, which will equalize it with the adjacent signals and make it impossible to detect. The second challenge is the presence of transient breath sounds that could interfere with the segmentation. Those considerations should be dealt with when normalizing the breath sounds signal of patients with OSA. The aim of this work, therefore, is to develop a segmentation algorithm that automatically segments and normalizes breath sounds data of subjects with OSA. II.
PROPOSED ALGORITHM
As a first step, we divide the signal into K nonoverlapping segments, where the number of segments can be calculated as:
⎢N ⎥ K =⎢ ⎥ ⎣L⎦
(1)
with L being the desired segment length and the symbol ⌊⌋ representing the greatest integer function. In this paper, L = 11025 points (or 500 ms according to the sampling rate). This interval is chosen in order to preserve the fine details of individual breaths, such as inspiratory and expiratory phases. The shortest breathing phase is 1.5 seconds in rapid normal breathing (20 breaths/minute); thus, the bin size (500 ms) provides sufficient resolution to capture breathing details. On the other hand, extending this interval might result in the merging of apnea borders and thus, a false representation of the apnea’s duration. Additionally, transient high amplitude outliers produces by coughing and snorting (transient load snoring) will merge with the surrounding signals, thus making it more difficult to remove them in the next steps. It should be noted that N is not necessarily an integer multiple of K, making it necessary to omit some of the data points. Therefore, the data are trimmed from the end of the signal. The trimmed version of the signal is denoted by xtr(m) where 0 ≤ m ≤ M-1 and M = KL ≤ N. As a second step, we form a vector e RK of square values whose points are assigned as follows:
DATA ACQUISITION
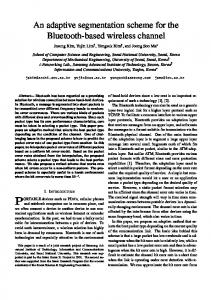
Data were collected from patients referred for an overnight polysomnography. Breath sounds were recorded by a cardoid condenser microphone (Audi-Technica condenser microphone, Model PRO 35x). The microphone’s cardoid polar pattern reduces pickup of sounds from the sides and rear, improving isolation of the sound source. The microphone was embedded in the center of a loose fitting plastic frame held in place with a headstrap in a fixed location, approximately 3 cm in front of the subject’s face. Digitized sound data were transferred to a computer using a USB preamplifier and audio interface (M-Audio, Model MobilePre USB) with a sampling rate of 22050 Hz and a resolution of 16 bits. The external audio interface was preferred over the regular built-in audio adapters because of its superior signal to noise (S/N) ratio which is 91 dB. Fig. 1 shows an 80 second sound recording with a representative apnea.
e( k ) =
( k +1) L −1
∑
j = kL
xtr2 ( j )
for 0 ≤ k ≤ K − 1
(2)
The resulting signal is a train of peaks, each representing a breathing phase, which are interrupted by apneas as illustrated in a 3 minutes recording in Fig. 2. Wide variations in overall signal levels take place over periods longer than 15 minutes as will be illustrated in later sections. Outliers can result in high amplitude spikes in the breathing envelope. These outliers can affect subsequent statistics and therefore should be removed. In order to remove these outliers, e(k) is segmented into short overlapping intervals, s(p), of length P with each segment representing a pattern of breathing. Mathematically, s ( p ) = e( p + rq ) (3)
Fig. 1: A representative apnea, approximately 20 seconds in duration, is shown as an interruption of the breath sounds waveform. AU=arbitrary units.
280 Authorized licensed use limited to: The University of Toronto. Downloaded on April 19,2010 at 16:00:53 UTC from IEEE Xplore. Restrictions apply.
its neighbours, then it is a local maximum. Using the detected local maxima, we interpolate points between these maxima using piecewise cubic Hermite interpolation [17]. The resultant curve connects individual breath peaks and represents short-term changes in signal level and is conventionally called the Short-term Envelope (SE) as shown in Fig. 4(D). Next, we created another envelope that traces long term changes that bypass local variations. This envelope is created by implementing the same method described for finding the SE to get the long-term envelope, by interpolating the maxima of the SE. The resultant envelope is normalized in amplitude and is referred to as the level envelope (LE) as shown in Fig. 4(D). Normalization in this work is achieved by dividing any time series by the value at the 95th percentile rather than the maximum in order to avoid dividing by local outliers that could result at the borders of segments. Only the LE will be used in the next step.
Fig. 2: e(k) waveform showing alternating periods of ventilation and apneas, where peaks represent breaths. where 0 ≤ p ≤ P-1, q is the amount of the overlap, 0 ≤ r ≤ R-1 and R=⌊K/q⌋. In this case, the presence of apneas and various breathing patterns should be considered. In patients with severe sleep apnea (i.e., worst case scenario), breathing is present only 50% of the time and is interrupted by apneas that are approximately 30 seconds in duration. Thus, approximately every 60 seconds, an alternating pattern of apnea and ventilation occurs repeatedly during sleep and this constitutes the basic unit of segmentation. In order to incorporate multiple patterns, we chose a segmentation window of 180 seconds (=3x60). This window slides in 30 second intervals. In other words, P = 360 points and q = 60 points, given that each second of e(k) is represented by 2 points (from section III, A). Next, for each segment we calculate the standard deviation:
σs =
1 P
B. Segmentation and Normalization The second part of the algorithm essentially determines the number of segments having variable amplitude in the LE, if any. The first step is to evaluate the standard deviation of the LE:
σ LE =
(4)
p =0
where µs is the mean value of the segment. Using the standard deviation, we form a segment-based indicator sequence, Is(p), based on the following rule
I s ( p) =
{
1 0
K −1
∑ ( LE (k ) − µ k =0
LE
)2
if s ( p ) > 4σ s otherwise
Using this segment-based sequence, we form a reassigned version of e(k) using the following rule
er ( p + rq) =
{
4σ s e ( p + rq )
(5)
where µLE is the mean value of the LE(k). This is based on the fact that an obstructive apneic event is the reduction of breathing effort below than 50%. Thus, the change in overall signal level of the ventilatory components should be sufficiently less variable than 50% for apneas to be easily distinguishable. Therefore, we select a threshold of σLE =0.10 for an acceptably smooth LE. Accordingly, if σLE>0.10, the LE amplitude has strong variations and is subject to normalization, as in the signals in Figs. 4-6.
p −1
∑ ( s( p) − µs )2
1 K
if I s( p )=1 otherwise
It should be pointed out that, in the case of consecutive points that indicate the presence of outliers, the duration of these consecutive points should not exceed 5% of the length of the segment. Otherwise, the detected strong amplitude deviations are not considered outliers, but could still contain physiologically relevant information. The next step is to trace the overall changes in waveform’s level by interpolating its maxima. To find the local maxima points, we compare each value of er(k) against its neighbouring values. If this value is greater than both of
Fig. 3: Flow chart of the segmentation algorithm
281 Authorized licensed use limited to: The University of Toronto. Downloaded on April 19,2010 at 16:00:53 UTC from IEEE Xplore. Restrictions apply.
The main challenge in this work is the lack of knowledge about the number of clusters in a given breathing recording and the length of each cluster. A cluster, in this case, is a segment with a stable/similar ventilatory level. Therefore, in order to find clusters with different amplitude levels, we implement the K-means clustering technique [18] to segment the LE into two initial clusters. Once the initial clustering is done, the amplitudes of both clusters are normalized (by the 95th percentile). The normalized segments of LE are joined again to form a new LE. σLE is then tested and this process is repeated iteratively until σLE is less than 0.10. This process is illustrated in Fig 3. Therefore, in each iteration, a new
segment is found and normalized until all the segments of LE reach an equal level. Clustering LE into only 2 clusters in each iteration overcomes the absence of knowledge about the number of clusters. Moreover, implementing K-means overcomes the challenge of locating the points at which the signals change in level and determining the length of each segment. Subsequently, the points at which the LE was segmented using this method are considered the borders between segments with variable levels in the original acoustic data, which are then normalized independently.
Fig. 4: Illustration of different stages of the algorithm on an artificial set of data simulating breathing interrupted by apneas. A. e(k) waveform with the SE, LE envelopes. B. Dashed line shows the location of the border between different segments found in the 1st iteration and resultant e(k) after normalization based on that border. C. The location of all borders after the 2nd iteration and e(k) after the 2nd normalization. IV.
the same level as the ventilatory and apneic components of all other segments, so that all apneas became equally visible. It is worthwhile mentioning that the method used to create the envelope of e(k) guarantees the preservation of sharp transitions in a signal’s level, such as that occurring at five minutes in Fig 4(A). Other methods such as low-pass filtering might results in losing this information.
RESULTS AND DISCUSSION
To test the adaptive segmentation algorithm, a simulated breathing waveform was created. Fig. 4(A) shows the simulated e(k) 15 minutes in duration, with a breathing rate of 15 breaths/minute and 22 apneas interrupting breathing. Each apnea is 20 seconds in duration. The signal has three different levels. The algorithm needed two iterations to segment and to normalize the signal. As a result, all ventilatory and apneic components of each segment reached
Fig. 5 shows the performance of this algorithm on a 30minute recording from a patient with sleep apnea. Fig. 5(A) represents e(k) of the raw acoustic data. This signal has
282 Authorized licensed use limited to: The University of Toronto. Downloaded on April 19,2010 at 16:00:53 UTC from IEEE Xplore. Restrictions apply.
variable levels and several outliers. The apneas can be spotted in the high level segment of the signal (between 1222 minutes), however, apneas in low level segments such as between 10-12 minutes, are obscured. Fig. 5(B) shows the signal after removing the outliers. Some high amplitude breath sounds were also truncated in this process; however, this does not affect the performance of the algorithm and does not obscure apneas. The locations of the borders suggested by the segmentation algorithm are also shown as dashed lines. Fig. 5(C) shows the final result after the normalization of each segment separately by its 95th percentile. Apneas appear as valleys in waveforms 30 seconds in duration or more. They are approximately equal in amplitude and depth and are distributed all through the recording. This forms a pattern that better facilitates the identification of apneas compared to the original shown in Fig 5(A).
The ultimate purpose of studying breath sounds is not only to enable the detection of individual apneas but also to distinguish subjects who have sleep apnea from those who do not. Therefore, although the design of this algorithm has considered apneic breathing, it is important for such a segmentation algorithm to function universally, without corrupting data of subjects who do not have the disease. Fig. 6 presents the segmentation and normalization of e(k) taken from a subject who does not have sleep apnea. By comparing Fig 5(C) and Fig 6(C), the subject with sleep apnea can be distinguished from the subject who does not by the presence of characteristic troughs 30 seconds in duration. This shows that the algorithm did not create artifacts in the normal breathing recording that could be mistaken for apneas.
Fig. 5: Segmentation and normalization of 30 minute recordings from a patient with severe sleep apnea. A. e(k) waveform with variable levels and several outliers. B. e(k) after removing the outliers. Dashed lines represent the location at which the signal is segmented as found by the algorithm. C. e(k) after normalization.
Fig. 6: Segmentation and normalization of 30 minute recordings from a patient without sleep apnea from the same stages as those included in Fig 5.
283 Authorized licensed use limited to: The University of Toronto. Downloaded on April 19,2010 at 16:00:53 UTC from IEEE Xplore. Restrictions apply.
V.
[7]
CONCLUSIONS
This paper presented a K-means based algorithm for adaptive segmentation of breath sounds of patients with sleep apnea. The proposed scheme was based on long term variations in signal levels. We have shown that the proposed algorithm is capable of segmenting waveforms of breath sounds with an unknown number of segments and of an unknown duration.
[8]
ACKNOWLEDGMENT
[9]
This research is supported by an operating grant (MOP82731) from the Canadian Institutes of Health Research, an infrastructure grant from the Research Hospital Fund of the Canada Foundation for Innovation, and by the Toronto Rehabilitation Institute which receives funding under the Provincial Rehabilitation Research Program from the Ministry of Health and Long Term Care of the Province of Ontario. This research is also supported by the Ministry of Research and Innovation of Ontario through the Ontario Research and Commercialization Program, Technology Transfer Toronto. Dr. Alshaer is a recipient of the Natural Sciences and Engineering Research Council of Canada (NSERC) postgraduate scholarship. A patent application has been filed for the application of the algorithm to the analysis of breath sounds.
[10]
[11]
[12] [13]
REFERENCES
[1]
[2]
[3]
[4]
[5]
[6]
E. C. Guler, B. Sankur, Y. P. Kahya, and S. Raudys, "Two-stage classification of respiratory sound patterns," Comput Biol Med, vol. 35, pp. 6783, Jan 2005. B. Sankur, E. Cagatay Guler, and Y. P. Kahya, "Multiresolution biological transient extraction applied to respiratory crackles," Comput Biol Med, vol. 26, pp. 25-39, Jan 1996. B. Sankur, Y. P. Kahya, E. C. Guler, and T. Engin, "Comparison of AR-based algorithms for respiratory sounds classification," Comput Biol Med, vol. 24, pp. 67-76, Jan 1994. M. Yeginer and Y. Kahya, "Modeling of pulmonary crackles using wavelet networks," Conf Proc IEEE Eng Med Biol Soc, vol. 7, pp. 7560-3, 2005. I. Sen and Y. Kahya, "A multi-channel device for respiratory sound data acquisition and transient detection," Conf Proc IEEE Eng Med Biol Soc, vol. 6, pp. 6658-61, 2005. R. Jane, S. Cortes, J. A. Fiz, and J. Morera, "Analysis of wheezes in asthmatic patients during spontaneous respiration," Conf Proc IEEE Eng Med Biol Soc, vol. 5, p. 3836, 2004.
[14]
[15] [16]
[17] [18]
J. A. Fiz, R. Jane, A. Homs, J. Izquierdo, M. A. Garcia, and J. Morera, "Detection of wheezing during maximal forced exhalation in patients with obstructed airways," Chest, vol. 122, pp. 186-91, Jul 2002. J. A. Fiz, R. Jane, J. Izquierdo, A. Homs, M. A. Garcia, R. Gomez, E. Monso, and J. Morera, "Analysis of forced wheezes in asthma patients," Respiration, vol. 73, pp. 55-60, 2006. U. R. Abeyratne, A. S. Wakwella, and C. Hukins, "Pitch jump probability measures for the analysis of snoring sounds in apnea," Physiological Measurement, vol. 26, pp. 779-98, 2005. J. J. Sola-Soler, R. Fiz, J.A. Morera, J. , "Pitch analysis in snoring signals from simple snorers and patients with obstructive sleep apnea," Conf Proc IEEE Eng Med Biol Soc, vol. 2, pp. 1527-1528, 2002. T. Young, M. Palta, J. Dempsey, J. Skatrud, S. Weber, and S. Badr, "The occurrence of sleepdisordered breathing among middle-aged adults," N Engl J Med, vol. 328, pp. 1230-5, Apr 29 1993. R. S. Leung and T. D. Bradley, "Sleep apnea and cardiovascular disease," Am J Respir Crit Care Med, vol. 164, pp. 2147-65, Dec 15 2001. F. J. Nieto, T. B. Young, B. K. Lind, E. Shahar, J. M. Samet, S. Redline, R. B. D'Agostino, A. B. Newman, M. D. Lebowitz, and T. G. Pickering, "Association of sleep-disordered breathing, sleep apnea, and hypertension in a large communitybased study. Sleep Heart Health Study," Jama, vol. 283, pp. 1829-36, Apr 12 2000. E. Shahar, C. W. Whitney, S. Redline, E. T. Lee, A. B. Newman, F. Javier Nieto, G. T. O'Connor, L. L. Boland, J. E. Schwartz, and J. M. Samet, "Sleepdisordered breathing and cardiovascular disease: cross-sectional results of the Sleep Heart Health Study," Am J Respir Crit Care Med, vol. 163, pp. 19-25, Jan 2001. T. D. Bradley and J. S. Floras, "Sleep apnea and heart failure: Part I: obstructive sleep apnea," Circulation, vol. 107, pp. 1671-8, Apr 1 2003. M. Arzt, T. Young, L. Finn, J. B. Skatrud, and T. D. Bradley, "Association of sleep-disordered breathing and the occurrence of stroke," Am J Respir Crit Care Med, vol. 172, pp. 1447-51, Dec 1 2005. F. N. Fritsch and R. E. Carlson, "Monotone piecewise cubic interpolation," SIAM Journal on Numerical Analysis, vol. 17, pp. 238-246, 1980. D. J. C. MacKay, Information Theory, Inference & Learning Algorithms. Cambridge, UK: Cambridge University Press, 2003.
284 Authorized licensed use limited to: The University of Toronto. Downloaded on April 19,2010 at 16:00:53 UTC from IEEE Xplore. Restrictions apply.