Adding Animation and Interactivity to Finance Courses with Learning Objects
Ernest N. Biktimirov* Faculty of Business Brock University 500 Glenridge Ave. St. Catharines, Ontario, Canada L2S 3A1 905.688.5550 x 3843
[email protected]
Linda B. Nilson Office of Teaching Effectiveness and Innovation Clemson University 445 Brackett Hall Clemson, SC 29634 864.656.4542
[email protected]
Published in the Journal of Financial Education 33, Summer 2007, 36-48.
*
Contact author. We thank seminar participants at the 2004 Financial Management Association and 2004 Financial Education Association meetings for helpful comments. We are very grateful to learning technology developers Bryan Gough and especially Giulia Forsythe. Biktimirov gratefully acknowledges the financial support of an instructional technology grant from Brock University.
Adding Animation and Interactivity to Finance Courses with Learning Objects
ABSTRACT In this paper we explain and assess the benefits of integrating an interactive, online learning object into a finance course. Animation and interactivity combined with the accessibility of the online learning objects create a rich, student-controlled learning environment. We present a new learning object on portfolio expected return, risk, and diversification and measure its effect on student learning in an introductory finance course. Our findings indicate that using the learning object seems to improve the performance of low-GPA students.
I hear and I forget. I see and I remember. I do and I understand. – Confucius INTRODUCTION The introductory finance course can be notoriously challenging to teach. Most students come into it with a great deal more fear about the difficulty of the subject matter than motivation and interest in learning it. Business majors in particular are often taking the course only as a requirement (Krishnan, Bathala, Bhattacharya, and Ritchey, 1999). Because so many students enroll in it, the instructors who teach it face large, heterogeneous classes representing widely differing educational backgrounds and learning styles. Introductory finance, then, is fertile ground for experimenting with pedagogical innovations because: 1) its instructors need all the
1
help they can get and 2) the course provides a challenging setting for testing the appeal and effectiveness of new teaching tools. Indeed, undergraduate finance courses at all levels include disengaged students and have inspired many fresh, creative, and even humorous pedagogical approaches: David Lettermantype “Top Ten Lists” (Becker, 1993); entertaining metaphors (Ardalan, 1998); popular music (Kane, 1999); English proverbs (Biktimirov, 2003); and the graphic syllabus (Biktimirov and Nilson, 2003). Additional research supports the importance of teaching to students’ learning style preferences. Filbeck and Smith (1996) find that the students’ performance in undergraduate finance courses is affected by their learning styles. They suggest that instructors use diverse teaching strategies and exam questions that will give all students a fair opportunity to learn and show their knowledge. Gentry and Helgesen (1999) go so far as to recommend that finance instructors identify their own and their students’ learning styles to help both parties adjust to or bridge the differences. The past several years have seen the emergence of a “visual culture,” in which knowledge and information are increasingly communicated in graphical forms and decreasingly in written form (Fischman, 2001). Today’s traditional-age students, raised on television, interactive video games, and occasionally interactive web sites, mark the forefront of this new culture. Consequently, graphical presentations of course materials are likely to become more central and even expected course components, especially in distance education and computer-assisted instruction (Cyrs, 1997). Those in the instructional technology business also anticipate the proliferation and domination of visually-based, interactive learning:
2
Visualization will be at the heart of knowledge and understanding in the coming decades. In a world characterized by increasingly complex information sets, our ability to acquire and understand them quickly will become central to effective performance. As visualization technologies evolve, we can expect to see the spoken and written word, our dominant modes of sharing today, eclipsed by many instances of 3-dimensional, highly interactive and compelling models, simulation and augmented realities…. Dynamic models and simulations enable us to learn much more rapidly and effectively than we might through conventional means of training…. (Hodgins, 2000). As the first section below documents, finance has made only limited use of innovative online teaching resources, many of which intelligently combine graphics and interactivity. The second section takes a close look at learning objects, what they are and their powerful potential as teaching and learning resources. The literature review on effective teaching and learning, which takes into account learning styles, strongly suggests that learning objects should be very effective teaching tools, especially for today’s learners. Then we make our contribution to the finance education literature: proposing a learning object for finance courses and assessing its educational benefits. We find that low-GPA students gain the most by using the object, while high-GPA students seem to grasp new material regardless of the presentation format.
USES OF TECHNOLOGY IN TEACHING FINANCE Technology has made possible powerful, innovative instructional tools. Its pedagogical potential is regularly highlighted in the Journal of Economic Education’s new section on online teaching resources (Sosin and Becker, 2000). The projects presented there demonstrate the power of new technology for effective teaching. For example, Kaufman and Kaufman (2002) display
3
interactive web graphs for economic principles, and Gerdes (2000) showcases interactive online modules that enhance undergraduate learning. While many disciplines have been using online teaching materials for years, finance started slowly with online instruction. For example, Detzler’s (2000) examination of 114 finance-course web sites shows that they contain materials primarily from printed sources. Drawing from a national survey, Saunders (2001) reports that only 51 percent of faculty have a homepage for their courses. A more recent survey by Cudd, Tanner, and Lipscomb (2004) shows more widespread use of the internet/intranet in finance instruction. Since assistant professors are taking the lead, the authors project that more and more finance faculty will be using advanced classroom technology in the future. This paper may help fuel this trend by being the first, to the best of our knowledge, to offer innovative pedagogical applications of online learning objects.
LEARNING OBJECTS: INNOVATIVE INSTRUCTIONAL TOOLS Learning object is a relatively new term applicable to a wide variety of (typically) web-based learning tools and aids. Its formal definition inspires debate (Ip, Morrison, and Currie, 2001), but a few key elements repeat across most proposed definitions: A learning object is a digital resource that is reusable and instructional in intent. Being “digital,” learning objects can be highly interactive, easily shared over the Internet, and simultaneously used by any number of people. “Reusable” means that the object can be used in different learning contexts to serve multiple purposes, possibly across disciplines. “Instructional” indicates that the object’s purpose is to enable learners, even those with a limited background, to master complex content. Other widely (but not universally) accepted characteristics of a learning object are that it provides a
4
self-contained, independent lesson and that it is amenable to integration with large collections of content, both digital and traditional. In addition, this independent lesson represents a small unit of learning, typically requiring five to 20 minutes to complete. Finally, a learning object is usually considered to be self-describing, meaning that it contains, in addition to the content, a description of itself including the topic, learning objectives, author and date of creation. This type of information, referred to as metadata, facilitates retrieval of the object in a search. Like a label on a food container, it describes the contents of the object and how to use it effectively in combination with other materials. Like atoms or Lego® building blocks, learning objects can be linked together in different ways to create customized learning experiences (Wiley, 2000). Learning objects promise to provide a number of teaching and learning benefits. First, they accommodate students who don’t easily learn in the traditional classroom. Standard textbooks, PowerPoint presentations, and lectures primarily target students with more verbal, rational, logical, sequential and analytic types and styles, but these are not very effective for students with non-verbal learning styles, such as “visual,” “kinesthetic,” “concrete,” “global” and “intuitivefeeling” (Theall, 1997). Learning objects more effectively communicate knowledge to these students because they usually offer 1) visual representations of the lesson, and 2) an interactive, learner-controlled experience. Indeed, a considerable body of research finds that visual representations facilitate learning for the majority of students (e.g., Levie and Lentz, 1982; Vekiri, 2002). And they do so in a number of ways: by supplying a ready-made global organization for assimilating and storing new knowledge; by clearly laying out the relationships among different concepts and dimensions; by helping students see new relationships among ideas; by spatially highlighting the most central and core points; by reinforcing verbally presented material; and by presenting material in an
5
easy-to-retain form (Nilson, 2001). Further, visuals serve these purposes concisely, with a minimum of words. They especially benefit students with little or no prior knowledge of the subject matter, like those in introductory courses (Mayer and Gallini, 1990). Second, the interactivity that most learning objects offer allows students to explore how changes in input (independent) variables affect the final result (dependent variable). Students can “play” with an object as long as they want, in any manner they want, and can usually watch the changes occur before their very eyes. Plus, the move-at-your-own-speed nature of a learning object permits all students, even those with slower learning rates, to fully comprehend new material before moving on. They can study a concept or principle at their own pace, on their own schedule, and repeat each step as many times as necessary. This is hands-on, experiential learning at its finest, and the evidence for its effectiveness is overwhelming (McKeachie, 2002; Nilson, 2003). It is putting students in charge of their own learning in a wholly engaging, learner-controlled experience, thereby fostering life-long learning skills and attitudes. Do learning objects, especially the most powerful ones, measure up to their instructional promise? Unfortunately, the literature on learning objects only assumes and does not directly assess their effectiveness. Howard-Rose and Harrigan (2003) surveyed student and faculty perceptions of the value of various learning objects in nine Ontario university courses. While both students and faculty saw educational value in the learning objects, this study did not assess the impact of objects on students’ grades or any other objective measure of learning. But ours does. We compare the student performance in a class that uses the object with the student performance in a traditional class. To the best of our knowledge, ours is the first empirical test of the learning benefits of a learning object.
6
THE
LEARNING
OBJECT:
PORTFOLIO
EXPECTED
RETURN,
RISK,
AND
DIVERSIFICATION A major topic in finance is how the correlation between two assets and the weight of each asset affect the risk and returns of a two-asset portfolio. Usually the topic first appears in introductory finance, then resurfaces in higher-level courses such as Investments and Portfolio Management. We offer a new learning object that visually and interactively teaches the dynamics involved. It is entitled “Portfolio Expected Return, Risk, and Diversification Learning Object” and is located at the following web address: http://www.brocku.ca/learningobjects/flash_content/LO/Portfolio.html. This learning object is also available from the Co-operative Learning Object Exchange (CLOE) database at http://cloe.on.ca/. CLOE is a collaborative project of 17 Ontario universities to develop and share interactive, multimedia learning resources. Our proposed learning object was developed using Macromedia Flash. This software allows for interactivity, giving students the opportunity to vary the parameters and play with the relationships among the variables. In addition, Macromedia Flash does not require a broadband connection for fast downloading of learning objects. Therefore, given its vector capabilities and the anytime-anyplace nature of the Internet, students can explore the effects of the correlation between two stocks and their relative weights on portfolio return and standard deviation as many times as necessary. Animation and interactivity combine with the accessibility of the web to create a rich, student-customized learning environment. The object consists of three self-contained main modules. The first module, “Tutorial,” presents a self-study guide, while two other modules, “Tool” and “Game,” allow users to experiment interactively with different asset correlations and weights and to see how these
7
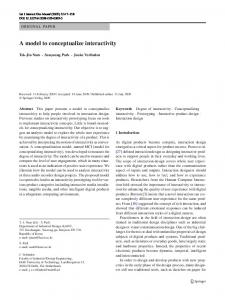
variables impact the risk and return of a two-asset portfolio. Also within the learning object are three auxiliary modules with the “Introduction,” “References,” and “Credits.” The learning object starts with an “Introduction” module that fulfills two functions. First, it explicates the learning objectives. This information helps instructors use the object productively and furnishes metadata for easy storage, search, and retrieval. Second, it offers navigation tips, such as when one should skip a tutorial and go directly to “Tool” or “Game.” The “Tutorial” module provides students with a visual, step-by-step guide on the effect of the correlation between two stocks and their weights on the risk and return of a two-asset portfolio. Students can study each frame at their own speed as many times as necessary by using “Next” and “Back” buttons. Animation enhances the presentation, especially for visual learners. Exhibit 1 shows the last frame of the module, which summarizes the lesson. The graph points out the principle that the lower the correlation between the returns of the stocks in the portfolio, the greater the diversification benefits. The frame also supplies formulae for calculating expected return and standard deviation. __________________________ Place Exhibit 1 about here
Finance instructors should find the “Tool” module especially useful, as they often graph possible two-asset portfolios for two or three different cases of correlations. With the “Tool” module, they can demonstrate the dynamics across an almost unlimited number of different correlations and stock weights. This module consists of two frames: “Correlation selection” (in Exhibit 2) and “Weights selection” (in Exhibit 3). In the former frame, an instructor can select any correlation by moving the correlation slider in the right upper corner and immediately
8
display all possible portfolios for that correlation by clicking on the “Graph” button. In the latter frame, an instructor can show how the weights of two stocks determine the location of the portfolio on an opportunity set. Along with the formulae for expected return and standard deviation, this frame interactively displays the values of all input and calculated variables, further enhancing its educational value. __________________________ Place Exhibit 2 about here __________________________ Place Exhibit 3 about here
The last main module, “Game,” allows students to play an interactive educational game on the lesson. Exhibit 4 shows the “Weights selection” frame of the “Game” module. The circle represents a randomly generated portfolio that serves as a target or goal. The object of the game is to choose correlation between two stocks and their weights in the two-asset portfolio that will have the same expected return and risk as the randomly generated portfolio. Students must first use the slider or the Input Correlation box to select the correlation. Then they click on “Graph” and use the Weights slider to vary the weights of the stocks. The game promotes conceptual understanding and gives students opportunities to apply the concepts in an interactive and entertaining environment. Research has shown that because students find them engaging, educational games offer these and other benefits in the areas of learning and retention (e.g., Randel, Morris, Wetzel, and Whitehill, 1992). __________________________ Place Exhibit 4 about here
9
THE EFFECT OF THE LEARNING OBJECT ON STUDENT LEARNING To assess the instructional value of our Portfolio learning object ― the first such test of a learning object that we know of ― we compared the student performance in a class that uses the object with the student performance in a traditional class. Our methodology was straightforward. One of the authors conducted an experiment by teaching the effect of correlation on the portfolio return and standard deviation differently in two sections of a fall 2003 introductory finance course. One section (the control) received a traditional lecture, during which the instructor drew on the board graphs of opportunity sets for three different correlations. In the other section (the treatment), the instructor used the learning object to explain the same material rather than drawing graphs on the board and had student teams (assembled on the basis of seating proximity) play the “Game” module. Their challenge was to find the right correlation for the randomly chosen portfolio in a minimum number of tries. Other variables were carefully controlled. The instructor spent the same amount of time on the topic, approximately 15 minutes, in both sections. We also controlled for student differences between the sections by analyzing the student profiles of the sections on key characteristics: gender, age, admission average, and grade point average (GPA) for all university courses taken prior to the fall 2003 term. These profiles are displayed in Exhibit 5. As it shows, the student populations in the two sections do not differ significantly on any of the characteristics. __________________________ Place Exhibit 5 about here
Immediately after the lesson on the effect of correlation on the portfolio return and standard deviation, a short five-item quiz on the topic was given to measure any learning differences
10
between the two sections. Panel A of Exhibit 6 shows the average percentage of quiz points earned in each section. Both the mean and the median of the quiz scores are higher for students in the learning object section than for students in the traditional lecture, but the differences are not statistically significant. __________________________ Place Exhibit 6 about here
However, some types of students may gain more from experiential and visual learning formats than others. Previous research has found that, while high-GPA students grasp new material regardless of the learning format, low-GPA students benefit from hands-on, experiential methods, such as service learning (Philpot and Wright, 2002), games (Philpot and Peterson, 1998) and simulations (Fraas, 1982). Other studies show that illustrations enhance learning for students with low prior knowledge and not for those with high prior knowledge (e.g., Levie and Lentz, 1982; Mayer and Gallini, 1990). Therefore, we divided the students in both sections into low-GPA (75 percent and below) and high-GPA (above 75 percent) groups. (In this study’s Canadian university, a GPA of 80 or above is comparable to an A grade.) Panel B of Exhibit 6 displays the effects of both learning format and student GPA. Consistent with previous research, the format makes little difference for the high-GPA students, but it does for the low-GPA students, and their performance indeed benefits from the learning object. Both the mean and the median scores of the low-GPA students in the learning-object section are significantly higher than those in the traditional-lecture section. Like other forms of experiential and visual instruction, learning objects seem to help the students who most need help.
11
CONCLUSION Here we have proposed, assessed and offered for general instructional use an animated, interactive learning object called “Portfolio Expected Return, Risk, and Diversification.” We grounded our expectations for the object’s effectiveness as a teaching tool in the literature on learning styles and learning in general. This extensive body of research clearly demonstrates that visual representations of course material and hands-on, interactive, learner-controlled lessons greatly facilitate learning for students with visual and kinesthetic processing styles and seemingly for students in general. We examined the learning benefits of our learning object in a fall 2003 introductory finance course. Our results indicate that while high-GPA students seem to understand new material regardless of the learning format, low-GPA students benefit significantly from using the learning object. This finding suggests that this new teaching tool serves its purpose best on material that most students find difficult. This study offers just one empirical test of only one learning object on a small sample of students, so our results should not be overgeneralized. Still they are consistent with previous studies on the learning benefits of other experiential teaching methods, such as service learning, games, and simulations. Our results should also be easy to reassess in different contexts. Learning objects currently stand on the forefront of innovative instructional applications of technology. This study represents one of the first, if not the first test of the pedagogical value of a learning object in classroom practice. We have made our object freely available to instructors and students around the world, and the web contains thousands more freely available objects in all disciplines (see repositories at http://www.merlot.org, http://elearning.utsa.edu/guides/LOrepositories.htm or http://www.uwm.edu/Dept/CIE/AOP/LO_collections.html – all accessed
12
October 8, 2004). We urge instructors to explore these repositories (most are organized by discipline) for visually rich, interactive demonstrations, in-class student activities and homework assignments and to assess the learning benefits of learning objects in their own courses. We also encourage instructors to develop more finance-related learning objects and recommend Smith’s (2004) guidelines for doing so.
13
REFERENCES Ardalan, K., 1998, “On the Use of Entertaining Metaphors in the Introductory Finance Course,” Financial Practice and Education 8 (No. 1, Spring/Summer), 108-119. Becker, M. W., 1993, “Top Ten Lists in Finance Class,” Financial Practice and Education 3 (No. 2, Fall), 109-111. Biktimirov, E. N., 2003, “An Ounce of Common Sense is Worth a Pound of Theory,” Advances in Financial Education 1 (Fall), 1-12. Biktimirov, E. N. and L. B. Nilson, 2003, “Mapping Your Course: Designing a Graphic Syllabus for Introductory Finance,” Journal of Education for Business 78 (No. 6, July/August), 308312. Cudd, M., J. Tanner, and T. Lipscomb, 2004, “A Profile of Classroom Technology Usage in Finance Instruction,” Journal of Financial Education 30 (Spring), 28-40. Cyrs, T. E., 1997, Teaching at a Distance with the Merging Technologies: An Instructional Systems Approach, Las Cruces, NM, Center for Educational Development, New Mexico State University. Detzler, M. L., 2000, “Finance Courses on the Internet,” Financial Practice and Education 10 (No. 1, Spring/Summer), 195-204. Filbeck, G. and L. L. Smith, 1996, “Learning Styles, Teaching Strategies, and Predictors of Success for Students in Corporate Finance,” Financial Practice and Education 6 (No. 1, Spring/Summer), 74-85. Fischman, G. E., 2001, “Reflections about Images, Visual Culture, and Educational Research,” Educational Researcher 30 (No. 8, November), 28-33.
14
Fraas, J. W., 1982, “The Influence of Student Characteristics on the Effectiveness of Simulations in the Principles Course,” Journal of Economic Education 13 (No. 1, Winter), 56-61. Gentry, J. A. and M. G. Helgesen, 1999, “Using Learning Style Information to Improve the Core Financial
Management
Course,”
Financial
Practice
and
Education
9
(No.
1,
Spring/Summer), 59-69. Gerdes, G. R., 2000, “Interactive Economics Instruction with Java and CGI,” Journal of Economic Education 31 (No. 1, Winter), 12. Hodgins, H. W., 2000, “Into the Future: A Vision Paper,” American Society for Training & Development and National Governors’ Association. Retrieved March 8, 2004 from http://www.learnativity.com/download/MP7.PDF Howard-Rose, D., and K. Harrigan, 2003, “CLOE Learning Impact Studies Lite: Evaluating Learning Objects in Nine Ontario University Courses.” Retrieved September 29, 2004 from http://cloe.on.ca/MERLOTConferencePaper10.doc. Ip, A., I. Morrison, and M. Currie, 2001, “What Is a Learning Object, Technically?” WebNet2001 Conference Proceedings, Orlando. Retrieved February 10, 2004 from http://users.tpg.com.au/adslfrcf/lo/learningObject(WebNet2001).pdf. Kane, S., 1999, “Teaching Principal-Agent Problems Using Examples from Popular Music,” Financial Practice and Education 9 (No. 1, Spring/Summer), 116-120. Kaufman, D. A. and R. S. Kaufman, 2002, “Interactive Web Graphs for Economic Principles,” Journal of Economic Education 33 (No. 3, Summer), 296. Krishnan, V. S., C. T. Bathala, T. K. Bhattacharya, and R. Ritchey, 1999, “Teaching the Introductory Finance Course: What Can We Learn from Student Perceptions and Expectations?” Financial Practice and Education 9 (No. 1, Spring/Summer), 70-82.
15
Levie, H. W. and R. Lentz, 1982, “Effects of Text Illustrations: A Review of Research,” Educational Communication and Technology Journal 30 (No. 4), 195-232. Mayer, R. E. and J. K. Gallini, 1990, “When Is an Illustration Worth Ten Thousand Words?” Journal of Educational Psychology 82 (No. 4, December), 715-726. McKeachie, W. J., 2002, Teaching Tips: Strategies, Research, and Theory for College and University Teachers, 11th edition, New York, NY, Houghton Mifflin. Nilson, L. B., 2001, “The Graphic Syllabus: Shedding Visual Light on Course Organization,” in D. Lieberman, Ed., To Improve the Academy, Vol. 20, Bolton, MA, Anker Publishing, 238259. Nilson, L. B., 2003, Teaching at Its Best: A Research-Based Resource for College Instructors, 2nd edition, Bolton, MA, Anker Publishing. Philpot, J. and C. A. Peterson, 1998, “Improving the Investments or Capital Market Course with Stock Market Specialist,” Financial Practice and Education 8 (No.2, Fall/Winter), 118-124. Philpot, J. and M. Wright, 2002, “Service Learning in Finance,” Journal of Financial Education 28 (Spring), 1-12. Randel J. M., B. A. Morris, C. D. Wetzel, and B. V. Whitehill, 1992, The Effectiveness of Games for Educational Purposes: A Review of Recent Research, Simulation & Gaming 23 (3), 261-276. Saunders, K. T., 2001, “Teaching Methods and Assessment Techniques for the Undergraduate Introductory Finance Course: A National Survey,” Journal of Applied Finance 11(No. 1, Fall), 110-112. Smith, R. S., 2004, “Guidelines for Authors of Learning Objects,” Retrieved September 1, 2004, from http://www.nmc.net/guidelines/index.shtml.
16
Sosin K. and W. E. Becker, 2000, “Online Teaching Resources: A New Journal Section,” Journal of Economic Education 31 (No. 1, Winter), 3-7. Theall, M., 1997, “An Overview of Different Approaches to Teaching and Learning Styles.” Paper presented at Teaching and Learning Styles at a Distance, Central Illinois Higher Education Consortium Faculty Development Conference, Springfield, IL, May. Vekiri, I., 2002, “What Is the Value of Graphical Displays in Learning? Educational Psychology Review 14 (No. 3, September), 261-312. Wiley, D. A., 2000, “Connecting Learning Objects to Instructional Design Theory: A Definition, a Metaphor, and a Taxonomy,” in D. A. Wiley, Ed., The Instructional Use of Learning Objects: Online Version. Retrieved March 25, 2004, from http://reusability.org/read/chapters/wiley.doc
17
Exhibit 1. The Last Frame of the “Tutorial” Module of the Portfolio Expected Return, Risk, and Diversification Learning Object
18
Exhibit 2. The “Correlation Selection” Frame of “Tool” Module of the Portfolio Expected Return, Risk, and Diversification Learning Object
19
Exhibit 3. The “Weights Selection” Frame of “Tool” Module of the Portfolio Expected Return, Risk, and Diversification Learning Object
20
Exhibit 4. The “Weights Selection” Frame of “Game” Module of the Portfolio Expected Return, Risk, and Diversification Learning Object
21
Exhibit 5. Profile of the Students in the Traditional-Lecture and Learning-Object Sections Student Characteristic
Gender (Male-1, Female-0) Age Admission Average GPA
Traditional-Lecture
Learning-Object
Section (n = 33)
Section (n = 27)
Mean
Mean
0.61 21.12 78.86 74.99
Median 1.00 20.00 79.00 74.70
0.52 20.30 80.37 75.09
22
p-value using t-test for means
Median 1.00 20.00 79.00 75.30
0.506 0.273 0.276 0.907
p-value using Wilcoxon rank sum test for medians 0.562 0.220 0.412 0.911
Exhibit 6. Scores on the Quiz on the Effect of Correlation on the Portfolio Return and Standard Deviation Panel A. Quiz Scores by Learning Format Parameter
Examination Score
Traditional-Lecture
Learning-Object
Section (n = 33)
Section (n = 27)
Mean
Median
Mean
Median
53.64%
50.00%
61.11%
66.67%
p-value using t-test for means
0.315
p-value using Wilcoxon rank sum test for medians 0.262
Panel B. Quiz Scores by Learning Format and Student GPA Parameter
Traditional-Lecture
Learning-Object
Section (n = 33)
Section (n = 27)
Mean
Mean
Median
p-value using t-test for means
p-value using Wilcoxon rank sum test for medians
Median
Low GPA (≤ 75%)
42.78% 50.00% (n = 18)
58.97% 66.67% (n = 13)
0.085*
0.089*
High GPA (> 75%)
66.67% 66.67% (n = 15)
63.09% 83.33% (n = 14)
0.749
0.948
*Significant at the 0.10 level.
23