whole plant was deliberately designed to be too large to fit on the computer screen, ... Example of screen clipping with the repair dialog box of CNC-3 (cf. [4]).
WORK WITH DISPLAY UNITS 94 A. Grieco, G. Molteni, B. Piccoli and E. Occhipinti (Editors) © 1995 Elsevier Science B.V. All rights reserved
259
Additional sound feedback in man-computer interaction: two empirical investigations. M. Rauterberg, E. Styger, A. Baumgartner, A. Jenny, and M. de Lange Work and Organizational Psychology Unit, Swiss Federal Institute of Technology (ETH) Nelkenstrasse 11, CH-8092 Zurich, Switzerland Abstract Two experiments were carried out to estimate the effect of sound feedback: (1) operating an assembly line simulator (Experiment-A with sound feedback of hidden events), and (2) queries in database search (Experiment-B with sound feedback of the search result quality). ExperimentA: Relevant information of hidden events (e.g., disturbances and machine break downs) was given only in a visual, and in visual and audible form. The results indicate, that additional sound feedback improves significantly the user performance and increases positively some mood aspects. Experiment-B: Individualised sound patterns (music, speech, noise) inform the user about the amount of correspondence between the requested data and the actual output on the screen (result feedback). The results of this empirical investigation indicate, that additional sound feedback does not improve the user performance, overall. But, if we differentiate between users, who prefer sound, and those, who do not, we can find significant improvements. We can conclude that sound feedback is necessary, but must be eligible. 1 . INTRODUCTION Sound feedback can be utilised to improve the user's understanding of visual predecessors or can stand alone as independent sources of information. (E.g., sound as action feedback [2]; sounds as diagnostic support applied with the direction of a process simulation [3].) The following examples help to illustrate the important kinds if information that sound can communicate [5]: (1) Information about physical events – We can hear whether a dropped glass has bounced or shattered. (2) Information about invisible structures – Tapping on a wall is useful in finding where to hang a heavy picture. (3) Information about dynamic change – As we fill a glass we can hear when the liquid has reached the top. (4) Information about abnormal structures – A malfunctioning engine sounds different from a healthy one. (5) Information about events in space – Footsteps warn us of the approach of another person. The parallel use of different media and the resulting parallel distribution of information, for example by simultaneously showing a predecessor through a concrete representation and its explanation through audio distribution, leads to a denser sharing of information. In this case, the user can dedicate his attention solely to the visual information, that has parallel audio support. This reduces the need to change the textual or other visual delivery and prevents the overflow of visual information. By comparing audio signal patterns with visual signal patterns Gaver [3] could not show the different advantages of each. He describes only some global impressions of different user reactions to sound feedback in a collaborative environment. Our main interest was to test the hypothesis that people in the real world monitor multiple background activities simultaneously through sound. So, in the first experiment we use auditory cues to help users to monitor the status of ongoing processes. Diagnosing and treating problems with a simulated plant were aided by alert sounds (see also [3]). In difference to [3] we used individual sessions, and not a collaborative environment. We carried out the experiment-A (feedback of hidden events), that allows us to test our hypothesis with the methodology of
260
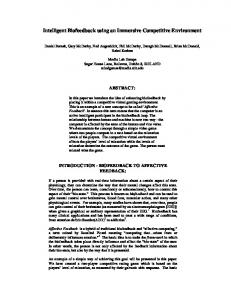
applied statistics (cf. [6]). As stated in [8] dialog systems should offer the user alternative procedures for accomplishing his or her goals (flexibility) and allow the user to tailor the system according to his or her needs. These criteria take into account both inter-individual and intra-individual differences of the users. So, in the second experiment we tested the hypothesis that customisation of sound feedback supports the usage of interactive software. 2 . EXPERIMENT-A: FEEDBACK OF HIDDEN EVENTS 2 . 1 Method Subjects: Eight male students of computer science at the ETH (mean age 24 ± 1 years) were instructed to operate an assembly line simulator. Material: This simulator was implemented with a direct-manipulative interface under Windows on an IBM compatible PC. The audible feedback was continuos sound, that was similar to the special events (normal operating sound, stopping of coolant, no coolant, pneumatic tear off, etc.). The simulation is based on a flexible manufacturing system in Switzerland [4], that produces cases made of aluminium (see 'work pieces' on assembly line in Figure 1). The whole system consists of eight computer-numeric-controlled (CNC) manufacturing centres and eight loading robots for these centres. In the input directing station all work pieces are automatically directed on the assembly line. The assembly line transports each work piece through different stations to the CNC manufacturing centres and back to the output directing station. The whole plant was deliberately designed to be too large to fit on the computer screen, so users could only see about half the CNC machines at any time (see Figure 1 as an 'actual screen clipping' of the whole plant with scroll bar on the right side).
Figure 1. Example of screen clipping with the repair dialog box of CNC-3 (cf. [4]). We designed our simulator so that each of the machines made sounds to indicate its status over time. Each sound was designed to reflect the semantic of the actual event. For instance, a splashing sound indicated that cooling liquid was being spilled. Because of the complexity of our system, as many as 38 sounds made be placed at once. We attempted to design the sounds so that none would be masked (rendered inaudible) by other sounds. There are two strategies to be useful in avoiding masking. First, sounds were spread fairly evenly in frequency, so that some were high-pitched and others lower. Second, we avoided playing sounds continuously and instead played repetitive streams of sounds, thus maximising the chance for other sounds to be heard in the gaps between repetitions. CNC 0 and CNC 4 are characterised by a high-pitched sound. CNC 3 and CNC 7 are low-pitched.
261
Tasks: Normal running of a machine was coupled with a characteristic sound pattern. Each machine breakdown generated instead of the normal sound a specific alert sound. If a robot or a CNC centre breaks down, then this centre can not process the pallet of four work pieces further on. The first consequence of a breakdown is a jam on the assembly line. The second consequence is the productivity of the plant decrease. Subjects were instructed to operate a plant simulator and to take care for a high productivity rate. The task was to trouble-shoot the whole manufacturing system. First, each subject had to detect that a breakdown happened. Then he has to find the interrupted machine (robot or CNC machine). The actual breakdown event shows the operator how to repair the machine. The operator can get this information visually in a modal dialogue box with the status report at the control station or in an auditory form through sound feedback. Each interrupted machine could be repaired by entering an appropriate repair code (a fourdigit number, e.g. '8319', see Figure 1) in a repair dialogue box at the machine. The operator sees only a part of the whole plant (see 'actual screen clipping' in Figure 1). He moves the actual screen up and down by clicking with the mouse in the scrollbar area to 'go to' the interrupted machine. A mouse click on the machine symbol pops up the repair dialogue box. Entering the correct repair code transfers the interrupted machine in the normal state. If an incorrect repair code is entered, then no internal state change happens and the user could hear only a short beep. Procedure: Test condition-1 was only visual feedback at the operator control panel. Test condition-2 was visual and audible feedback. We used a follow up test design (Latin square). Both task trials lasted exactly 20 minutes each. Before and after each task trial the user has to answer a mood questionnaire (eight scales with overall 36 items as monopolar rating scales). After each task trial we measured the subjective satisfaction with a semantic differential (11 bipolar items). Each individual session took about 90 minutes. Measures: A work piece could have one of the following status: (1) loading on the assembly line at the input directing station, (2) transportation on the assembly line, (3) fixation on the carrier at the reset station, (4) final fixation and twist on the carrier, (5) fixation on a pallet with three other work pieces at the robot, (6) processing one of two sides in the CNC station, (7) change from one side to the other at the reset station, (8) to be provided with a serial number at the labelling station, (9) loading off the assembly line at the output directing station. Steps (3) to (7) are carried out twice, once for each side of the work piece. Our first dependent variable is a point scale that measures the productivity of the plant. Each work piece, that entered the assembly line at the input direction station, counts one point. One point is counted additionally for each side, that was processed at a CNC machine. Each work piece, that left the assembly line at the output direction station, counts an extra point. Each work piece on the assembly line counts one to four points. The productivity score after 20 minute's simulation time is the sum over all work pieces that entered the assembly line (productivity score). The second dependent variable is the number of requested status reports at the control station (# of status reports). The third and fourth dependent variables are number of correct and number of incorrect repairs (# of correct repairs, and # of incorrect repairs). The eight scales of the mood questionnaire and the 11 items of the semantic differential are control variables to measure users' satisfaction. 2 . 2 Results The results of this experiment showed, that the performance of operating an assembly line simulator could be significantly improved, when feedback of machine break downs and other disturbances was continuously given in an audible form, too (see Table 1). We can also observe a significant increase of two different aspects of the user's mood. Users felt significantly more self-assure and more social accepted after working with sound feedback than without sound (see Table 2). Their readiness for endeavour, restfulness, and mood increased in the test-condition with sound. On one side, we can observe a significant improvement of performance through sound feedback, on the other side we can find, that users perceive the simulation with sound more in-transparent and feel more or less confused than without sound (see Table 3).
262
Table 1. Results of the four dependent variables that measure users' trouble-shooting activities. Variable (0)
(77)
productivity score # of status reports # of correct repairs # of incorrect repairs
With sound 70 17 36 16
± 5.6 ± 5.8 ± 2.5 ± 11.0
Without sound 65 23 36 9
± ± ± ±
5.3 4.0 2.3 7.1
P sign. .052 .032 .999 .184
Table 2. Results of the differences (after score – before score) of two of eight scales of a mood questionnaire (monopolar rating scale [1 … 6]) that show significant differences. Variable (-5)
(+5)
With sound +1.8 ± 2.0 +0.1 ± 1.0
self assurance social acceptance
Without sound -0.6 ± 1.7 -1.1 ± 1.0
P sign. .022 .031
Table 3. Results of two of eleven items of a semantic differential (bipolar rating scale: -2, -1, 0, +1, +2). Variable (-2)
(+2)
intransparent-transparent confuse -unequivocal
With sound
Without sound
+0.4 ± 1.1 +0.1 ± 2.7
+1.4 ± 0.6 +1.1 ± 1.0
P sign. .064 .179
3 . EXPERIMENT-B: CUSTOMISED RESULT FEEDBACK We carried out a second experiment to test the hypothesis that sound feedback is particularly helpful, if the user can choose his or her individually preferred sound pattern. 3 . 1 Method Subjects: Twelve subjects (4 female, 8 male; mean age 22 ± 2 years) were instructed to define queries on a database. Material: The database has a direct manipulative interface and contains 350 different cocktail prescriptions. The database was implemented under HyperCard on an Apple Macintosh IIfx. The user could choose his or her preferred sound feedback with the customisation interface (see Figure 2). Each discrete result feedback was one of 49 different sound pattern for the following six output conditions: 'fit exactly', 'fit except one part', 'fit except 2 parts', 'fit except 3 parts', 'fit except more than 3 parts', 'does not fit'. Tasks: The task was to search an appropriate cocktail, when the components are given (e.g., type of liquor, type of juice, etc.). Each user had to search four different prescriptions. Procedure: The users chose individually the most convenient sound for each output condition from one of the three sound classes (result of this personal selection: speech in 42%, music in 25%, and noise in 33%). Factor-A was 'feedback' ('with sound' versus 'without sound' condition). We used a follow up test design (Latin square). Both task-solving trials lasted maximally 15 minutes each. Each individual session took about 60 minutes. Measures: The first dependent variable is the total search time (in seconds). The second dependent variable is the search time per prescription (in seconds). The third dependent variable is the number of dialog operators ('# of dialog operators'; e.g., mouse clicks). Before and after each task trial the user has to answer a mood questionnaire (eight scales with overall 36 items as
263
monopolar rating scales as control variables). After the task trial with sound feedback we measured each personal opinion (subjective 'sound preference' questionnaire with five monopolar rating scales). No Sound
Noise
Music
Speech
fit exactly:.......... fit except 1 part fit except 2 parts fit except 3 parts fit except ≥ 4 parts does not fit
Figure 2. The customisation interface to select the individual sound feedback. 3 . 2 Results The results of Experiment-B showed, that the performance of direct manipulative database queries could not be significantly improved, when feedback was given in an audible form (see Table 4). This result can be explained by the uncontrolled factor 'individualisation'. Most of the users' sound selections did not reflect the ordinal structure of the result feedback (7 sound selections without ordinal structure, 4 sound selections with ordinal structure). Table 4. Results of the three dependent variables that measure users' performance of database queries for both test-conditions 'with sound feedback' and 'without sound feedback'. Variable
With sound
Without sound
P sign.
search time total search time per prescr. # of dialog operators
685 ± 193 201 ± 99 98 ± 38
649 * 288 182 ± 113 112 ± 60
.709 .627 .577
In the analysis of subjective sound preferences we distinguished between those users that prefer sound (N=5) and those users that do not prefer sound (N=7). For a post-hoc analysis we constructed the Factor 'preference' with two levels: 'sound preferred' versus 'sound refused'. Overall both test-conditions, when sound was preferred, the mean search time is 633 ± 248 sec; mean search time, when sound was not preferred (refused, resp), is 692 ± 241 seconds. This difference is not significant (F(1,10) = 0.28, p ≤ .609). Table 5. Results of the three dependent variables that measure users' performance of database queries only for the test-condition 'with sound feedback' and both users' groups. Variable
Sound preferred
Sound refused
search time total search time per prescr. # of dialog operators
544 ± 215 136 ± 54 71 ± 26
786 * 246 ± 117 ±
P sign. 95 99 32
.023 .046 .029
264
But, if we analyse only the test-condition 'with sound feedback' then we get the following result for the variable 'search time total' between the two groups 'preferred' versus 'refused': mean search time for 'sound preferred' is 544 ± 215; mean search time for 'sound refused' is 786 ± 95. This difference is significant (F(1,10) = 7.18, p ≤ .023). Similar results are found for the two other dependent variables, too (see Table 5). The significant difference of the variable 'total search time' can be explained by the significant interaction term between the Factor 'test-condition' and the Factor 'preference' (mean search time for 'with sound' and 'sound prefered' is 544 ± 215 mean search time for 'without sound' and 'sound prefered' is 721 ± 270; mean search time for 'with sound' and 'sound refused' is 786 ± 95; mean search time for 'without sound' and 'sound refused' is 570 ± 310; F (1,10) = 5.04, p ≤ .049). 4 . DISCUSSION AND CONCLUSION The results of Experiment-A showed, that the performance of operating a plant simulator could be significantly improved, when feedback of machine break downs and other disturbances was continuously given in an auditory form, too. We can also observe a significant increase of different aspects of users' mood. We found that sound feedback was effective in the following way. Sound feedback helped users keep track of the ongoing processes. Sounds allowed users to track the activity, rate, and functioning of normally running machines. Without sound feedback, users overlooked machines that were broken down. With sound feedback these problems were indicated either by the machine's sound ceasing or by the various alert sounds. Continuos sound feedback allowed users to hear the plant as an integrated complex process. Integrating the results of Experiment-B, we can conclude that sound feedback is necessary, but must be eligible. Most of all user interfaces stresses the visual perception. Sound feedback can probably help to reduce eye strain. New possibility for the interactive representation of complex sound generating events and processes are possible, especially in multimedia interfaces [7]. Simulations with the utilisation of audio data will in future also have their application in the training of people with impaired senses, in particular of people with damaged vision. 5 . REFERENCES [1] [2] [3] [4] [5] [6] [7]
[8]
Cohen, J. (1993) "Kirk Here:" Using Genre Sounds To Monitor Background Activity. in S. Ashlund, K. Mullet, A. Henderson, E. Hollnagel and T. White (eds.) Interchi'93 Adjunct Proceedings. (pp. 63-64), ACM. Gaver, W. (1989) The Sonic Finder: an interface that uses auditory icons. Human Computer Interaction 4:67-94. Gaver, W., Smith, R. & O'Shea, T. (1991) Effective sounds in complex systems: the ARKola simulation. in S. Robertson, G. Olson & J. Olson (eds.), Reaching through technology CHI'91. (pp. 85-90), AddisonWesley. Kuark, J. (1988) Der Informationsaustausch zwischen Operateuren und einer Fertigungsanlage. Nachdiplomarbeit in Mechatronik. Eidgenössische Technische Hochschule, Zürich. Mountford, S. & Gaver, W. (1990) Talking and Listening to Computers. in B. Laurel and S. Mountford (eds.) The Art of Human-Computer Interface Design. (pp. 319-334), Addison-Wesley. Rauterberg, M. & Styger, E. (1994) Positive effects of sound feedback during the operation of a plant simulator. In: B. Blumenthal, J. Gornostaev & C. Unger (Eds.) Human Computer Interaction. (Lecture Notes in Computer Science, Vol. 876, pp. 35-44), Berlin: Springer. Rauterberg, M., Motavalli, M., Darvishi, A. & Schauer, H. (1994) Automatic sound generation for spherical objects hitting straight beams based on physical models. In: T. Ottmann & I. Tomek (Eds.) Eductional Multimedia and Hypermedia. (Proceedings ED-MEDIA'94, pp. 468-473), Charlottesville: Association for the Advancement of Computing in Education. Ulich, E., Rauterberg, M., Moll, T., Greutmann, T. & Strohm, O. (1991) Task Orientation and UserOriented Dialog Design. International Journal of Human-Computer Interaction 3(2):117-144.