Address-Event Imagers for Sensor Networks: Evaluation and Modeling Thiago Teixeira, Eugenio Culurciello, Joon Hyuk Park, Dimitrios Lymberopoulos, Andrew Barton-Sweeney and Andreas Savvides Electrical Engineering Department Yale University New Haven, CT 06520 {thiago.teixeira, eugenio.culurciello, dimitrios.lymberopoulos, andreas.savvides}@yale.edu,
[email protected],
[email protected]
ABSTRACT Although imaging is an information-rich sensing modality, the use of cameras in sensor networks is very often prohibited by factors such as power, computation cost, storage, communication bandwidth and privacy. In this paper we consider information selective and privacy-preserving address-event imagers for sensor networks. Instead of providing full images with a high degree of redundancy, our efforts in the design of these imagers specialize on selecting a handful of features from a scene and outputting these features in address-event representation. In this paper we present our initial results in modeling and evaluating address-event sensors in the context of sensor networks. Using three different platforms that we have developed, we illustrate how to model address-event cameras and how to build an emulator using these models. We also present a lightweight classification scheme to illustrate the computational advantages of address-event sensors. The paper concludes with an evaluation of the classification algorithm and a feasibility study of using COTS components to emulate address-event inside a sensor network. Categories and Subject Descriptors: C.2.4 [ComputerCommunication Networks]: Distributed Systems General Terms: Algorithms, Measurement, Performance, Design, Human Factors, Theory Keywords: Camera Sensor Networks, Imager Sensor Networks, Address-Event
1.
INTRODUCTION
Camera sensor networks are analogous to having eyes everywhere. They provide an information-rich sensing modality that can offer quantitatively and qualitatively better observations than other simpler sensors. Their deployment and use however also gives rise to numerous challenges and reservations. Cameras, more than other sensors, violate privacy. From an engineering perspective, cameras are also resource
Permission to make digital or hard copies of all or part of this work for personal or classroom use is granted without fee provided that copies are not made or distributed for profit or commercial advantage and that copies bear this notice and the full citation on the first page. To copy otherwise, to republish, to post on servers or to redistribute to lists, requires prior specific permission and/or a fee. IPSN’06, April 19–21, 2006, Nashville, Tennessee, USA. Copyright 2006 ACM 1-59593-334-4/06/0004 ...$5.00.
hungry. The sensor themselves require significant power, and the image and video sequences produced need additional processing, storage and communication bandwidth. In many sensor network applications the source of this inefficiency can be attributed to the fact that cameras digitize a great deal of redundant information. This information needs to be processed by complex algorithms and may have to be communicated to a remote base station before a conclusion is reached. Although we expect that future fabrication technologies will eventually mitigate the problem of power by producing lower power versions of today’s cameras, the complexity involved with processing large volumes of visual information will still impose limitations to cost, scalability and robustness of many types of sensor network systems. Moreover, privacy issues raised by the deployment of cameras in everyday environments, suggest that alternative technologies to traditional image sensors need to be explored. In this paper, we explore address-event image sensors as a solution to these issues. We argue that address-event imager design carries the potential to create ultra-low-power, information-selective and privacy-preserving sensing modalities that will result in simpler, yet more intelligent sensing systems. Our goal is to mimic processes from biological systems to design sensors that capitalize on the advantages of camera technologies. This will lead to the design of imagers that measure parameters of interest from the environment without having to acquire images. Such an approach will filter out all the redundant information at the sensor level extracting only a handful bits of useful information from the visual imagery. Before delving into the details of address-event sensors and our platforms, we motivate our discussion by considering a sensor network in an assisted living application. A sensor network is to supervise the activities of a person inside a house during the course of a day. In this application, it is easy to imagine that a set of cameras deployed in every room of the house could reliably perform this observation task without requiring tagging the individual with sensors. This sensor network will be required to continuously stream video information to a base station where it can be further processed by a human or a machine to generate alarms of a certain set of events. In a similar application, a network of custom designed address-event image sensors (and possibly other small sensors) would be able to provide very similar functionality, but would yield a much more light-
weight system. Instead of acquiring a set of images that require substantial processing and communication, addressevent image sensors selectively extract and output only a handful of features of interest from the visual scene such as location, motion, direction of motion and lighting. These features form a symbolic representation of the visual scene that is much easier to process on a small sensor node. With this symbolic respresentation, far less bandwidth is required in order to communicate and reason about an activity with other nodes. This allows in-network processing, giving sensor networks the ability to provide meaningful services as opposed to slighlty processed raw data. In this paper we argue that AER image sensors are a promising technology for sensor networks for several reasons. In active state they only consume a few µW of power, which is roughly three orders of magnitude less than today’s small sensor nodes. An even more important feature is that AER imagers use a fundamentally different computation model that is faster and more lightweight than conventional image processing technologies. In AER imagers, computation starts at the pixel level making the imager information selective and event-driven. A pixel can be designed to detect specific features (e.g light saturation, motion and contours). Each pixel generates an event when its conditions are satisfied, thus eliminating the need to poll the imager for information. This also results in automatic rank encoding of data, based on importance that provides opportunities for designing new lightweight recognition algorithms that can run on small sensor node processors. Finally, the AER outputs of the sensors make it more challenging to reconstruct an image. In fact we believe that it may be possible to make image reconstruction substantially hard, thus making our imagers more privacy-preserving than other conventional cameras. The remainder of this paper is organized as follows: in section 2 we provide an introduction to addressevent architectures. In section 3 we describe three camera platforms for evaluating and modeling address-event sensors. Section 4 explains how an address-event camera can construct images. Section 5 describes a platform that emulates the pixel level functions of an address-event camera, and section 6 describes a basic pattern matching application to demonstrate how address-event representation simplifies processing requirements. Section 7 describes a simple example on the use of address-event information inside the network and compares the cost to the conventional approach. Section 8 concludes the paper.
2.
ADDRESS EVENT ARCHITECTURE
Address-Event Representation (AER) is a biologicallyinspired asynchronous protocol for encoding and communicating sensory data between a transmitting sensor and a receiving processing unit [3, 4, 13]. An address-event (AE) communication channel is a model of the transmission of neural information in biological sensory systems. The AER model trades the wiring complexity of biological systems for the processing speed of integrated circuits. Neurons in the human brain and in sensory pathways make up to 105 connections with their neighbors [9], a prohibitive number for integrated circuits. Nevertheless, the latter are capable of handling communication cycles that are six orders of magnitude smaller than the inter-event interval for a single neuron or cell. Thus it is possible to share this speed advantage amongst many sensory elements, and create a single
communication channel to convey all the information to a receiver. In the AE terminology, events are communication packets that are sent from a sender to one or more receivers. For an AE image sensor sensitive to light intensity, events are signaled when individual pixels reach a threshold voltage and request the bus for initiating a communication with an outside receiver. An AE system is generally composed of a multitude of basic cells or elements either transmitting, receiving or transceiving data. An event has the simple form of the address of the transmitting element (hence the origin of the term address-event). Several address-event imagers have been proposed in the literature [2, 5–8, 10, 16, 19] since the first devices by M. Mahowald and C. Mead [15]. A main advantage of AER image sensors is that they do not need to be queried for information, instead they push information to the receiver, once they have gathered it. This feature is of extreme importance in data-driven sensor networks, since image sensors can detect features of interest in the environment itself and provide hardware triggers that do not need to be polled for information. In addition, it is common for AER sensors to automatically provide a rank encoding of data, based on importance. In an AER image sensor sensitive to light intensity, the brightest pixels will generate events first and more frequently than other darker pixels, thus the data from these pixels will become available immediately to a receiver [6, 8]. In an AER image sensor sensitive to motion, only pixels that see a change in light intensity will generate events [10]. Therefore, AER image sensors can provide compression and reduced latency of response of a recognition system by transmitting only the relevant information and ranking it so the most interesting data will be prioritized. This way of encoding information is the basic building block of a sensor network able to detect complex features in a scene, like behaviors [21]. Our group has designed and fabricated four generations of AE image sensors sensitive to light intensity [5–8]. Our work on image sensor networks has demonstrated the feasibility of wireless communication of visual information with very small bandwidths [20]. Within this publication we are employing our forth generation AE image sensor, the ALOHA imager [20]. It is composed of four quadrants of 32×32 pixels and is able to generate 10,000 events in 1.3s with a power consumption of 6µW per quadrant. These AE image sensors provide significant advantages when compared to commercial off-the-shelves (COTS) camera modules. Some of these advantages are: low-power consumption, high dynamic-range, native digital output, smart-pixel architectures [8].
3.
EXPERIMENTAL CAMERA PLATFORMS
To experiment with the use of address-event cameras in sensor networks, we have created three different camera sensing platforms. Each platform is built on top of the XYZ sensor node [12]. XYZ uses an OKI ML67Q5002 processor that features an ARM7TDMI core running at 58MHz and a wide variety of peripherals. The processor has 32KB of internal RAM and 256KB of FLASH. An additional 2-Mbit memory module is available on-board. The node exposes most of the processor pins through 2, 32-pin headers, that allowed us to build custom interfaces with different cameras. The first platform is an XYZ sensor node with the ALOHA
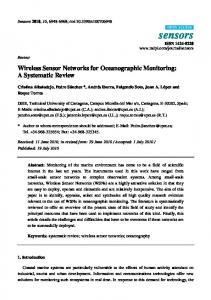
Figure 1: The XYZ sensor node interfaced to the COTS camera module from Omnivision (left) and to the ALOHA image sensor (right).
image sensor (Figure 1, right). The interface of this camera and the method of image acquisition is described in detail in the next section. The second platform, shown in Fig. 1 (left) is an XYZ sensor node with an off-the-shelf OV7649 camera module from Omnivision [17]. This sensor can capture images at VGA (640×480) and QVGA (320×240) resolutions and also supports a windowing function that allows the user to acquire images at different resolutions by defining a window on the image plane. Data transfer between the camera and XYZ takes place over an 8-bit parallel port and DMA. At a QVGA resolution, the XYZ can acquire 4.1 frames per second. We use the platform at a 256 × 64 resolution, in which multiple frames can be stored onto the on-board SRAM. The XYZ memory allows the storage of 1.7 16-bit color frames, or 3.4 8-bit color frames or 27.3 1-bit (black and white) frames in QVGA resolution. At the reduced resolution of 256 × 64, the number of frames that can be stored is 4.6 times higher. The third platform consists of a software emulator of AE imagers. It allows quick simulation of AER imager prototypes, as well as the development of algorithms for these prototypes before they are even fabricated. The software is written in Visual C++ and runs under Windows. It takes an 8-bit grayscale input stream from a COTS USB camera and outputs a queue of events to a text file. Additionally, an image may be displayed by constructing it from the output events. The role of each of these plaforms will become more apparent in the sections that follow. In section 4 we use the first platform to describe how ALOHA can acquire images and in section 6 the same platform is used to study how AER can be exploited to draw conclusions about the visual scene. In section 5, the third platform is used to model and evaluate the architecture of AE imagers. This platform has the capability of mimicking the functionality of an AE image sensor and at the same time it can acquire conventional images that we can use as ground truth in our expriments. The second platform uses the results of modeling and AE recognition to allow us to experiment with AE concepts in the context of a WSN testbed.
4.
IMAGE ACQUISITION AND COMMUNICATION
The events generated by the ALOHA sensor correspond to a specific amount of light collected by any of its pixels. That is, pixels collect photons in a capacitive tank and generate an integration voltage. Once this voltage reaches a threshold, an event is signaled and the ALOHA outputs the X and Y coordinates of the pixel generating the event.
Figure 2: Address-Event Representation: once an event is generated, the address of the generating pixel is latched and Req goes high. The AE sensor, then, waits for an Ack signal from the receiver before sending another event. Once an event is generated, the ALOHA latches its address onto a 10-bit bus and sets the request bit (Req) high. It will only lower the request and wait for another event after the acknowledge bit (Ack) is raised by the receiver (Figure 2). The ALOHA image sensor uses the simple ALOHA access technique to transmit individual events to a receiver [1]. While the ALOHA access technique does not make efficient use of the channel capacity and generates collisions between events, it simplifies enormously the implementation of the access circuitry and reduces the latency of communication [4]. Given that the speed of modern integrated circuits allows serial channels with rates of multi-gigabit per second, the low throughput is justified and can be traded for high-speed and low-power [4]. Each pixel in an AE imager can be seen as a clock with its own frequency and phase. In the ALOHA, the frequency of events generated by each pixel depends on the intensity of the light illuminating each pixel. Strong lighting makes a pixel generate higher event rates while low lighting generates proportionally lower event rates. To obtain an image array, the event frequency data must be converted into light intensity. This can be done in two possible ways [8]: • Histogram reconstruction: counting events in a specific time interval and producing a histogram of the events in the array. • Inter-Event reconstruction: waiting for two consecutive events for each or most pixels in the array and then computing the inter-event time between such two events. An optional external timer can index each event and compute the inter-event difference, which is inversely proportional to the light intensity. An external buffer must hold the latest pixel time index and the intensity value. The reconstruction of images from the ALOHA sensor and other AE image sensors is not trivial, as each pixel is acting as a sigmadelta analog-to-digital converter [14]. A high-resolution timer (up to 24 bits for hundreds of picosecond resolution) is required to obtain an instantaneous image for every event using the inter-event reconstruction. The timer indexes each event and compares it with the last time an event at that pixel was recorded. The difference is inversely proportional to the light intensity. The buffer must hold the latest pixel time index and the intensity value. For this reason, the simpler implementation of histogram reconstruction is used in
Figure 4: Comparison between the output of the AER model and that of the ALOHA imager. Figure 3: A timeline of events as produced by a theoretical 3 × 3 imager similar to the ALOHA, and the event queue that results from removing interevent timing information.
our research. Histogram reconstruction uses an array to increment the pixel values. The size of the array is identical to the one used by COTS cameras, and therefore does not increase the complexity of the visualization program. It is important to point out that AE image sensors are not generally meant to be used as digital cameras, or to take snapshots. Instead, they are designed to extract information from a scene in AE for further processing. While traditional image sensors provide data in the form of an array after a specified time interval, AER sensors provide a non-deterministic number of events per time interval. The concept of a “frame” does not immediately apply to AER imagers since the event data flows continuously. Therefore, the quality or the complexity of image reconstruction is not important for our final goal, which is to design an image sensor network capable of extracting complex behaviors from a scene. In the development of our research, we use reconstruction of images to provide insight on the operation of the AER sensors in a real sensor network deployment, not for processing.
5.
ADDRESS EVENT CAMERA MODELING
While prototyping with COTS cameras provides fast turnaround times in sensor network deployments, the design and fabrication of a custom image sensor requires at least two months. To combat the problem of slow deployment of each generation of custom cameras, we have designed a platform, described in this section, for emulating AE image sensors. The goal of this emulation is to create a flexible infrastructure for exploring new designs of AER imagers. To test these designs in a networked setup, this emulation platform outputs data using address-event representation. The emulation algorithm was implemented as a PC software for use with live video input from a COTS camera. Other emulation algorithms have been proposed [11] for synthetic AER generation, but execution speed quickly becomes a constraint when implementing those in software. Here we briefly describe the algorithm we use to model AER imagers.
5.1
AER Conversion
Consider an 8-bit grayscale input image from a conventional camera. In order to convert the brightness of each pixel into a frequency of events, the following formula may be employed:
Pi (1) 255 Where fi is the number of times the i-th pixel will appear in the train of events, given that its grayscale value is Pi . This value is normalized by 255, the maximum grayscale value an 8-bit imager can hold. The quantity fM AX is a property of the AER imager being simulated. It expresses the maximum frequency that can be achieved by a pixel in the simulated imager. As an example, for an intensity image the integration time ∆tint of one pixel is given by equation 2, where Cint is the integration capacitor, ∆Vint is the integrator voltage swing, and Iph is the photocurrent impinging the pixel [7, 8]. fi = fM AX ×
∆tint =
Cint ∆Vint Iph
(2)
With a value of Iph of 1pA in indoor lighting conditions, and a Cint of 100fF and a ∆Vint of 1V we obtain integration time of approximately 0.1s or 10Hz per pixel. This is the fM AX for this scenario. In a 32×32 image sensor the agglomerate event-rate is thus approximately 10KHz. This equation can be used to calculate an average event rate per frame and thus it can be used to represent time within our model. These frequencies can, then, be used to populate a timeline where the address i is uniformly distributed according to the frequency fi from equation 1. The timeline accurately portrays the series of events produces by all pixels in the image, carrying the information regarding the order as well as the timing between any two events. When employing histogram reconstruction to display images from an AER train, an image can be reconstructed in one of two ways: by displaying the histogram for all events within an specific period of time; or by displaying the histogram of a specific number of contiguous events. When employing the latter, the timing information from a train of events is irrelevant. What is more, it is likely that sensor nodes equipped with AER sensors will be programmed to discard this timing data due to computation and cost constraints. Therefore, by employing an algorithm that does not calculate event timing, faster AER synthesis is possible without significant loss. Since events are expected to be relatively scarce in time, it is desirable to find an algorithm that produces an event queue as opposed to a timeline, which contains entries for when no event has been signaled. Figure 3 illustrates this. The algorithm employed for creating an event queue without inter-event timing is as follows. The number of events in an incoming frame is calculated from the fi ’s as found from
Figure 5: Block diagram of AER emulation. equation 1. The program iterates through the entire image n times, until all events are extracted from it. The i-th pixel is entered into the event queue if the following condition is true: PM AX =0 (3) Pi Where PM AX is the grayscale value of the brightest pixel in the image. This condition ensures that the brightest pixel is entered into the queue in every iteration n. Similarly, at every even iteration (2n) any pixel with half the grayscale value of the PM AX is entered. And so on. This way, each pixel is indeed entered with a frequency proportional to its brightness. Figure 4 provides a comparison of the model simulating an ALOHA imager against the output of the ALOHA itself. n mod
5.2
ronment. The centroid is calculated from a time-differenced image which, for illustrative purposes, has been superimposed onto the example pictures. Given the number of pixels in the examples, 128×96, this implies bandwidth savings above 94% for transmission of the raw imager data (128 × 96 × 8 = 98304 versus 400 × (7 + 7) = 5600 bits).
Building an AER Emulator
Using the model described above, it is possible to build a real-time AER emulator using off-the-shelf hardware. Figure 5 describes this process. An image stream from a COTS camera can be filtered through a pixel behavior model which utilizes conventional vision algorithms to mimic different types of feature-detecting imagers. The filtered image is then converted into an address-event stream, which is the output of the emulator. To simplify experimentation with different types of AER imagers, we developed a software AER emulator as described in figure 5. It runs on Windows 2000 or newer, and is available for download at http://www.eng.yale.edu/enalab/ projects/AERnets.html. It receives a live feed from a COTS USB camera and, after additional processing such as extraction of motion or edge data, converts it to AER. The user may chose whether to display the resulting image, save as an AVI file or as an event queue text file for use in a program such as Matlab. Several parameters are tweakable at run-time allowing basic image processing utilities such as thresholding, grayscale clipping and image resampling, allowing different imager architectures to be emulated. Additionally, the parameter fM AX is user-selectable in order to allow simulation of different pixel hardware properties. Two variables, chaosin and chaosout are also included to dictate the probability of an event randomly entering or leaving the queue. This simulates the address bus contention issues that some AER imagers have when colliding events simultaneously request the data bus. Figure 6 shows snapshots of the output of the program when emulating three different AER imagers: a motion detector, an edge detector, and a centroid detector. The images were formed using histogram reconstruction from 400, 400 and 1 event, respectively. The centroid detection assumes a single moving object in a simple background envi-
Figure 6: Emulation of different types of AER imagers. The resolution used for these examples is of 128×96 pixels.
6.
RECOGNIZING PATTERNS WITH AER
In this section we demonstrate the efficiency of AER on the node-level using a simple application. We describe an algorithm that can recognize one of four letters in an image given a small set of events, as schematically depicted in Figure 7. Black-and-white templates were manually generated for the capital letters A, C, O and Q. These were specifically chosen to illustrate the system’s capabilities at
Figure 7: High-level overview of image recognition problem.
disambiguating between symbols as similar as the letters C, O, Q, compared to the case when templates are highly distinct (as with the letter A versus the three others). If a similar approach were to be implemented using a traditional non-AER imager, the following steps would be necessary: 1. Capture a frame into memory 2. Process the frame pixel-by-pixel to extract features 3. Compare the features against a database
their scores to be very close when the subject to be recognized is the letter C. Moreover, taking into consideration the events generated by dark pixels – which, although less frequent, are still highly abundant – it is clear that template O would almost always win against template C (Fig. 10). This situation characterizes a false hit, and it happens often when a template contains a major portion of another.
With address-event imaging, these steps reduce to: 1. Process event 2. Compare data against a database Here, item 1 is usually a matter of incrementing a histogram, since the AER nature of the sensor by definition provides feature detection and extraction. Notice that, in AE, there is no step to capture an event, because this happens by initiation of the camera itself, and is usually tied to an interrupt, thus requiring no effort on the part of the micro-controller.
Figure 10: Left: simulation of the first 49 events captured for a noisy subject consisting of the letter C; Middle: hits on template C; Right: hits on template O. If hits had the same weight for all templates, O would have be incorrectly recognized. For the purpose of correcting these unbalances, we define the rank ri of a template Ti as the number bmax of bright pixels on the brightest template (the template with the highest number of white pixels) divided by the number of bright pixels on the current template, bi . ri =
Figure 8: Matching an incoming event (top left) against the templates A, C, and O. In this case, the probability of the subject being a C or an O is higher than that of being an A.
8> >> 8 >< > < >> > :Check if winner () >>: Check if should give up ()
upon reception of an event : x ← event.x y ← event.y if (x, y) ∈ template[i] then template[i].score + + for each template[i]
Figure 9: Pseudocode for the letter recognition application. In the case of the ALOHA, an event is generated as soon as a pixel gathers a certain amount of light. Therefore, one way to process the events is to check whether the x, y coordinates of each incoming event are present in any of the templates in a database. If the coordinates of an event positively matches that of a pixel in a template (Figure 8), the chances of that template representing an actual feature in the captured subject are increased. Therefore, that template’s score is incremented accordingly. This is represented in pseudo-code in Figure 9. Note that, for simplicity, the templates used for this project consist of 2-color masks, as other masks with more shades were found to produce similar results. Using a terminology analogous to that of the board-game Battleship, an event is said to be a hit for a certain template if that template’s pixel at the address of the event is white. Similarly, a miss denotes events whose corresponding pixels are black in the given template. Given that the letter C is a subset of the letter O, most every hit on template C is also a hit on template O, causing
bmax bi
(4)
Given a subject consisting solely of randomly distributed noise, the fraction (ri )−1 can be interpreted as the hit probability of the current template, normalized against that of the brightest template. And so, ranks work by taxing templates proportionally to their brightness in order to equalize their odds. Ranks can be into account by employing a weighted sum approach to compute scores, as shown by the algorithm in Figure 11. In case one of the scores overflows or when the number of collected events reaches a predefined upper-bound, the algorithm should restart itself. This helps reduce false alarms, that is, the incorrect recognition of a feature that is not present in the scene. A winner Ti is declared when the two following inequations are simultaneously true for its score si : si > sj si − s` ≥ K × rmax where s` is the second largest score amongst all templates, and K is an empirically chosen constant. The first condition assures that the winner has the highest of all scores, while
8> >> > >>< >>::>Check if winner () Check if should give up ()
upon reception of an event : x ← event.x y ← event.y for each template[i] if (x, y) ∈ template[i] then template[i].score+ = template[i].rank
Figure 11: Pseudocode of the completed algorithm: instead of incrementing scores equally, a weighted system is employed. This allows for highlyintersecting templates to be correctly identified.
the second one sets a minimum required margin Krmax between the winner and the second place. This margin is proportional to rmax because that is the maximum amount by which a score may be incremented at a time, making K the minimum number of events that need to differ between the winner Ti and the second place T` .
7.
EVALUATION
To demonstrate the benefits of AE Imagers, we evaluated the pattern classification algorithm described in the previous section. Also, to test the feasibility of using a sensor node coupled with a COTS camera to emulate the behavior of AE Imagers in a sensor network setting, we also characterized the overheads associated with image acquisition, processing and communication using our third platform, XYZ with an OV camera module.
7.1
Pattern Recognition
To evaluate the pattern recognition algorithm, two sets of images were used. The first was a set of four letters A, C, O, Q. To obtain the statistics over a large number of images we used the AER model we developed in section 5 to extract events from a set of images. These images were slightly distorted in a photo-editing program, and 10% Gaussian noise was added. The recognition results when attempting to recognize 100 different instances of each letter are summarized in Table 1. Our algorithm required an average of 12.68 events to recognize the letter A. This is because the intersection of template A with any of the other templates is very small, and as a consequence it does not take long for sA to gain a significant margin over the other scores. Similarly, the letter Q, which has the brightest template, is recognized after the collection of an average of 346.67 events. This can be explained by the use of ranks, which forces the system to acquire more events in order to correctly disambiguate between Q and its subset templates, O and C. Still, the maximum number of events required to recognize the letter Q is 560, or roughly half the number of pixels in the image. This test was meant to demonstrate that advantage of prioritized data provided by AER and did not considered image scaling. To ensure that each imaged was centered we computed the centroid of pixels for each image and shifted the image so that the centroid and the center of the image coincide. In our second test, the same algorithm was used to classify between six American Sign Language (ASL) signs. The ASL sign templates used are and two reconstructed image samples from ALOHA shown in Figure 6. For this test we used platform 1 (XYZ + ALOHA). To ensure that the image was centered, we used the first 1000 events generated by the camera for centroid localization. After that we collected 60 trains of events from ALOHA, six for each sign and were used to classify each gestrure. The classification results are
Template Minimum no. of events Maximum no. of events Average no. of events Standard dev. Accuracy
A 8 22 12.68 3.03 100%
Characters C O 20 42 45 343 30.5 192.76 6.72 59.92 100% 99%
Q 62 560 346.67 95.36 99%
Figure 12: Templates used for recognizing ASL signs, and two images reconstructed from experimental ALOHA data. shown in Table 1. The mean number of events required for the recognition of one of the 6 signs was found to be 281.8. Assuming 100 processor cycles per template are required for each event on XYZ, these results show that the recognition of an ASL sign takes, on average: 100cycles 6templates 1 · · ·1281.8events = 13.38ms 57.6M Hz template event This algorithm compares favorably to the traditional, nonAER approach used in the evaluation of the Cyclops platform from UCLA [18], where a few hundreds of milliseconds are needed. This is because the complexity associated with performing successive resource-hogging cross-correlations is replaced by simple additions in the AER algorithm. What is more, both algorithms show similar success rates. Taking into consideration the average rate of events generated by the ALOHA for the type of subjects imaged in this application, the recognition delay for an ASL sign adds up to 4.88 s. Note that this time corresponds to the time that is required to both acquire and process an image in the case of traditional COTS cameras. This number depends on the technology of the particular AER imager employed, and next-generation imagers are being designed for optimum event latency that will reduce the total time down to the order of a few hundreds of milliseconds. Additionally, better accuracy may be achieved by employing learning as a means to automatically generate masks. Our group is also researching imagers that measure different modalities of data from a scene in order to leverage robustness and performance.
7.2
On-Node AER Emulator
An important aspect in the design and specification of AE imagers for sensor networks, is the ability to emulate the behavior of such imagers in a networked setup. This requires the ability to run an emulator like the one described in Figure 5 on a platform similar to platform 2 (described
Sign 1 142 1142 447.3 285.3 10/10
Sign 2 137 755 296.5 195.7 9/10
ASL Signs Sign 3 Sign 4 43 189 67 1587 53.3 480.6 9.2 410.2 10/10 8/10
Sign 5 106 436 228.5 88.1 10/10
Sign 6 91 426 184.6 93.4 10/10
Table 1: Statistic for recognition of the four letters A, C, O, Q (left) and ASL signs (right).
in section 3). To determine the feasibility of this, we evaluated the ability of platform 2 to mimic pixel behavior and run the AER model conversion. We used the emulation of motion detection to benchmark our platform. The windowing feature of the OV camera was used to consider different resolutions. The motion detection emulation is performed in the following way: 1. A 16-bit YUV image is acquired by the camera using the DMA module on the XYZ sensor node. This process takes approximatelly 200ms. 2. The 16-bit YUV image is converted to an 8-bit gray scale image. 3. Consecutive 8-bit images are used in a simple differencing algorithm that detects motion in the image coordinates. 4. Finally, the 8-bit gray scale images generated at the previous step are converted to 1-bit (black and white) images using thresholding. The white pixels in these 1-bit images denote the presence of motion while the black pixels denote the absence of motion. The image coordinates of the motion event can now be easily computed as the centroid of the image coordinates of the white pixels.
Resolution 320 × 240 256 × 64 64 × 64 32 × 32
Memory (Bytes) Color depth (bpp) 16 8 1 153,612 76,812 9,612 32,780 16,396 2,060 8,192 4,096 512 2,048 1,024 128
The reported latencies indicated that it would be possible to sample a COTS camera at 10 to 15 frames per second and still be able to run an AER emulation mode. This task becomes much more challenging at higher resolutions. This can be solved by employing a more powerful processor and additional memory. Of course, this is for emulation purposes only. This would lead to the specification of an AER imager that we will fabricate. A sensor node carrying such an imager would only have to sustain the classification algorithm and would be able to operate with a much smaller processor. Our measurements also revealed some interesting properties about the ARM THUMB processor on XYZ as well as the OV camera. Although the maximum DMA transfer rate for XYZ was computed to be 3.01MHz, the maximum DMA transfer rate between XYZ and OV was measured to be 1.67MHz. This imposed an additional bottleneck on the achievable frame rate. Furthermore, we noticed that when we select to capture images from a subwindow on the OV camera, the effective transfer rate also depends on the location of the subwindow on the image. Process type 16-bit YUV to 8-bit grey 16-bit RGB to 8-bit red 8-bit frame differencing 8-bit image thresholding 8-bit Sobel edge detection Process type
TX Time (s) Color depth (bpp) 16 8 1 115 57 7 25 12 1.5 6.5 3.2 0.4 1.6 0.8 0.1
16-bit YUV to 8-bit grey 16-bit RGB to 8-bit red 8-bit frame differencing 8-bit image thresholding 8-bit Sobel edge detection
Delay(ms) 64 × 64 32 × 32 6.4 1.5 6.5 1.6 6.6 1.6 3.1 1.8 65 15
Table 3: Different image processing times for each of four different image resolutions on the XYZ sensor node.
Table 2: Memory and transmission time requirements for different image resolutions and color depths. Note that each image is stored in the 2Mbits external SRAM. The memory requirements for different resolutions and color depths can be seen in Table 2. For the detection of motion at the head level the 256 × 64 resolution was used. The 2Mbit external SRAM on the XYZ sensor node allows the storage of 8 16-bit color frames, or 16 8-bit color frames or 127.7 1-bit frames in this resolution. Table 2 also shows the average one-hop wireless transmission delay of an image for different resolutions and color depths. Note that the image transfer is made using a reliable protocol developed on top of the IEEE 802.15.4 MAC running on the XYZ sensor node. The transfer delay begins with the initial request of the image and ends when the image has been succesfully transmitted over the wireless link. The transmission times reported in Table 2 include the overhead of the operating system which is equal to 8 bytes per packet. No image compression was performed in order to minimize the payload of each packet sent over the wireless link. The processing time requirements for each of the aforementioned steps is shown in Table 3 for different image resolutions. The time that is required to run the Sobel edge detection algorithm on the XYZ sensor node for an 8-bit gray scale image is also shown. The times in these tables show that the ARM THUMB core on the XYZ can cope well with the image processing tasks at 64 × 64 and below.
Delay(ms) 320 × 240 256 × 64 108 23 111 23.6 114 24.2 52 11.2 3560 248
8.
CONCLUSIONS AND FUTURE WORK
In this paper we motivated the use of AE imagers in sensor networks as an appealing technology with energy, computation and privacy advantages over conventional images. We presented a simple methodology for creating a model for AER and how to use it to build an emulator of AE Imagers using COTS components. Our evaluation has shown that the prioritized nature of AER outputs is very promising. The example classification algorithm showed that AER makes computation shorter and simpler without requiring multiplications. In fact, the results of our experiment suggest that small processors such as the popular Atmel’s AVR128 or TI’s MSP430 could easily used for basic pattern classification and tracking, a task that would be much more difficult and resource consuming to perform using conventional scan sensors. The fact that these imagers can extract measurement information without acquiring an image also makes them privacy-preserving and more suitable for deployment in everyday life applications such as assisted living. Making images very hard to reconstruct from these sensors is an interesting task that should be further considered. Other parts of our research are currently considering an architecture for using localized feature informa-
tion (such as that generated by AE imagers) at the network level to infer more macroscopic motion behaviors [12]. In the imager hardware front, we have fabricated and are currently testing a large pixel-count ALOHA image sensor. The sensor, named ALOHAbig, is QCIF size (176 × 144 pixels) and was designed in a 0.35µm TSMC process. It is based on the ALOHA design and consumes less than 3mW in preliminary tests. In addition, we are fabricating a 3×3mm motion detector chip with approximately 100 × 100 pixels. The design is based on the differentiating AE imager [10] and is targeted to ultra-low power consumption and bias-less sensor networks applications. The software implementation of our AER emulator can be obtained at http: //www.eng.yale.edu/enalab/projects/AERnets.html. In the near future we expect to release wireless sensor node versions of the emulator, followed by prototype versions of the AER chips designed by ELAB at Yale.
9.
[11]
[12]
[13]
[14]
ACKNOWLEDGMENTS
This research was funded in part by the National Science Foundation under award #0448082.
[15]
10.
[16]
REFERENCES
[1] N. Abramson. THE ALOHA SYSTEM - another alternative for computer communications. In In Proc. 1970 Fall Joint Computer Conference, pages 281–285, 1970. [2] M. Barbaro, P.-Y. Burgi, A. Mortara, P. Nussbaum, and F. Heitger. A 100 x 100 pixel silicon retina for gradient extraction with steering filter capabilities and temporal output coding. Solid-State Circuits, IEEE Journal of, 37:160 – 172, February 2002. Issue 2. [3] K. A. Boahen. Point-to-point connectivity between neuromorphic chips using address events. IEEE Trans. Circuits and Systems—II: Analog and Digital Signal Processing, 47(5):416–434, 2000. [4] E. Culurciello and A. Andreou. A comparative study of access topologies for chip-level address-event communication channels. IEEE Transactions On Neural Networks, 14:1266–1277, September 2003. Special Issue On Hardware Implementations. [5] E. Culurciello and A. Andreou. 16 x 16 pixel silicon on sapphire cmos digital pixel photosensor array. IEE Electronics Letter, 40(1):66 – 68, January 2004. [6] E. Culurciello and A. G. Andreou. ALOHA CMOS imager. In Proceedings of the 2004 IEEE International Symposium on Circuits and Systems ISCAS ’04, May 2004. [7] E. Culurciello and R. Etienne-Cummings. Second generation of high dynamic range, arbitrated digital imager. In Circuits and Systems, 2004. ISCAS ’04. Proceedings of the 2004 International Symposium on, volume 4, pages IV– 828– 31, Vancouver, Canada, May 2004. IEEE. [8] E. Culurciello, R. Etienne-Cummings, and K. A. Boahen. A biomorphic digital image sensor. IEEE Journal of Solid-State Circuits, 38(2):281 –294, February 2003. [9] D. Hubel. Eye, Brain and Vision. Scientific American Library, New York, New York, 1988. [10] P. Lichtsteiner, J. Kramer, and T. Delbruck. Improved on/off temporally differentiating address-event imager.
[17]
[18]
[19]
[20]
[21]
In IEEE International Conference on Electronics, Circuits and Systems, ICECS, volume 4, pages 211 – 214, December 2004. A. Linares-Barranco, G. Jimenez-Moreno, A. Civit-Ballcels, and B. Linares-Barranco. On synthetic AER generation. Vancouver, Canada, May 2004. IEEE. D. Lymberopoulos, A. S. Ogale, A. Savvides, and Y. Aloimonos. A sensory grammar for inferring behaviors in sensor networks. In Proceedings of Information Processing in Sensor Networks (IPSN), April 2006. J. Marienborg, T. Lande, A. Abusland, and M. Hovin. An analog approach to ”neuromorphic” communication. IEEE ISCAS 96, 3:397–400, 1996. Atlanta, GA. L. McIlrath. A low-power low-noise ultrawide-dynamic-range CMOS imager with pixel-parallel A/D conversion. Solid-State Circuits, IEEE Journal of, 36:846 – 853, May 2001. Issue 5. C. Mead and M. Mahowald. A Silicon Model of Early Visual Processing. Pergamon Press, 1988. A. Mortara and E. Vittoz. A communication architecture tailored for analog VLSI artificial neural networks: Intrinsic performance and limitations. IEEE Transactions on Neural Networks, 5(3):459–466, May 1994. Omnivision Technologies. OV7649 Advanced Information Preliminary Datasheet. Omnivision Technologies, 2004. http://www.ovt.com. M. Rahimi, D. Estrin, R. Baer, H. Uyeno, and J. Warrior. Cyclops: image sensing and interpretation in wireless networks. In Second ACM Conference on Embedded Networked Sensor Systems, SenSys, Baltimore,MD, November 2004. C. Shoushun and A. Bermak. A low power cmos imager based on time-to-first-spike encoding and fair aer. In IEEE International Symposium on Circuits and Systems ISCAS, volume 1, pages 5306–5309, May 2005. T. Teixeira, E. Culurciello, and A. Andreou. Event-based imaging with active illumination in sensor networks. In IEEE International Symposium on Circuits and Systems, ISCAS, Kobe, Japan, May 2005. S. Thorpe, A. Delorme, R. Van Rullen, and W. Paquier. Reverse engineering of the visual system using networks of spiking neurons. IEEE International Symposium of Circuits and Systems, ISCAS, 4:405–408, 2000.