Addressing some challenges in autonomic monitoring in self-managing networks Ranganai Chaparadza, Hakan Coskun, Ina Schieferdecker
Abstract- Self-monitoring is one of the key expected capabilities of an autonomic systenm An autonomic system can be a single network node or the entire network as an entity, having the ability to automatically adjust its behaviour based on the conditions in which the system and its components work. Self-monitoring for the purposes of self-configuration, cooperative event detection by a number of systems in a network, knowledge/imformation distribution, service-diagnosis and selfprotection requires a number of challenges/questions to be addressed. In this paper, we present the concepts behind selfmonitoring as a capability of a single node and as a capability of a network that is considered as an entity. We also discuss the challenges and questions to be addressed when designing and deploying self-monitoring mechanism for a single node and for an entire network and, we present some solutions to these chaUenges. Because self-monitoring is broad, we imit our focus to self-monitoring applied to inbound/outbound protocolspecific traffic at some point(s). As part of the solution to some challenges we try to address, we introduce the concept of OnDemand Monitoring (ODM) of protocol-specific traffic. Index Terms- Self-monitoring, on-demand monitoring, dynanic on-demand SNMP micro MIBs for exploiting the power of protocol/traffic analysers.
I. INTRODUCTION THE network landscape is changing drastically. The research community recognizes that next generation networks will exhibit novel features enabling the development of new network technologies and environments, unlike what we are experiencing today. It's not a big deal to come to this conclusion: topics like selfhealing networks, autonomic communications, ad-hoc networking, swarm intelligence, multipath routing, etc. allow us to get a picture of the "futuristic" approaches and properties that are going to form the networking world of the future. The raison d'etre behind such developments is to enable services and applications with new features. The downside, however, is that the dynamics and the complexity of such environments will increase to a great extent.
Traditional monitoring and measurement functions in the Manuscript received June 30, 2005. Ranganai Chaparadza, is with the Fraunhofer FOKUS Institute for Open Cormmunications, 10589, Germany (phone: 00 49 30 3463-7102; fax: +49 30 3463-8000 e-mail:
[email protected]).
Hakan Coskun, is with the Technical University of Berlin, 10589 Berlin, Germany. (e-mail:
[email protected]). Ina Schieferdecker, is with the Fraunhofer FOKUS Institute for Open Communications and with the Technical University of Berlin, 10589 Berlin, Germany (e-mail:
[email protected]). We thank the reviewers for constructive conmnents.
14244-0000-7/05/$20.00 C2005 IEEE.
traditional Internet mostly have a diagnostic role, often requiring human intervention. Next generation networks will employ self-monitoring as part of self-management. A network that is said to have self-monitoring capabilities is a kind of network that does not require human intervention or intervention from outside the network, to decide on triggering the monitoring of traffic or some resources. It is a
network that takes decisions on its own, about what to monitor, when to monitor and where (a point(s) within the network) to trigger monitoring. Managing the services and quality of service (QoS) will get more complex than in traditional IP environments. Management of these networks will also evolve to self-management, incorporating new approaches which without doubt are going to demand the gathering of extensive information and knowledge about the state of specific devices/machines and the network, as well as efficient methods of handling monitoring data.
Irrespective of what will come, one thing will remain the same. Computers will use protocols to communicate; messages will be exchanged via links/routes independent of the used communication principles. By capturing and analysing protocol specific packet exchanges at strategic points in the network, a lot of knowledge can be deduced about complex protocol interactions. Such knowledge, when gathered on-demand, enables the invocation of, among other functionalities, self-diagnosis, self-configuration and automated service troubleshooting in a self-managing network [1]. As a result, rich and more intelligent monitoring of traffic flow and resource utilisation will be required by next generation networks. In such networks, monitoring does not just have a diagnostic role but become an important tool for supporting the network operation and providing service auditing for both traditional and valueadded services. Therefore, network monitoring and measurement is becoming more important than it was until now. In this paper we strive to answer the questions about requirements these new approaches impose on the monitoring of the network(s) and what changes current monitoring systems will undergo to meet these requirements. To answer these questions seems to be impossible because nobody can foresee how the future will look like in detail. But if we focus only on a specific research topic, like
commnunications and its visions [2], like selfmonitoring, it should be feasible to find sone answers. autonomic
A system that is said to have self-monitoring capabilities is a kind of system that does not require human intervention
895
burdened by having to gather data about traffic flow i.e. bulkstats gathering [131 or Netflow [121 data collection and still being expected to fulfil their primary function, that is: routing and forwarding packets. By moving some traffic related data collection from routers to some dedicated cheap tapping devices i.e. standard PCs connected to span/mirror ports on a switch and, installing probes on the tapping devices to passively monitor protocol-specific traffic, perform computations on the captured traffic such as rate of flow and detect traffic patterns, we can reduce the burden (resource consumption) on devices like routers. This is, so to say, burden reduction on scarce and critical resources. As will be seen later, such probes should be capable of detecting traffic pattems, propagate event notifications and if necessary decode protocol-specific traffic as may be required for autonomic service diagnosis or troubleshooting. Part of the answer to the previous question also lies in the concept of On-Demand Monitoring (ODM) and the notion of ODM session management, whereby monitoring is triggered only when it is necessary to do so and resources must be freed whenever monitoring is no longer necessary. When the monitoring is triggered by an application within a node for the purpose of monitoring an internal resource or inbound/outbound protocol-specific traffic, we call this locally-triggered ODM. When a remote system creates an ODM session on another system, we call this remotely triggered ODM. The points where on-demand monitoring can be applied includes any node on which traffic can be captured and analyzed, including the tapping devices. In this paper, we focus on protocol(s)-specific traffic monitoring and so we define On-Demand Monitoring (ODM) of protocol(s)-specific traffic, as the kind of monitoring that imposes the following requirements on the target system on which the monitoring of packets or protocol messages is demanded:
from outside itself, to decide on triggering the monitoring of traffic or some resource. It is an entity that takes decisions on its own, about what to monitor, when to monitor and where (a point(s) within the network) to trigger monitoring. 11. ADDRESSING THE CHALLENGES IN SELF MONITORNG
A. A short discussion on the challenges/questions The main challenge in self-monitoring is that it demands a lot of resources (CPU, memory etc) to be available to monitoring tasks such that the performance of applications and services running on the system should not be severely degraded by these overhead monitoring tasks, and this is difficult to achieve because resources are costly. Selfmonitoring mechanisms of a single node can consume a lot of resources, mainly CPU and memory. On the other hand, self-monitoring mechanisms for the entire network as an entity, consumes bandwidth in addition to resources consumed in various monitoring points (nodes, data collection points etc) in the network because, systems within the network would need to exchange information as demanded by the monitoring objective. One of the purposes of self-monitoring is self-configuration, which requires that certain systems participating in the global network monitoring objective be able to send event notifications to each othffer or to a central decision point, so that the network nodes are automatically re-configured to adapt to the changes in the network state. Another purpose of selfmonitoring, as a capability of the network, is to allow systems participating in a global monitoring objective to be able to co-operatively or collectively detect an event by triggering monitoring activities on each other and, distributing knowledge such as protocol-specific traffic flow rate, overloaded links and routers, to all interested systems. Where systems trigger monitoring tasks on each other and where knowledge distribution is required, security becomes an issue to be addressed. A self-monitoring network can also employ self-diagnosis, requiring that test packets are sent from one system to another while some systems are demanded to monitor (track) the packets or conversations taking place between selected systems, and this might require that one of the systems needs to remotely collect protocol-specific packets captured by a number of systems in order to create a single, consolidated view of a service that spans a number of system interfaces and protocols. As will be seen later, the concept of on-demand monitoring answers some of the questions about how to address these
*
*
*
challenges.
One of the questions we seek to answer is: how can selfmonitoring mechanisms be implemented in such a way that scarce and critical resources are not consumed unnecessarily? To answer this question, we first identify the kind of monitoring data that can be collected elsewhere and not within a node whose resources are limited. For example, traditional monitoring methods like SNMP are selfmonitoring mechanisms in nature, in the sense that, a device
*
such as a router, autonomously collects data, applies some reasoning (policies) on the data and can take some actions e.g. rate limiting or sending notifications to management systems. Yet, such data collection points become heavily
896
The ability to receive and process monitoring requests at any time. A request triggers the monitoring and, selective traffic monitoring is achieved via rich traffic filters. The ability to suspend, resume and stop a monitoring task upon the reception of an authorized request. This implies a notion of an ODM session and session management. The ability to receive and process data retrieval requests and to send responses (requested monitoring data) to the requester. This implies that the monitoring data is stored by the target system in a data model well understood by the requester e.g. an SNMP MIB data model [7], [8]. The ability to detect dynanically user defined events and send notifications to some user defined destination system(s). The ODM session owner defines the event(s) to be watched for and specifies where notifications should be sent. The events are derived from the captured traffic e.g. "no SIP packet captured within 20 seconds from the start of capturing" can be specified as an event, resulting in a
notification.
*
*
* *
becomes free when the ODM session dies. It checks for the authorization of a particular ODM session owner to modify any monitoring session. It starts a multi-protocol analyzer engine, passing to it the MIB region's root ID. It also maintains a list of started multi-protocol analyzer engines and their associated capture filters. The ODM commands (requests) it receives are:
The ability to execute special task programs (actions) upon the reception of an authorized request or due to the occurrence of a user specified event. The ODM session owner specifies the action to be taken by the target system when an event has been detected. Provide timestamps associated with the departure/arrival of each captured packet if required by the session. Security guarantees for an ODM session owner i.e. encryption of ODM requests and responses from the target system. The ability to create dynamic on-demand data models for storing monitoring data derived from the captured traffic and specific to each ODM session running on the target system. For instance, dynamic on-demand SNMP micro MIBs for storing data derived from the captured traffic e.g. the computed rate of flow of the captured traffic, packets summary table of the captured packets and, Object Identifiers (OlDs) allowing a remote or local ODM session owner to import a captured packet(s) for off-line analysis or to view particular fields of a particular captured packet, as the packet was decoded on the target system, allowing the use of SNMP to view monitoring data if the ODM session owner is remote. The good thing about the SNMP MIB data model is that, it allows a remote system to retrieve only the information that is required at any time via the use of OlDs, without having to use bandwidth consuming methods such as reading a lot of data using file transfer and then scanning the data for the required details.
*
* * * * *
ODM trigger (start) request, which specifies the traffic capture filter to be used e.g. "ip proto 17", the default session TTL (Time-To-Live), and packet discard rate (PDR),that is, the rate at which packets are deleted from memory after being used in some
computations, Pause-session(input-param: key), Resume-session(input-param: key), Stop-session(input-param: key),
Set-Filter(input -params : key, t raf f ic filter), Refresh-session(input-params: key, TTL).
new
This component is implemented with an interface that allows special task DISMAN-JASMIN-SCRIPT MIB [1], [61 based scripts to interact with it. Such scripts can be downloaded into the ODM probe by a session owner specifying the actions to be taken when some specified events have occurred such as events computed/deduced from the captured traffic. ODM Operations,requests and
III. OuR ODM-CAPABLE PROBE AND HOW IT ADDRESSES THE CHALLENGES IN SELF-MONITORING THAT IS LIMITED TO
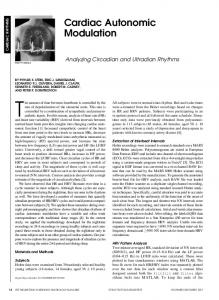
TRAFFIC MONITORING We designed a probe that fulfils the outlined requirements for an ODM target system. The probe consists of a number of inter-working components integrating the power of SNMP and Protocol analyzers. The SNMP components are based on the Net-SNMP open source tools [5] and the multiprotocol analyzer parts are based on a modified Ethereal [4]. Figure 1 shows the design of our ODM Probe that integrates a number of tools and their strengths. The probe components are described below. A. The ODM-Request Handler (Access/Admission Control Server) It is a server component that processes ODM requests and comrnunicates a unique private key with the requester (ODM session owner), useful for subsequent interactions with the probe. The corresponding external arrows on the
top indicate ODM commands and the responses. All interactions between the ODM Server and a particular client (session owner) use the Secure Sockets Layer (SSL) for security. It manages the MIB region assignment (sub tree hook) for each unique ODM session requiring an on-demand MIB creation. When a request arrives, it assigns a MIB region root identifier to be dynamically registered by components inter-working with the SNMP Master Agent e.g. "1.3.6.1 .3.X", where X is the root sub-tree hook and
Figure 1: The ODM Probe B. The Multi-ProtocolAnalyzer Engine This is the component that does the capturing, filtering and decoding (if required) of the protocol specific traffic specified in the request. It creates two threads, the MIB Manager, the Event Detection and Computation Engine. It also listens for ODM monitoring session modifications issued by the session owner. It stores each packet's decoded protocol tree if required by the ODM session owner, subject to discarding as specified by the session owner. We implemented this component as a modified Ethereal (Tethereal).
897
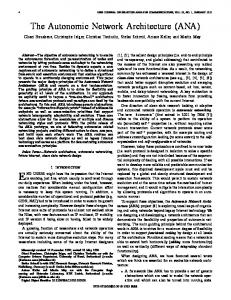
C. The MIB Manager This component implements an algorithm for the SMI MIB definition and advertisement to destinations specified by the ODM session owner. It handles the freeing of memory by discarding redundant packets from the SNMP table of captured packets at regular intervals as specified by the session owner. It also generates traffic related notifications based on the events and expressions specified in the embedded IETF Event MIB [91 and the IETF Expression MIB [101. It also implements a generic packet Object Identifier (OID) for binding a specific user specified packet so that the requester can remotely retrieve a particular packet of interest as may be necessary during automated troubleshooting and service diagnosis. In order to retrieve a particular packet we use a push model. The requester tells a push-packet handling script to push a particular packet e.g. the Nth packet from the first captured packet to the generic packet OlD so that the requester can remotely view the packet or certain protocol fields of the packet via SNMP. This component is implemented as a SNMP subagent based on the AgentX protocol [I I] and, is a thread created by the associated analyzer Engine. Figure 2 shows a fragment of an example SMI definition of an on-demand micro MIB that the MIB manager can create and advertise to interested parties as specified by the session owner. ---Current Rate of flow of ODM specified traffic rateOfFlow OBJECT-TYPE SYNTAX Unsigned32 MAX-ACCESS read-only STATUS current DESCRIPTION "The computed Rate of Flow of the specified traffic."--: { ODMSessionSubTreeHook I} Event Notification' odmDescribedEventX NOTIHCATlON-TYPE OBJECTS {EventTimeStamp, EventDescription) STATUS current DESCRIPTION "An event described by the ODM session owner" : ODMSessionSubTreeHook 2 } The Protocol Hierarchy Statistics Table Protocol HierarchyStatisticsTable OBJECT-TYPE SYNTAX SEQUENCE OF protocolStatisticsEntry MAX-ACCESS not-accessible STATUS current DESCRIPTION "This table contains entries for statistics of each protocol within the stack, over a capture duration specified by the ODM session owner." { ODMSessionSubTreeHook 3)
packet details i.e. protocol fields or can be based on some computations, and sends notifications to the designated recipients or triggers the execution of some special task programs. Some event triggers require some computations to be performed. This component does some computations e.g. some statistics on the captured traffic. It also listens for any session modifications. This component also creates a packet discarder thread that takes care of discarding the packets that have already been used in computations and are no longer required. This component is implemented as an SNMP subagent based on the AgentX protocol [111] and, is a thread created by the associated analyzer Engine. Below is an example of a behaviour specification file that drives this component and is uploaded by the ODM session owner into the ODM probe when the ODM request has been accepted. We developed an Event Description and Behaviour Specification Language that is an XML-like language. It is used to specify events to be watched for by a particular ODM monitoring session and specifies the behaviour of the session. Figure 3 shows how a session owner describes an event to be watched for a specified packet of interest, provide the destination or destinations where an SNMP inform (notification) message should be sent or describes an event based on whether some packet has been captured or not after a specified time, including any action to be taken (script execution). The behaviour description includes what to compute e.g. rate, computation step e.g. every 600 seconds, whether computations should be stored or the computed values should be propagated as notifications to interested systems and, continuous checks on whether the rate exceeds the specified threshold, resulting in an action (script execution) or notification.
The SNMP Master Agent This component takes care of all SNMP operations. It handles all the ODM monitoring data collection commands (snmp-get etc.) and other SNMP operations on the system beyond ODM. It registers the MIB regions assigned to a E.
particular ODM session and dispatches requests to the appropriate running sub-agents, the MIB Manager and the Event Detection and Computation Engine.
Three of the components, namely the MultiProtocol Analyzer Engine, MIB Manager, Event Detection and Computation Engine are created on-demand at runtime for each ODM session, depending on the needs of the session. The MIB Manager, Event Detection and Computation Engine are created only if necessary because an ODM session might require only the capturing of traffic and storing the packets into a file, without decoding the packets, so that the session owner can retrieve the file and decode the packets offline. The other components are shared by all ODM sessions running on the probe.
Figure 2: Fragment of an example SMI dermition of an on- To name a few application examples: considering selfdemand micro MIB configuration of a network, ODM sessions can be created at strategic points in the network, where ODM probes are D. The Event Detection and Computation Engine instrumented, and demand that each session computes and This component detects events which can be based on propagate the computed current rate of flow of the specified
898