OpenPMU and explore the applications of data for electric power distribution systems. ... capable of interacting with monitoring systems. Numerous technologies ...
Addressing the Challenges for Integrating Micro-Synchrophasor Data with Operational System Applications E.M. Stewart, Member, IEEE, S. Kiliccote, Member, IEEE, C.M. Shand, Student Member, IEEE, A.W. McMorran, Member IEEE, R. Arghandeh, Member, IEEE, and A. von Meier, Member IEEE Abstract— This paper describes challenges for integrating high fidelity data with utility distribution operations. Two research projects are described microsynchrophasors (µPMU) and OpenPMU and explore the applications of data for electric power distribution systems. Index Terms—Phasor measurement units, voltage measurement, power distribution, model validation, smart grids.
T
I.
INTRODUCTION
oday’s electric power distribution systems have minimal diagnostic capabilities, with extensive lag for situational response, constraining the opportunities for cleaner, more reliable and affordable energy. With the emergence of Distributed Generation (DG) and increasing Demand Response (DR), the need for real-time monitoring and quasi real time analysis of grid behavior is growing. Two-way communication with both distribution planning and operations tools is desired, but there is a lack of standards to enable such communication and a lack of analysis packages capable of interacting with monitoring systems. Numerous technologies are being piloted to improve visualization at the operations level including micro-synchrophasors (μPMUs) technology and line measurement devices, but cost is often not balanced with the benefit a wide scale implementation would have [1][2]. Two development projects are discussed in this paper, OpenPMU and μPMU. Both projects are developing low cost synchrophasor measurement and data interpretation devices. California Institute for Energy and Environment (CIEE) at the University of California, in conjunction with Lawrence Berkeley National Laboratory (LBNL) and Power Standards Lab (PSL), are examining the capacity for μPMUs to improve performance of electric power delivery and coordination by supporting distribution system planning and operation functions [3][4]. OpenPMU [5] is a project set up by Queen’s University Belfast, who was joined by SmarTS Lab at KTH Stockholm, to create open source PMUs. It is a custom design based on National Instruments products and is intended to be a more accessible design than commercial options, making it low This research is sponsored in part by the U.S. Department of Energy ARPA-E program (DE-AR0000340)
978-1-4799-6415-4/14/$31.00 ©2014 IEEE
cost and is aimed at providing an open platform for both hardware and software that can be applied to academic and research projects. μPMUs are being demonstrated in numerous utility and campus locations through an ARPA-E award. Three key development areas are identified: supporting distribution system planning and operation functions related to utilityowned infrastructure; supporting diagnostics of wide-area system conditions from a larger number of measurement nodes; and supporting the control of distributed energy resources (DER), including generation, storage and DR. Data will be communicated from the demonstration system and analyzed for potential development applications, including state estimation. This data will also be essential for model validation. Common challenges are identified and discussed for measurement of high fidelity distribution data for operations applications; data quantity, availability, resolution and quality, software compatibility, need for model validation and system visualization. II.
BACKGROUND
Distribution Management Systems (DMS) currently address specific issues, such as visualization of outages using Advanced Metering Infrastructure (AMI), and Supervisory Control and Data Acquisition (SCADA) and manual reports. DMS system development normally focuses on specific areas of expertise of the vendor [6][8]. The dynamic behavior of Distributed Energy Resources (DER) mixes and distribution automation is not characterized in existing planning and operation tools [7][4] One example of the use of the μPMU data is in monitoring and characterization of high renewable penetration feeders and generators. Key to understanding the impact of high penetration photovoltaic (PV) installations is to measure and characterize high-resolution (512 samples/cycle) power data on distribution circuits both 'before' and 'after' high penetration PV has been installed. Individual distribution circuits, and DER can be characterized, modeled, and validated. Through empirical measurements in conjunction with modeling and analysis of distribution circuits, the outcome will be a reference design for μPMUs enabling adoption of a new distribution management approach. The underlying hypothesis guiding the approach is that
voltage phase angle, the precise difference in timing between the voltage waveform at different locations on the AC grid is a uniquely informative state variable for power distribution systems. Relevant phase angle differences in distribution systems are small (fractions of a degree), and are not readily measurable with existing transmission system synchrophasor technology [1][2][9]. Once observable, with a highly accurate and low-cost μPMU device, this state variable will prove versatile and economical to enable a broad range of applications to improve performance of the electric grid. Applications for use of high fidelity distribution line data require simulation and comparison of measurements from multiple locations in near real-time, requiring a fast communication network and the ability to quickly convert raw data into actionable operational intelligence. Phase angles at the distribution level change by a much smaller amount than in transmission, and therefore have been largely ignored by distribution. One of the important features of the analysis work for μPMU data is its potential integration and representation within distribution operations tools. Detailed measured data in a validated power systems model allows recreation of issues, such as a particular fault analysis, or dynamic scenario, which may not consequentially occur during the demonstration phase. Phase angle visualization at the distribution level requires simulation software accuracy of at least 0.01 degrees. Often this phase angle data is located in the back end or processing area of the software. For commercial and proprietary software there is often no ability to customize or see this back end. The distribution modeling and analysis world is broadly split into planning, diagnostics and control, and operations. In the near term future grid the needs and concerns of distribution operators and planners will begin to merge [9][10]. Distribution planning utilizes a grid topology model that is becoming more dynamic, with planners having less advanced knowledge of topology changes. In the past, changes were planned months in advance. With active network management, DG and DER changes are planned weeks or days in advance. With more variable resources this time-frame may potentially drop to minutes and seconds. The traditional roles of distribution planning and operations software become fuzzy as operations will consider further ahead conditions and scenarios for day-to-day operations. The models used by both distribution planning and operations must become more accurate, synchronized and informed by real time measurement devices. Operators and planners will need to coordinate their actions to ensure a reliable and efficient distribution grid. The software tools will need to adapt to these changes and provide services to both departments to remain valid.
III.
OPENPMU
A. Open Source Platform for μPMU OpenPMU supports the IEEE C37.118.1-2011 Standards for measurements and data transfer making it compatible with Phasor Data Concentrators such as OpenPDC[5]. By using an open design and standard hardware components, the current generation of devices can be built for approximately $1500. OpenPMU thus provides a potential platform on which the μPMUs can be constructed at low cost and by using an open source platform can be customized and extended to meet the requirements of distribution utilities. B. Embedded Microcontroller Implementation OpenPMU uses National Instrument’s LabVIEW as its main software environment [11]. The source code for these modules is open source but ties any implementations to this runtime and a x86 execution environment. Moving the software to a language such as Python or C would enable the OpenPMU to be run on low-cost hardware such as the Arduino platform or Raspberry Pi. Such modern microcontroller platforms provide low-cost, high performance computers, support for external data input, high capacity flash storage and full Linux environments. The use of such a platform combined with standard, commodity components has the potential to reduce the costs of an OpenPMU based μPMU to $500 or below. At this cost level a large number of low-cost, open platform μPMUs could be deployed across a distribution network without requiring significant capital outlay or tying the utility to one specific vendor implementation. IV.
CHALLENGES OF HIGH FIDELITY DATA INTEGRATION
A. Visualization Currently the majority of transmission grid operators visualize the distribution grid as an equivalent load, modeled with either offline load measurements [12], or substation level real time measurement [11]. Advanced distribution grid operation strategies have visualization of smart meter or AMI status, allowing observation of magnitudes and possible locations of outages. The location is determined by a combination of customer calls and meters, which are still receiving power/service [4]. Often with increased distributed generation, electric vehicles and changing topologies, the distribution line conditions could be significantly more negative [7], while the substation measurement remains within reasonable engineering limits. Many distributionplanning tools currently address specific issues, such as visualization of voltage or flow conditions. SCADA is real time operational data communicated from a measurement and control point to a utility interface, and normally stored in a historian system for future analysis. SCADA normally includes Voltage, Amps, Real and Reactive Power Flow, and Transformer or Switch Status. SCADA includes non-operational data, or event
summaries such as reports or a sequence of events. SCADA normally records and transmits data over 2 to 4 seconds time window for real-time operations, but is often stored in the historian system on a 5 to 15 minute sample basis.
and leads to a lack of confidence in analysis. Most utility distribution models are based on geographical information system (GIS) data. GIS data is a series of interconnected features and layers documenting coordinates of key equipment and topology, for example pole locations and conductor types.
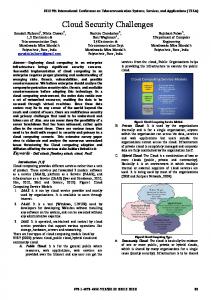
Figure 1. Data Acquisition Timescale
AMI communicates to a meter data management system and can then be integrated with power systems applications. Currently AMI is used for billing, demand response, net metering and outage information. Utility operations will have an ability to see the customers status, supplied power or not, for outage management. While currently the applications are limited, a number of future applications could be assisted by data collected at the customer including voltage, real and reactive power flow if DER is present and power quality. Applications AMI data could also be synchronized with μPMU locations and SCADA to provide an accurate picture of grid behavior, and validate each source effectively. Advanced distribution PMU devices, can output over 20 data points per distribution feeder at a subsynchronous rate [12][1]. The data can be stored internal to the device, or communicated directly to the utility or analyst, and using applications developed through the ARPA-E project intelligible and informational data is provided to operators and planners. As this data is provided there is a need to firstly integrate it with existing or new communications systems other sensor technology, and then input this combined data to distribution planning and operations tools for either real time, near real time, or longer term planning activities. Distribution planning and operating tools will need to process large volumes of measurement points, and potentially run steady state, and dynamic analyses with more variable grid conditions, including the impacts of grid automation, fast varying renewables and demand response resources. Grid resiliency and stability in the modernized grid will depend upon the measurement and communications of high fidelity data with advanced analysis tools. Currently custom operations tools accept data inputs from SCADA (normally on a 15 minute time step), weather measurement devices (15 min to hourly time step), and AMI data for outage location and management (Figure 1). The μPMU data will be in the range of nano seconds to minutes (Figure 2. ). B. Data Quality and Volume Error in data is prevalent in the distribution system [5][11]
Figure 2. μPMU measurement data time steps
GIS data is exported through often proprietary methods to software packages for electrical simulation. The accuracy of the distribution model is inherently based upon the GIS system. The common sources of error include a lack of accurate detail and parameters for equipment such as lines and transformers; inaccurate or estimated customer load data (aggregate and locational); inaccurate PV and DER characteristics (aggregate and locational); and topology errors such as unknown switch status or disconnected equipment. Naming and identification of components is of major concern, and not often synchronized between DMS, planning and operations. Substation names may not be identical across applications and therefore must be matched to connect the entire model [11]. Ensuring identifiers are unique and compatible across formats is critical in ensuring that different systems and applications are all referring to the same component. The meta-model used to describe the types of components and their relationships also varies across applications requiring significant effort to transform data between systems while ensuring names and identifiers are maintained. Significant gains could be achieved with a common, detailed format in these datasets [5]. Distribution topology is a major source of error for both the planning and operations models, with switch status being often unknown without integrated SCADA at the device. C. Model Validation Model validation is a desirable application of enhanced measured data. Distribution planners and operators must be accurately informed to make the correct choices in both the near and far term. Consistent distribution system models expedite the modeling and analysis process and allows for “what-if” level analyses to stay ahead of system change. This will maximize grid performance technically and economically and minimize risks of stranded assets and unknown errors.
Key validation points are: the recreation of steady state performance; running simulation scenarios for which measured data is available; and identifying the location for sources of error. Dynamic measured response and analysis in selected operations can be used with enhanced measurement to determine if devices are characterized effectively. It is not uncommon for DMS and GIS models to be managed separately without any form of integration and synchronization. Many utilities do not have a working distribution network model suitable for being used with power system analysis applications which is required to automatically determine the location of the measurement device
Figure 3. μPMU Workflow
V.
DATA APPLICATION: STATE ESTIMATION
Topology detection and power flow combined form the basis for state estimation. Dynamic circuit behavior applications will require comparison of measurements and simulation from multiple locations in near real-time. The dynamic applications require a fast communication network and the ability to quickly convert raw data into actionable operational intelligence. In its simplest form state estimation is prediction of voltage and current magnitude and angle, at all buses or nodes, using existing voltage, current, real and reactive power measurements, and a system which accounts for missing or bad data. A detailed, validated physical model of a distribution network is necessary for accurate state estimation analysis. As discussed, this is not often available and when models do existed they often have no validation of circuit topology. Utilities must maintain correct and updated status of switching devices in the distribution network model for efficient control and operations. The state estimation algorithm for transmission networks cannot apply directly into distribution networks. The operation and planning philosophy of distribution networks are considerably different, with single/three phase unbalanced loads; large numbers of nodes; low X/R ratios; and radial and meshed configurations. These differences must be accounted for in distribution planning software, and therefore in topology detection and state estimation applications. Load distribution
is more complex in distribution than transmission. Measurement device placement directly impacts the observability of the system, and the application must balance the optimal number of meters required for convergence. The topology of distribution networks changes faster than transmission networks but as the majority of switching devices in distribution networks are not remotely monitored topology detection will be an essential feature of the technology applications if accuracy is to be increased. Combining high quality and high resolution μPMU data with conventional measurements to achieve optimal state estimation scheme is challenging [14][15] and software will need expanded processing capabilities. Data volume is increased when more devices requiring measurement are added to the system and the resulting computational burden is therefore higher. State estimation combined with power flow analysis provides a number of outputs including: switching device status, active and reactive power flows at nodes and branches, load consumption, capacitor bank operation, generator behavior and output, transformer tap position, current flows and power factor at both sides of each branch and often a confidence index for the computed solution. State estimation tools should detect bad analog measurements, and determine the minimally dependent and critical set of measurements required for accuracy. In distribution networks locating and correcting for uncertainty due to frequent changes in the topology together with the small number of existing measurement devices. One topology must be used to initiate the state estimation process, but then adapt to regularly changing topologies and potentially provide optimization functionality. The topology processor must identify bad data and find errors in the status of some switching devices. State estimation tools, commercially available and potentially informed by the μPMU and OpenPMU data are grouped either as customized packages provided by vendors as part of a outage or energy management system, but there is a growing trend of state estimation tools coupled with other existing packages for off-line distribution analysis. This is a further example of where real time applications and off-line applications are coming together. The customized packages are generally an adaptation of transmission technology that is then integrated with a distribution management system. The technology buy in to obtain the required number of measured points for estimation is often not defined, meaning the number of measurements point and required technology and communications structure is unclear for a given network. Vendor specific measurement technologies are also often recommended and customized solutions also often refer to balanced node measurement points and may not accurately account or estimate system unbalances [15]. VI.
CONCLUSIONS AND FURTHER WORK
In conclusion, affordable, high-resolution measurement of
voltage phase angle, and other distribution line data will provide significant new options for actively managing distribution systems. The distribution grid is growing in complexity and integration of this high fidelity data is essential for safe and efficient grid management. The theories used by transmission grid operators cannot be directly applied to visualize the distribution grid, which until recently was modeled as a basic load. Some key applications of high fidelity data are discussed including model validation, DER characterization and state estimation There are many benefits of load and state estimation in distribution, which could be realized through improved measurement and simulation integration including improved reliability, and power restoration, less constraints, and quicker adaptation of the grid to changing conditions. Many challenges need to be addressed for distribution state estimation. Grid modeling and characterization of sources for transformers and low voltage modeling will be essential to validate the existing distribution system models and inform future development, above current standards. This paper discussed both technology and measurement data applications through two projects μPMU and OpenPMU. While ability to measure high fidelity distribution data is essential, through devices such as the μPMU, interpretation, standardization of format and communication of the data through research such as OpenPMU is a matching essential piece. REFERENCES [1]
M. Wache, M and D. C. Murray, “Application of Synchrophasor Measurements for Distribution Networks” Proc. 2011, IEEE Power and Energy Society General Meeting, pp 1-4 [2] Real time application of Synchrophasors for Improving Reliability, North American Electric Reliability Corp., 2010 [3] http://pqubepmu.com/about.php [4] Laverty, D.M., Best, R.J., Brogan, P., Al Khatib, I., Vanfretti, L., Morrow, D.J., “The OpenPMU Platform for Open-Source Phasor Measurements”, IEEE Transactions on Instrumentation and Measurement, Volume 62 Issue 4, 15th February 2013, pp701-709 [5] OpenPDC Project Pages, Codeplex Internet: http://openpdc.codeplex.com/ [6] A. McMorran, E Stewart, C Shand, S. Rudd, G Taylor, “Addressing the Challenge of Data Interoperability for Off-Line Analysis of Distribution Networks in the Smart Grid”, Proc. 2012 IEEE PES T & D Conference and Exposition, pp1-5. [7] J.A. Martinez, J. Matin-Arnedo, “Tools for Analysis and Design of Distributed Resources – Part I: Tools for Feasibility Studies”, IEEE Transactions on Power Delivery, Vo. 26, No. 3, July 2011. [8] EPRI smart grid demonstration initiative, integrating DER with T & D Operations; Electricity Distribution - Part 2, 2009. CIRED 2009. The 20th International Conference and Exhibition Issue Date: 2009, page(s): 1 – 14, ISSN: Print ISBN: 978-1-84919-160-9 [9] NIST Framework and Roadmap for Smart Grid Interoperability Standards, Release 2.0, NIST Special Publication 1108R2 [10] Sandia Report: SAND208-0944 P, February 2008, Renewable Systems Interconnection Study: Advanced Grid Planning and Operations, M. McGranaghan, T. Ortmeyer, D. Crudele, T. Key, J. Smith, P. Barker [11] Laverty, D.M.; Vanfretti, L.; Best, R.J.; Morrow, D.J.; Nordstrom, L.; Chenine, M., "OpenPMU technology platform for Synchrophasor research applications," Power and Energy Society General Meeting, 2012 IEEE, pp.1,5, 22-26 July 2012
[12] Metrology for smart electrical grids, Precision Electromagnetic Measurements (CPEM), 2010 Conference on, 2010, pp 529 – 530, ISBN: 978-1-4244-6795-2 [13] On the impact of Smart grid Metering infrastructure on load forecasting, Communication, Control, and Computing (Allerton), 2010 48th Annual Allerton Conference on, Issue Date: 2010, pp 1628 – 1636, ISBN: 978-1-4244-8215-3 [14] S. Hamilton, “Smart Grid: A Model Centric Approach,”, white paper, Brookhaven National Laboratory, Dec 2012 [15] R. Arghandeh, A. Onen, J. Jung, R. Broadwater, “Interactive Assessment of Multi-Harmonic Sources in Distribution Networks ”, Electric Power Systems Research, Vol 105, pp 124-133, Dec 2013
VII.
BIOGRAPHIES
Emma Stewart (M ’08) completed her undergraduate degree in Electrical and Mechanical Engineering from the University of Strathclyde in 2004 and a PhD in Electrical Engineering in 2009. She joined BEW Engineering (now DNV KEMA) as a Power Systems Engineer in March 2009 and held the position of Senior Engineer in the Transmission and Distribution team where she led distribution modeling and analysis and high renewable penetration studies for California Solar Initiative Studies. Dr. Stewart joined Lawrence Berkeley National Laboratories in 2013, and is currently engaged in distribution measurement and analysis techniques for smart grid applications. Sila Kiliccote is a research scientist leading the Grid Integration Group and deputy of the Demand Response Research Center and at Lawrence Berkeley National Laboratory. She has been part of the Automated Demand Response team developing demand response communication signals and building technologies that respond to these signals. She is an electrical engineer with a master’s degree in building science from Carnegie Mellon University. Corinne Shand (S ’11) received the M.Eng in Electrical Energy Systems from the University of Strathclyde in 2013. She is currently a Research Engineer at Open Grid Systems Ltd. and is undertaking an Industrial Ph.D at Brunel University in London. Her research work is focused on ‘big data’ challenges for the smart grid including data integration, visualization and analysis. Alan McMorran (M ’02) received the B.Eng. in Computer & Electronic System and a Ph.D. in Electronic & Electrical Engineering from the University of Strathclyde in 2002 and 2006 respectively. His research and development work has focused on model-driven architectures for data management, visualization and transformation and related technologies. Alan is currently a Director at Open Grid Systems Ltd. and the UK Principal Expert on three IEC working groups (13,14 & 19) under Technical Committee 57 and since 2006 he has participated in the development of international standards for information modeling, data exchange and systems integration for both distribution and transmission systems. His work has included collaborative research projects with EDF R&D, National Grid UK, Scottish Power and Areva T&D. Reza Arghandeh (M ‘09) is a postdoctoral scholar in the University of California-Berkeley, at the California Institute for Energy and Environment (CIEE). He holds PhD in Electrical Engineering, Power System from Virginia Tech, 2013. He also holds master’s degrees in Industrial and System Engineering from the Virginia Tech, 2013 and in Mechanical Engineering from the University of Manchester in England, 2008. His current research interests are focused on smart grid data analytics, DER adoption, and power system monitoring and measurements Alexandra von Meier (M '12) is co-director of electric grid research at the California Institute for Energy and Environment (CIEE) and adjunct associate professor in the department of electrical engineering and computer science at UC Berkeley. She holds a BA in physics and a PhD in energy and resources from UC Berkeley. Her current research interests center on supporting the effective and economical integration of intermittent and distributed renewable resources into the electric grid


![Imitation happens [micro economics] - IEEE Xplore](https://m.moam.info/img/260x300/imitation-happens-micro-economics-ieee-xplore_5c9e9e03097c47df708b45fd.jpg)
