engineering (a degree between a technician and an engineer) requires didactic tools that ... This article shows preliminary results of a study in which a computer ...
American Journal of Engineering Education – Fall 2012
Volume 3, Number 2
Using Animation To Improve The Students' Academic Achievement On Bipolar Junction Transistor W. Zoabi, Technion - Israel Institute of Technology, Haifa, Israel and ORT Braude College, Israel N. Sabag, ORT Braude Academic College for Engineering, Israel A. Gero, Technion - Israel Institute of Technology, Haifa, Israel
ABSTRACT Teaching abstract subjects to students studying towards a degree in electronics practical engineering (a degree between a technician and an engineer) requires didactic tools that enable understanding of issues without using advanced mathematics and physics. One basic issue is the BJT (Bipolar Junction Transistor) that requires preliminary knowledge of semiconductor basics and modern physics, which is not addressed in the curriculum. Existing teaching methods reinforce students' tendency to use familiar formulas, without discussing the BJT internal structure and without comprehending the nature of the current. Therefore, it is not surprising that students do not understand the manner in which the current flows in a device that can be described as two back-to-back diodes. This article shows preliminary results of a study in which a computer animation was developed in order to depict the dynamic processes in BJT, and compares the academic achievements of students who learned BJT via animation to those who learned via static diagrams. 41 students were randomly divided into two groups, 21 students in the experimental group and 20 students in the control group. The experimental group received explanations including animation while the control group received traditional explanations using a blackboard but no animation. A comparison was made between the students' achievements in both groups via a pretest. After learning about BJT, a posttest and new comparison was conducted. The comparison referred to two categories: A. Total score on the test; B. Score on questions that require higher level of thinking. The pretest results showed no significant difference between the groups’ achievement. In contrast the results of the posttest were significant, showing a 12-point advantage in the average total score, and about a 14-point advantage in the average on higher level thinking questions in the experimental group as opposed to control group. Thus, while the results of the study are preliminary, it is encouraging and important to present the results. Keywords: Animation in Education; Models in Engineering Education
1
INTRODUCTION
O
ne of the basic and most problematic issues taught in the field of electronics is BJT (Bipolar Junction Transistor). Understanding its principle of operation is difficult for students who are currently required to study the subject by treating it as a circuit element using algebraic relationships between currents and voltages on the various terminals of the component. The students learn the subject matter without discussing the internal structure and without knowing what causes the currents. This form of learning reinforces the tendency to use existing formulas, and the students mistakenly think that this is an effective form of learning. However, it is not © 2012 The Clute Institute http://www.cluteinstitute.com/
83
American Journal of Engineering Education – Fall 2012
Volume 3, Number 2
surprising that it is difficult for them to understand the behavior of current in the transistor, which can be described as two diodes connected back to back. By rights, the current has to be zero and yet this is not the situation. To improve the comprehension of the BJT's principles of operation, a computerized animation model that describes the dynamic behavior of majority carriers in the transistor was developed for the three modes of operation: cut-off, forward active, and saturation. 2
THEORETICAL BACKGROUND
Using educational multimedia products is necessary, especially when dynamic processes are to be described, as well as to demonstrate complicated phenomena and explain their occurrence. In these cases, there is an advantage to using animation, primarily to promote experiences and perception (Zysman, 1997). Other researchers point out that learning with visual representations supports the development of understanding (Larkin & Simon, 1987, Parnafes, 2007, Scaife & Rogers, 1996). Animation supports the creation of mental representations of a learned phenomenon and allows for a better understanding of the studied issues and increased motivation for learning; especially when it comes to processes that are not visually observable or that present difficulties when displaying them in a classroom and educational laboratory setting (Fleming, Hart, & Savage, 2000). The cognitive theory of educational multimedia is one of the most comprehensive theories on the subject (Mayer & Moreno, 2003, Mayer & Chandler, 2001). The theory is an extension of the dual coding theory. Mayer and Moreno (2002) base their theory on three assumptions: A. B. C.
Information encoded in both channels (verbal and visual) will be remembered better than information coded in only one channel. Animations can help reduce the cognitive load. When the learner has both verbal and visual representations, there is greater likelihood of constructivism to take place.
Implementation of interactive animations in teaching semiconductor basics enhances the students' ability to understand the principles being taught and the internal processes within the semiconductor device, such as recombination and generation, and even reduces the acquisition time of knowledge or skills for students (Stuchlíková et al., 2005). According Karmalkar (1999), the term "charge carriers" (electrons and holes) is considered a non-trivial issue of teaching and learning. Therefore, there is a need for supportive didactic animation to help explain the fundamentals of charge carriers. Using sketches and figures to improve understanding is not sufficient since static images do not allow the students to visualize the internal processes occurring in semiconductors (Stuchlíková et al., 2005. According to Harms, Krahn and Kurz (1998), the use of animation to illustrate dynamic processes such as drift and diffusion is successful in higher education. 3
DEVELOPMENT OF ANIMATION ON BJT
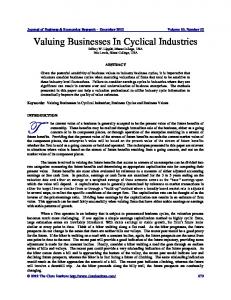
The decision to develop a new animation for teaching the BJT subject was taken after an extensive search of electronics libraries and databases and consultation with senior faculty staff who teach BJT in three well-known universities in Israel. We concluded that the existing animations are not suitable for students studying towards the degree of practical engineer in electronics (a degree higher than a technician and lower than an engineer, requiring two years of study beyond high school). For example, one of the existing animations describes the recombination of electron-hole like an explosion. Some students really believed that the explosion indeed occurs, so it is obvious that this description leads to a misconception. Therefore, it was decided to develop a new animation to help these students who lack the necessary background in mathematics and physics to understand the dynamic processes in BJT. For the purpose of building the animation, we used a PowerPoint presentation that describes the movement of electrons, which compose the majority current in the NPN bipolar transistor in its three modes of operation: cut off, forward active, and saturation. The animation, which is not an interactive one, was designed following Mayer and Moreno's (2002) principles. There is, however, an option to run the presentation step-by-step or stop it for a teacher explanation to avoid possible misconceptions that accompany such animations and to reduce the cognitive load. The explanations of the principles of operation rely on the book by Sedra and Smith entitled Microelectronics Circuits (2004). Figure 1 through figure 3 are examples of slides from the animation, including an explanation of what is shown the slides. The blue balls in the picture represent electrons while the black circles represent holes, and the "+" 84
http://www.cluteinstitute.com/ © 2012 The Clute Institute
American Journal of Engineering Education – Fall 2012
Volume 3, Number 2
indicates a positive ion. The animation demonstrates electrons injected from the emitter into the base moving by diffusion to the opposite end of the base and being swept from there into the collector. The animation was designed for the NPN transistor only.
Figure 1: One slide in the animation shows the electrons moving from the emitter region to the base region
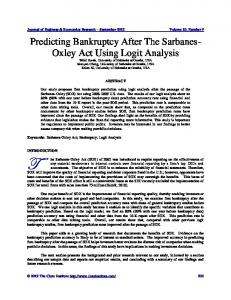
Figure 2: Most of the electrons are swept from the base region into the collector region
© 2012 The Clute Institute http://www.cluteinstitute.com/
85
American Journal of Engineering Education – Fall 2012
Volume 3, Number 2
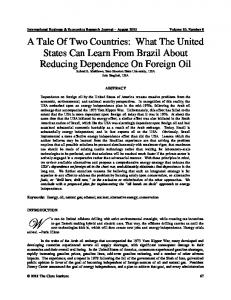
Figure 3: The general direction of the current componenets in the NPN transistor in the active region
4
OBJECTIVE
The research goal is to examine student achievement when studying bipolar junction transistor with animation compared to the achievements of students who studied using static drawings and summarizing notes from the board. 5
METHODOLOGY AND THE STUDY POPULATION
To meet the research goals a quantitative methodology was used that includes a real field experiment from the group of "True Experimental Design", and the kind of Pretest - Posttest - Control Group Design appearing in Campbell and Stanley (1963, pp. 8-13) as: R O1 X O2 R O1 O2 The study population included 41 students studying toward a degree in practical engineering in electronics at a leading college in Israel. Both the experimental and control groups were taught by the same teacher who was very precise in allocating exactly the same teaching time to both groups. Students were randomly (R) assigned to the experimental and control groups, completed a pretest (O1) on the diode principles of operation, which is a prerequisite subject to BJT in the curriculum, and were taught without animation. A comparison between the achievements of students in both groups was performed. In the second phase of the experiment, the experimental group included 21 students learning BJT with animation (X), and the control group included 20 students learning BJT with static drawings and summary explanations from the board but without the animation. At the end of the study, an identical posttest was conducted for both groups (O 2) on the BJT subject and a comparison between the achievements of students in both groups was performed. 6
TEST ACHIEVEMENT
The design of both the pretests and posttests relied on "test design tables" that specified the number of questions and their difficulty level for each subject studied. The questionnaires and the design tables were tested by two experts from the field of education (in electrical engineering and electronics) to ensure content validity. 86
http://www.cluteinstitute.com/ © 2012 The Clute Institute
American Journal of Engineering Education – Fall 2012 6.1
Volume 3, Number 2
Pretest (O1)
A pretest on the diode subject (O1) contained 8 questions, 3 of them classified as high thinking level questions; an internal reliability of the test questionnaire was calculated using the Spearman – Brown prophecy formula, the resulting coefficient was 0.87. Each of the questionnaires was assessed by two independent testers, using an agreed rubric for grading. The correlation between test scores given by the two graders (inter-judge reliability) was 0.97. All the answers were graded horizontally (starting with first answer of all the examinees then the second answer and so on until the end). The completed questionnaires of students from both groups had no names on them but only identification numbers and were graded in random order. 6.2
Posttest (O2)
A posttest on the BJT subject (O2) contained 9 questions, 4 of them classified as high thinking level questions; an internal reliability of the test questionnaire was calculated using the Spearman – Brown prophecy formula, the resulting coefficient was 0.78. Each of the questionnaires was assessed by two independent testers, using an agreed rubric for grading. The correlation between test scores given by the two graders (inter-judge reliability) was 0.99. All the answers were graded horizontally, the completed questionnaires of students from both groups had no names on them but only identification numbers and were graded in random order. 7
RESULTS
T-tests were conducted to check the statistical significance of the results, and P-values were calculated. A comparison of student achievement on both tests is presented in tables 1 and 2. Table 1 presents the students' overall scores on both tests and Table 2 refers to the questions that require high order thinking. All grades are based on 100. Group Experimental group Control group Grade gap P. value
Table 1: A comparison between the total group grades N Pretest Mean S. Dev. 21 67.95 23.54 20 65.80 20.30 2.15 0.37
Posttest Mean 78.24 66.15 12.09 P