Reuse of AIP content is subject to the terms at: http://scitation.aip.org/termsconditions. Downloaded to IP: 54.152.109.166 On: Tue, 05 Jan 2016 00:42:15 ...
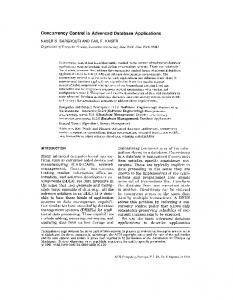
Advanced EELS Applications in Process Development Heiko Stegmann and Ehrenfried Zschech Citation: AIP Conference Proceedings 788, 549 (2005); doi: 10.1063/1.2063017 View online: http://dx.doi.org/10.1063/1.2063017 View Table of Contents: http://scitation.aip.org/content/aip/proceeding/aipcp/788?ver=pdfcov Published by the AIP Publishing Articles you may be interested in Effect of processing kinetics on the structure of ferromagnetic-ferroelectric-ferromagnetic interfaces J. Appl. Phys. 112, 104102 (2012); 10.1063/1.4765045 Methods for processing tantalum films of controlled microstructures and properties J. Vac. Sci. Technol. A 24, 1948 (2006); 10.1116/1.2335863 Atomic-scale studies of cobalt distribution in Co – Ti O 2 anatase thin films: Processing, microstructure, and the origin of ferromagnetism J. Appl. Phys. 99, 08M114 (2006); 10.1063/1.2170068 Application of SCM to process development of novel devices AIP Conf. Proc. 683, 672 (2003); 10.1063/1.1622544 Gate dielectric metrology using advanced TEM measurements AIP Conf. Proc. 550, 500 (2001); 10.1063/1.1354446
This article is copyrighted as indicated in the article. Reuse of AIP content is subject to the terms at: http://scitation.aip.org/termsconditions. Downloaded to IP: 54.152.109.166 On: Tue, 05 Jan 2016 00:42:15
Advanced EELS Applications in Process Development Heiko Stegmann 1, Ehrenfried Zschech AMD Saxony LLC & Co. KG, P. O. Box 110110, MS E23-MA, 01330 Dresden, Germany Abstract. Electron energy-loss spectroscopy (EELS) in the transmission and scanning transmission electron microscope ((S)TEM) has become an indispensable tool for structural characterization and analysis of microelectronic products at the highest spatial resolution available. However, the introduction of new processes and materials raises new challenges to high-resolution physical analytics in semiconductor industry. In this paper, typical applications of advanced EELS techniques to ULSI device-structure analysis are discussed. Keywords: EELS, ELNES, TEM, STEM, gate dielectrics, low-k, high-k, carbon depletion, process development PACS:
1
present address: Carl Zeiss NTS GmbH, Carl-Zeiss-Str. 56, 73447 Oberkochen, Germany
When scanning the region of interest point by point with a highly focused electron probe in a dedicated scanning transmission electron microscope (STEM) or in a TEM with scanning capability, the analytical spatial resolution is currently limited by the size of the focused electron probe directed to the sample. Advanced instrumentation standards, above all the field emission gun (FEG) and highly stable microscope electronics, have reduced the probe size to the sub-nanometer range. The achievable energy resolution in state-of-the-art instruments is no longer limited by the spectrometer performance, but by the energy width of the electron source. With standard Schottky field emission tip emitters, an energy resolution of 0.5–1 eV can be reached.
INTRODUCTION Analytical transmission electron microscopy (TEM) has become an essential support tool for IC manufacturing process development and failure analysis. However, the introduction of new processes and materials requires new microscopical analysis techniques for tighter control of process conditions in both frontend-of-line (FEoL) and backend-of-line (BEoL). Electron energy-loss spectroscopy (EELS) in the TEM offers such advanced options. It is possible to probe composition and electronic structure of a sample as a function of position with nanometer resolution, and as a function of its processing course.
With such instrumentation, enormous progress has been made in the physical characterization of interface structures and thin films. The most important application in semiconductor technology has so far been the characterization of conventional and alternative gate dielectrics. For example, STEMEELS has been used to study the electronic structure of the Si/SiO2 interface [2], for qualitative evaluation of N and O gradients in oxynitride gate dielectrics [3], and for compositional and electronic structure analysis of alternative gate dielectrics [3,5]. EELS combined with HAADF-STEM has been used for dopant profiling in Si [6].
In a TEM equipped with an electron energy spectrometer, either integrated into the microscope column or post-column, the electrons transmitted through the sample can be separated according to their kinetic energy. Energy-loss spectra collected using such spectrometers contain a variety of information on the sample [1]. Dielectric material properties can be derived from plasmon excitation peaks. Core ionization leads to characteristic spectral features that can be used for compositional analysis with detection limits of a few atomic percent. The energy-loss near-edge structure (ELNES) of the core ionization edges contains information on the local atomic environment and on chemical bonding of the probed atoms.
Using an electron energy spectrometer with imaging capabilities, energy selective images can be
CP 788, Characterization and Metrology for ULSI Technology 2005, edited by D. G. Seiler, A. C. Diebold, R. McDonald, C. R. Ayre, R. P. Khosla, S. Zollner, and E. M. Secula © 2005 American Institute of Physics 0-7354-0277-9/05/$22.50
549
This article is copyrighted as indicated in the article. Reuse of AIP content is subject to the terms at: http://scitation.aip.org/termsconditions. Downloaded to IP: 54.152.109.166 On: Tue, 05 Jan 2016 00:42:15
Spectroscopic Imaging (ESI), Fig. 1a) [11]. Examination of the distribution of several elements from a single series of energy filtered images is thus possible.
recorded by positioning an energy selecting slit aperture in the energy dispersive plane of the spectrometer (energy filtering TEM (EFTEM)). Acquiring such images at different energy-losses around core ionization edges allows qualitative and even quantitative [7] mapping of elements, chemical bonding [8,9], and sample thickness [10].
Fig. 1b-d shows an example for the application of this method to the compositional analysis of a contact structure after TiN barrier deposition. 100 energy selective images were recorded in 5 eV-steps (80-575 eV) at an energy slit width of 5 eV and 4 s exposure time per 512x512 pixel image (FEI CM200 TEM with Gatan Imaging Filter). The images were aligned to each other using a cross-correlation algorithm to compensate for specimen drift during the acquisition. In order to demonstrate the versatility of this approach for the identification of the constituting elements of IC structures, spectra were extracted from the regions marked in Fig. 1c. The characteristic core ionization edges of the elements present in the marked sample regions can be clearly distinguished. It is also possible to discriminate the different, characteristic near-edge structures of the Si-L2,3 edge in Si, SiOxNy, and SiO2 (Fig. 1d).
In the following paragraphs, applications are shown that demonstrate the potential of EELS to support the integration of advanced gate dielectrics and low-k intermetal dielectric materials .
ELECTRON SPECTROSCOPIC IMAGING OF DEVICE STRUCTURES If whole series of energy-selective images are recorded, spectra can be extracted off-line from these series from arbitrary specimen regions (Electron
FIGURE 1a. Principle of ESI.
FIGURE 1c. Reference image with regions FIGURE 1b. Image-EELS series of a cross-section of a contact after TiN barrier deposition. marked for spectrum extraction.
550
This article is copyrighted as indicated in the article. Reuse of AIP content is subject to the terms at: http://scitation.aip.org/termsconditions. Downloaded to IP: 54.152.109.166 On: Tue, 05 Jan 2016 00:42:15
FIGURE 1d. EEL spectra extracted from the regions marked in Fig. 1c.
range was 50-1073 eV at a dispersion of 1 eV/channel. Due to specimen drift, the measurement time per point was set to only 1 s.
QUANTITATIVE EELS OF ADVANCED GATE DIELECTRICS Since high-κ metal oxide dielectrics are not yet ready to be integrated into the CMOS process [12], silicon oxynitrides (Si-O-N) are presently used as intermediate replacements for SiO2 [13]. Depending on the process parameters, nitrogen can be concentrated near the substrate/SiO2 interface, near the poly-Si/SiO 2 interface, or uniformly distributed throughout the film [14]. The N distribution affects the electrical properties of the gate dielectric layer significantly. Therefore, analytical techniques are required that can measure N in the 5 - 15 at% range at sub-nm resolution.
FIGURE 2. HAADF-STEM image of a MOSFET Si-O-N gate dielectric. Vertical line: EELS line scan position.
These target values can be achieved by fitting a set of reference spectra to EELS line scan data recorded in STEM mode. An experimental spectrum can be modeled in good approximation as a linear superposition of single and multiple scattering contributions [15,16]. They comprise core ionization events for the chemical elements present in the probed sample volume, and plasmon excitations. The weighting of each contribution can be determined by least-squares fitting of reference spectra that represent the individual scattering contributions to the measured spectrum. The atomic ratio of two constituent elements is then given by the ratio of the respective single scattering fit coefficients times a calibration factor obtained from samples with known composition.
Reference spectra for Si-L2,3, N-K and O-K single scattering as well as for single plasmon scattering were obtained by deconvolution of spectra recorded from extremely thin samples of Si, SiO 2 and Si3N4. Multiple scattering spectra were calculated by 1-, 2- and 3-fold convolution of these spectra with the respective deconvoluted low-loss [18]. The reference spectra were least-squares fitted to the line scan spectra. Figure 3 shows one spectrum from the center of a SiO-N layer, one from the adjacent Si substrate, and the respective fits. The fit coefficient ratios obtained were converted to atomic ratios using calibration factors obtained from Si, SiO 2, and Si3N4 samples, and atom percentages were calculated from the ratios. Quantitative atomic concentration profiles of N, O, and Si across the gate dielectric were thus obtained (Fig. 4). For each sample, the profiles resulting from 10 line scans were averaged. Fitting of multiple line scans, alignment and averaging of the profiles was automated. The profiles show the expected difference in the nitrogen concentration. A slight shift of the N relative to the O distribution towards the poly-Si is apparent.
For the example shown here [17], cross-sections were prepared from two test wafers with Si-O-N transistor gate dielectric deposited by plasmaenhanced CVD using different process conditions. An FEI Tecnai™ F30 FEG-TEM, operated in STEM mode at 300 kV, with a Gatan Imaging Filter was used for the measurements. EELS line scans across the layer stack were acquired by recording spectra from 40 points in 0.15 nm steps along a line perpendicular to the dielectric layer at an electron probe FWHM of about 0.35 nm (Fig. 2). The recorded energy-loss
551
This article is copyrighted as indicated in the article. Reuse of AIP content is subject to the terms at: http://scitation.aip.org/termsconditions. Downloaded to IP: 54.152.109.166 On: Tue, 05 Jan 2016 00:42:15
FIGURE 5. Element concentration profiles from EELS line scans across a TiN/poly Si-capped Hf-O-Si gate electrode stack.
QUANTITATIVE EELS OF LOW-K INTERMETAL DIELECTRICS FIGURE 3. EEL spectra of a silicon oxynitride and respective least-squares fits: Overview and detail (inset) with N-K and OK energy-loss edges.
FIGURE 4. Atomic percentage profiles across two different Si-O-N gate dielectrics. Error bars: 1 σ from the profile averaging.
The use of low dielectric constant materials in Cu/low-k BEoL structures reduces interconnect delay, power dissipation and crosstalk noise [19]. Chemical vapor deposited (CVD) hydrogenated silicon oxycarbides (SiCOH) provide such low-κ materials and are used as intermetal dielectric (IMD) for high volume microprocessor manufacturing [20]. In these materials, substitution of oxygen in SiO2 by methyl groups (-CH3) reduces the permittivity significantly (κ = 4.0 → 2.6-3.3), since the electronic polarizability is lower for Si-C bonds than for Si-O bonds. However, plasma processing for resist stripping, trench etching and post-etch cleaning removes molecular groups that contain C and H from the near-surface layer of SiCOH. This 10-20 nm wide carbon depletion zone leads to increased water absorption and dimensional changes. Therefore, compositional analysis of structured IMD films with nanometer resolution is necessary for process optimization. Carbon depletion in SiCOH can be investigated quantitatively based on EELS line scans in the same way as described above for silicon oxynitride gate dielectrics. For the example shown here, Cu/SiCOH test structures manufactured using several modifications of trench etch and clean procedures were cross-sectioned. EELS line scans were acquired by recording spectra in STEM mode in 1 nm steps across the SiCOH between two inlaid Cu interconnect
Figure 5 shows the application of the same method to the compositional analysis of a metal silicate high-k dielectric. The concentration profiles were obtained from a TiN/poly Si-capped Hf-O-Si gate electrode stack.
552
This article is copyrighted as indicated in the article. Reuse of AIP content is subject to the terms at: http://scitation.aip.org/termsconditions. Downloaded to IP: 54.152.109.166 On: Tue, 05 Jan 2016 00:42:15
lines (Fig. 6) using the same instrumentation as described above.
Carbon depletion zones with a width up to 20 nm can be observed. Depending on the applied SiCOH process, the C:Si ratio drops to 1:3-1:10 in the carbon depletion zone. The O:Si ratio increases to 1.75-2.0, suggesting conversion to a SiO2-like material, which results in an increased effective dielectric constant κeff of the insulating material.
ELNES OF LOW-K INTERMETAL DIELECTRICS As chemical bonding in low-k dielectrics can be affected by processing, it is of interest to examine the ELNES of the C-K edge in the carbon depletion zone for evidence of modified bonding.
FIGURE 6. HAADF-STEM image of a cross-section with two Cu interconnect lines embedded in SiCOH. Horizontal line: position of EELS line scans.
FIGURE 7. Atomic ratios from EELS line scans as indicated in Fig. 6, plotted versus the spatial coordinate (three different samples). FIGURE 8. C-K near-edge EEL structure of C depleted vs. undamaged SiCOH.
Figure 7 shows atomic ratio profiles of C, O, and Si obtained from three representative samples. In the undamaged SiCOH material in the middle between two Cu interconnect lines, atomic ratios of C:Si ≈ 3:4 and O:Si ≈ 3:2 are observed, indicating an approximate Si4C3O6Hx stoichiometry.
In the example shown here, C-K edge spectra were recorded from undamaged SiCOH and from the depletion zone. In order to demonstrate the dependence of the visibility of near edge features on
553
This article is copyrighted as indicated in the article. Reuse of AIP content is subject to the terms at: http://scitation.aip.org/termsconditions. Downloaded to IP: 54.152.109.166 On: Tue, 05 Jan 2016 00:42:15
examined (FEI Tecnai™ F30 FEG-TEM with Gatan Imaging Filter). The energy resolution of these spectra is approx. 1 eV. Each phase shows a distinct fine structure that can be used for phase identification (Fig. 9).
the energy resolution of the microscope/spectrometer system, the measurements were done using an energyfiltering TEM equipped with a monochromated FEG (Zeiss LIBRA® 200 FE with in-column corrected 90° Omega filter, operated at 200 kV). Three different monochromator slit apertures with different widths were used to obtain energy resolutions of 0.15, 0.25, and 0.40 eV (FWHM of the zero loss peak). Circular specimen areas with a diameter of 20 nm were examined at an acquisition time of 60 s/spectrum. The spectra were power-law background subtracted.
DISCUSSION The low spatial resolution of surface analytical techniques commonly used in process development does not allow the examination of sample regions on a scale given by current gate lengths and interconnect sizes. Examining such structures requires the high spatial resolution of electron microscopy. As shown in the examples above, advanced (S)TEM-EELS techniques are able to deliver valuable information on structured dielectric layers in both FEoL and BEoL structures.
The C-K ELNES recorded from the depletion zone and from the undamaged SiCOH are significantly different (Fig. 8), indicating modified chemical bonding of the remaining C atoms in the depletion zone. At the highest energy resolution, a peak shows up in the ELNES of the depletion zone that corresponds to excitation of C 1s core electrons into the unoccupied π* orbital of the C=O bond [21,22].
A common energy-filtering TEM method for quick compositional mapping in process control and development support is the three-window method. Two energy selective images are recorded before the onset of a characteristic ionization edge to calculate and subtract the background under a third image recorded just above the edge onset. It is frequently used for physical failure analysis at specific sites, e.g., for identifying the nature of etch residuals or contaminating particles. However, especially for low element concentrations, the result depends on the quality of the extrapolation of the edge background. The user has little control over this process, which makes detection of low concentrations unreliable. Therefore, it is often preferable to look at an actual spectrum from a region of interest for the presence of certain features. ESI series allow off-line extraction of energy-loss spectra from arbitrary regions of interest within the image. The composition and spatial distribution of presumably abnormal features like, e.g., residual layers, can thus be investigated in detail. Acquisition times are much shorter (typically 30 min) than in the corresponding STEM-EELS technique (pixel-by-pixel recording of complete EEL spectra, typically many hours). However, comparatively high electron doses are needed, which may limit the usefulness of this method for radiation sensitive porous dielectrics. The achievable energy resolution is usually smaller than in STEM-EELS, depending on the energy selecting slit width and energy step width, and may often not be sufficient for ELNES studies. Improved imaging electron filters with high isochromaticity will extend the applicability of ESI techniques for ELNES analysis. Specimen drift between acquisition of the individual images can be corrected off-line by simple cross-correlation
ELNES OF NICKEL SILICIDES The formation properties of self-aligning metal silicides on narrow lines are different from those on unpatterned poly-Si films. They depend on process temperatures, dopant concentrations, and line width. This is especially crucial for the reaction of nickel with silicon. The introduction of nickel mono-silicide (NiSi) requires a thorough investigation of these effects and their relation to process parameters. ELNES can be used to identify different silicide phases (ELNES ‘fingerprinting’) at narrow lines. Here, the Si-L edge ELNES of NiSi, NiSi2, and Ni2Si was
FIGURE 9. ELNES of the Si-L edge for three different Ni silicide phases.
554
This article is copyrighted as indicated in the article. Reuse of AIP content is subject to the terms at: http://scitation.aip.org/termsconditions. Downloaded to IP: 54.152.109.166 On: Tue, 05 Jan 2016 00:42:15
concentration profiling at high sample throughput, specimen drift needs to be reduced to less than 0.1 nm/min in the future. If resolution requirements are less demanding, on-line drift correction during the data acquisition can be used. Cross-correlation of a reference image of the measured structure with control images recorded during collection of the spectra is used to predict the drift rate and to correct it. Enough strong contrast features are needed in the imaged structure to deliver good correlation, as is the case for intermetal dielectrics.
alignment, provided the specimen drift during the acquisition of each image is negligible compared to the analytical resolution aimed for. However, due to the unavoidable contrast reversals through an ESI series, such a simple alignment approach often fails. Improved alignment algorithms, e.g., using statistical data treatment [23], have been developed. Quantitative processing of EELS data requires considerable knowledge and experience of the operator. It involves many work steps like spectrum deconvolution, edge background modeling and removal, calculation of the edge net areas and their conversion to concentrations [1]. Quantitative processing by reference spectra fitting performs these tasks in a single step and can be automated. For overlapping edges, it can even be the only way for extracting useful quantitative information. For these reasons, reference spectra fitting is well suited for process development support with reasonable turnaround-times. Applied to EELS line scan data from oxynitride gate dielectrics, as shown above, deposition parameters and electrical transistor properties can be correlated with N and O depth distributions in the gate dielectric of processed transistors. This approach can also be used for spatially resolved analysis of other materials of potential interest in IC manufacturing, like silicon oxide-nitride-oxide multilayers (ONO stacks) for charge storage structures in non-volatile memory devices [13]. Their efficiency is strongly affected by the depth distribution of nitrogen atoms.
Another promising approach for compositional profiling and interface ELNES investigations at gate dielectrics should be mentioned here. Electron energyloss spectroscopic profiling (ELSP) [25] uses slit illumination of the sample and dispersion of the image intensity as a function of energy in an imaging energy filter. Its application to high resolution thin film stack analysis has been demonstrated [26,27]. Researching carbon depletion zone formation in patterned low-κ dielectrics is essential for optimization of etch and clean processes. The width of the C depletion zone can be measured by simple C profiling using basic EELS data processing, i.e., edge background subtraction and edge net area calculation. Quantitative EELS analysis based on reference spectra fitting provides additional information on the actual compositional changes induced by the processing of the dielectric. It also avoids inconsistencies due to sample thickness effects and, therefore, it ensures the comparability of measurements performed at different samples.
The usefulness of this method to study O concentration and Si or N interdiffusion in high-κ metal oxide dielectrics needs careful investigation. In the Hf-O-Si example shown above, the dip in the O concentration peak could be interpreted as an O depletion in the high-k oxide, but is most probably an artifact due to the strong elastic scattering in the Hfrich layer. Generally, EELS quantification is problematic in the presence of strongly scattering components [24]. Correction factors may have to be applied [1].
In the example shown above, the increase of the 1s/π*(C=O) peak in the C-K ELNES recorded from the C depletion zone points to increased bonding of the remaining C atoms to O atoms in the damaged SiCOH. The high electronic polarizability of C=O bonds (1.020 Å3) compared to C-C (0.531 Å3) and C-H bonds (0.652 Å3) increases κeff. Studying these effects by ELNES can contribute to a better understanding of process induced low-κ dielectric modification and damage mechanisms.
Like in ESI, an issue that has to be addressed for high-precision STEM-EELS studies is specimen drift during data acquisition. Drift sets an upper limit to the collection time per measurement point, and consequently to the achievable signal-to-noise ratio (SNR). Sample drift in state-of-the-art side-entry TEMs in usual lab environment is 0.5-1.0 nm/min. To achieve a spatial measurement resolution that corresponds to the depth resolution of surface analytical techniques (