Advanced Techniques for RTL Debugging. Yu-Chin ... We also demonstrate how the advanced debug techniques ..... Figure 6: Illustration of "what-if" Analysis.
Advanced Techniques for RTL Debugging Yu-Chin Hsu
Bassam Tabbara
Yirng-An Chen
Furshing Tsai
Novas Software Inc., 2025 Gateway Place, #480, San Jose, CA 95110 {ychsu, bassam, yachen, fstsai}@novas.com www.novas.com
ABSTRACT Conventional register transfer level (RTL) debugging is based on overlaying simulation results on structural connectivity information of the Hardware Description Language (HDL) source. This process is helpful in locating errors but does little to help designers reason about the how and why. Designers usually have to build a mental image of how data is propagated and used over the simulation run. As designs get more and more complex, there is a need to facilitate this reasoning process, and automate the debugging. In this paper, we present innovative debug techniques to address this shortage in adequate facilities for reasoning about behavior, and debugging errors. Our approach delivers significant technology advances in RTL debugging; it is the first comprehensive and methodical approach of its kind that extracts, analyzes, traces, explores, and queries a design’s multi-cycle temporal behavior. We show how our automatic tracing scheme can shorten debugging time by orders of magnitude for unfamiliar designs. We also demonstrate how the advanced debug techniques reduce the number of regression iterations.
•
Mixed: made up of portions described at different abstraction levels — behavioral as well as structural; and • Diverse: composed of multiple computation domains that model real world interaction such as sensors, transducers, digital-to-analog and/or analog-to-digital converters. The stimulus and response data used to exercise and observe design behavior is also a large and varied data set. Manipulating, studying, and analyzing this data and its correlation with expected or desired behavior, and the design’s implementation (i.e., actual) behavior is a horrendous undertaking. The process of debugging involves locating the logic that is associated with an error, isolating the pertinent cause and effect relationships, and understanding exactly how the design is supposed to behave and why it is not behaving that way as shown in Figure 1. Debug, with its demands for time and energy from expert designers, is quickly becoming the bottleneck in the verification process for today’s complex system-on-chip (SoC) designs.
Categories and Subject Descriptors M1.6: Testing, test generation, and debugging M1.5: Functional design verification T2.2: Transaction-level, TTL and gate-level modeling and validation, simulation, equivalence checking, functional formal (and semi-formal) verification
General Terms Algorithm, Design, Verification
Keywords Verification, Simulation, Debug, Reasoning, Visualization
1. INTRODUCTION Debugging is generally a major endeavor for the designer with large and complex designs since these are typically: • Heterogeneous: composed of varied components possibly intellectual property (IP) blocks from several (best-in-class) providers;
Figure 1: RTL Debugging Current day approaches rely entirely on the engineer’s ability to deduce the design’s behavior from its structure. No matter how well the structure is revealed, time is wasted making the wrong assumptions and following false paths. The more unfamiliar the design, the greater the difficulty and the more time required to reach adequate understanding. Engineers unfamiliar with portions of a design — owing to design reuse, purchased IP, or diverse/dispersed design teams — struggle to grasp how the design is supposed to work, or why it does not, which leads to long integration and debug cycles. As designs become more complex, debugging approaches must keep track and not lag behind. In this paper, we present new techniques for debugging temporal behavior from source code and simulation results. Our goal is to improve debug productivity by automating the process, and removing the mental burden of surmising (incorrectly) about the design’s behavior over time. With behavior analysis as the debug infrastructure, advanced debug approaches for behavior exploration are proposed for engineers to query a design’s temporal behavior.
The rest of this paper is divided as follows. Section 2 describes our behavior-based debugging approach: infrastructure, exploration, and query. The experimental results are presented in Section 3. Section 4 provides conclusions and discusses future work.
2. BEHAVIOR-BASED RTL DEBUG Behavior analysis automatically infers the design’s temporal behavior using the information in the HDL source and simulation result. Given an analysis scope, we extract the temporal behavior of the design from the design’s logical model and the simulation data. The analysis procedure is divided into logic extraction and timing activity analysis. Logic model: An inference step converts an HDL description into a logic behavioral model. This step builds an internal model for the actual circuit logic operation. The inference engine uses a “rules-based” approach to infer behavioral components from the HDL. The logic model is built in such a way that each statement is represented as a component block. No optimization is performed on the logic model so that one can easily trace back to the source code of the corresponding statement. The inputs of a statement block are classified into data-path and control inputs using a predefined set of rules for the specific matched component. The primary rules are as follows: • Latch Inference: A latch is inferred when a conditional statement is incompletely specified. The missing signal becomes the latch enable. • Register Inference: Happens when an “always” block is edge sensitive. A flip-flop (posedge or negedge) register is inferred in this case. • Incomplete Sensitivity List: To prevent possible simulation and synthesis mismatch, we interpret the missing signal to be an unintended latch output. A complete sensitivity list indicates nothing but a combinational circuit. • 2-D memory array: a memory is inferred. • MUX/priority-encoder Inference: In case of “if” statements, either latches or priority encoders are inferred depending on the context; for “case” statements, latches or muxes are inferred depending on context. • The non-inferable RTL such as algorithmic computation blocks (e.g., tasks) and interfaces to the environment (e.g., testbench) will be treated as a black box. Black boxes, therefore, surround any block whose internals cannot be directly analyzed and modeled. On the other hand, the block’s interaction with, and effect on, the rest of the system can still be modeled. Timing model and activity analysis: Once the logic model is built, the simulation result is used to extract the temporal behavior for an identified (problem) signal. The analysis starts with the problem signal. Its fan-in logic is traversed until flip-flops or inputs are hit. The active clock transition time of each flip-flop in the fan-in is determined using the logic model and simulation result. Using the active transition time, the values of all fan-in signals are fetched from the simulation result. The fan-in cone logic is evaluated to determine which signals are (in)active. With this analysis, we are able to determine when a signal is written during simulation, and where (i.e., in which statement). This activity analysis serves as the basis for enabling automation of debug in the time domain.
Behavior analysis provides new design abstractions, debug views, and techniques for multi-cycle tracing. This novel debug infrastructure is presented in the next section.
2.1 Behavior-Based Debug Infrastructure Starting from an error source, debug traces back towards the cause of this error by marrying the logical model and the timing activity models discussed in the previous section to build a behavior trace of the signal in question. This expansion can be performed interactively again and again moving backwards in time thus creating a temporal behavior representation that leads all the way back to the error source. In order to make the presentation more concrete, let us consider a simple illustrative micro-programmed CPU design example shown in Figure 2. Its primary registers
are shown in Figure 3. tb_CPUsystem (Testbench) CPUsystem CPU CCU
ALU
PCU
ALU CCU CPU PCU
= Arithmetic Logic Unit = Computer Control Unit = Central Processing Unit = Peripheral (I/O) Control Unit
PRAM (Contains microprogram code)
Figure 2: Block Level View of a Simple CPU Design
Module CCU
CPU
Register CWR MA ACC CF IDR IR IXR PC TR ZF
Full Name Control word register Microcode address Accumulator Carry flag Intermediate data register Instruction register Index register Program counter Temporary register Zero flag
Figure 3: Primary Registers in the CPU Design Let us assume we want to understand the cause of a suspicious value of 55 for signal ACC (accumulator) at time 800 as shown in Figure 4. We first traverse the fan-in cone of signal ACC backward until we hit the registers or input signals. Then, based on the clock signals of the registers and the simulation result, we can determine when each register was activated. For this example, fan-in register ACC is activated at time 700 by CK3 and IDR and CWR registers are activated at at time 725 by CK2. The next step is to determine which components are (in)active in the cycle. Based on the value from the simulation result and the function of each component, we can determine the signals that actively contribute to the fan-out register. In this example, IDR and CWR are in active fan-in while ACC and In1 are not. During behavior debug, designers are able to incrementally build and analyze every additional sequential logic stage, one at a time, determining which fan-in signals they want to continue to trace. This continues until they find the cycle that is causing the error output. The tracing may cross multiple clock cycles boundaries,
so the debugger must be able to handle this as well as present the tracing to the user in a prominent visual fashion. With the ability to reason about the debug temporal behavior, one is able to debug the cause of a specific value statement by statement through the effect-and-cause chain.
Figure 4: Tracing and Clocking Incremental behavior analysis enables automatic tracing in the time-domain. A trace value cause command is used to trace backward through a set of statements over time, traversing more than one stage in the time domain from a single invocation, stop at the first appearance of the value in any path and then display the trace results. For example, in Figure 5, we want to know from where the erroneous value 55 in ACC at time 800 comes. The system traces back through time and finds the first appearance of value 55 on signal d at time 700, which is generated by signals a, b and c. It should be obvious that the longer the paths of the causes are, the more debug speed up this tracing feature can provide for users.
2)
Behavior query: a dynamic query, reasoning and debug layer built on top of the exploration layer. This layer goes beyond the simple “where did this specific signal value come from” reasoning provided by the foundation layers. Users can write complex queries in the supported assertion languages to ask about the (in)validity of a (un)desired design scenario. The assertion language permits the user to make temporal queries that involve many design signals, design states, and can span many simulation cycles. This layer not only gives a valid/invalid response, but also assists the user in the design behavior reasoning and error diagnosis by adequately exercising the debug infrastructure. The sections that follow discuss these advanced debug layers in more detail.
2.2
Behavior Exploration Layer
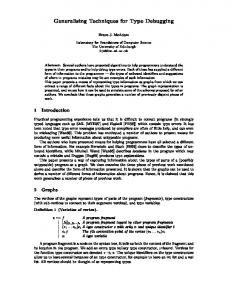
The behavior exploration layer enables users to explore possible behaviors of their designs in the debugging environment. Behavior exploration applies sophisticated formal methods to reduce tremendously the time required to comprehend how a design works or why it does not. The behavior exploration techniques come in two flavors: “what-if” analysis and “howcan” analysis. “What-if” analysis provides users the ability to quickly evaluate a potential bug fix by changing the current values associated with one or more signals in the design with new values. For example, in Figure 5, the correct value of signal d is 20. We can change its value to 20 and then perform “what- if” analysis to evaluate the effect to see whether the signal ACC has the correct value or not. Given a set of signals with set values, a target time or a collection of target signals, “what-if” analysis first performs fan-out marking on the logic model starting from the given signals until the fanouts are exhausted. Backward timing expansion then starts from the target signals or time to the starting signals. For example, in Figure 6, assume signal x is set from 1 to 0, the shaded region would be the expanded model if signal y is the target signal. If a “Target Time” were specified as in the Figure, then the left triangle would be the expanded model. Constant evaluation is then performed on this expanded model going forward, and the reevaluated results are shown.
Figure 5: Tracing a Suspicious Value Value tracing can also be specialized to search for the first unknown (X) that propagates to the output. The idea is to recursively apply the behavior analysis to the active fan-in’s that are also unknown until it stops at the cycle where all the fan-ins are not X. Another tracing application is determining when the content of a 2-D array element has been written and with what value. Through inference, one can extract the write conditions for a 2-D array. Then based on the write condition and the simulation dump file, determine the latest write of each memory element. We use this debug infrastructure to build advanced debug approaches for behavior exploration and query: 1) Behavior exploration: a dynamic exploration layer, built on top of the aforementioned debug infrastructure, that allows engineers to interact with the behavior abstraction by changing simulation values, and quickly determining the consequences of those changes in order to understand the effect of alternatives before committing changes to the source files and re-simulating.
x y
tim e range
Target Time
Figure 6: Illustration of "what-if" Analysis The performance of “what-if” analysis depends on the size of the expanded model, which depends on the time range between the earliest time of setting signals and the latest time of the target signals. The longer the time range, the larger the expanded model and consequently the larger the computation resources (time and memory) needed to perform the analysis. The challenge is then to complete the analysis within minutes, not hours, especially for large time ranges. This problem is alleviated in two ways:
a)
By making this feature user interactive; the practicality of viewing a trace and setting meaningful values at key points limits the time and space of the re-evaluations. b) We improve the runtime performance by optimizing the representation of the time-expanded model, and by speeding constant evaluation [1]. “How-can” analysis provides the inverse capability to “what if” evaluation; it gives users a way to find all possible combinations of a set of signals that achieve a specific value for a target signal at a specific time. Both “what-if” and “how-can” are used in a complementary fashion in debugging. For example, in Figure 53, after “what-if” helps us determine we need to set d signal to 20, this technique can find all possible combinations of a, b, and c to satisfy d=F(a,b,c)=20, i.e., it solves {(a,b,c)}= F-1(d=20). Given a set of signals with symbolic values and a target signal with a desired value, the time-expanded model is built. For example, in Figure 7, signal x is set to symbol and signal g is the target signal with a desired value. The time-expanded model is the shaded region. This analysis is performed using formal techniques such as Binary Decision Diagrams (BDDs) [2] and Automatic Test Pattern Generation (ATPG) [3]. In the BDD approach, the forward symbol propagation is first performed from the set signals to the target. Once the trimmed BDDs for the target signals are available, the remaining task is to extract the minterms in the BDDs, which satisfy the desired values of the target signal. In the ATPG approach, the symbol effect analysis is first performed forward, starting from the set signals to the target signal and trimming the representation when possible by constant reduction (e.g., 0 is controlling in case of AND). Then, a backward ATPG justification search is performed on signals with symbolic values to find the solution combinations. Set target value
Set symbol x
g
y tim e
range
Figure 7: Illustration of "how-can" Analysis The performance of “how-can” analysis not only depends on the size of the expanded model as in “what-if” analysis, it also depends on the numbers of set symbolic values: The smaller the number of symbolic values, the faster the response time. Again, the challenge here is to complete the analysis within minutes especially for a large time range and a large number of symbolic set values. As we mentioned earlier, practicality of debug interaction alleviates this somewhat. We also limit the maximum number of symbolic values to 70 symbolic bits.
as described later in this paper. The debug flow for this layer is as follows: 1) Enter the query using an assertion language. Assertion languages are becoming increasingly popular as a means to quickly and concisely describe a design specification. These languages are typically formal and declarative aimed at precise behavior descriptions of design specs that involve concurrency, sequencing and so on. Since the intent of debug is to validate the trace observation sequence of a specific design run, language subsets with finite and existential (i.e., linear) path semantics are used [7]. Such languages include OVA [4], Sugar PSL [5], Temporal E [6], and ForSpec [8], all with more expressive constructs than plain LTL. In our examples here, we use a language neutral pseudo-code to get the point across.
2) Validate the query on the simulation run data. For this step, we developed a design trace Verilog Change Dump (VC) or Novas’ mixed HDL Fast Signal Database (FSDB) checker tool that checks the (desired or undesired) behavior query against the simulation data. The results are overlaid on the simulation trace to flag the failures or successes. Depending on the debug level, results can consist of simple success/fail time tags or more detailed assertion evolution tags. The latter approach keeps the tags of the intermediate window evaluations in a sequence. For example, if we were checking a followed by b followed by c, then the tags for the start of the evaluation (i.e., a) and the intermediate window b can be kept as well. Here we assume that a full debug mode is enabled. 3) Debug the query starting from a failure instance. Here the debug infrastructure we introduced earlier is “driven” by the assertion result, and automatically invokes building of an assertion-driven design trace slice and dice to help automatically locate the suspicious error injection region. Trace slicing and dicing will be explained shortly. Subsequent value tracing and exploration can lead to successful error diagnosis and surmised fix, respectively Our unique approaches of trace slicing and dicing, starting from assertion and design knowledge, have been influenced strongly by program slicing of Weiser [9] introduced for software debug, and the, later introduced, dynamic slicing approaches. To explain, let us consider our simple assertion of a followed by b one cycle later, followed by c one cycle later.
2.3 Behavior Query Layer This debugging layer is aimed at assisting the user in asking about the presence or absence of desired or undesired design scenarios. The entry language for query specification can be any assertion language that the user is familiar with and has been using in assertion-based verification. In addition, the user can reason about an assertion failure using the trace slicing and dicing techniques
Figure 8: Illustration of Slicing and Dicing
An assertion fail instance at time 100, for example, means that the c expression was not satisfied. Debugging starts by adding c’s expression signal support (c in this case) as the starting error signal source. We then build a trace backward from this starting point and (set of) signal(s) to the trigger time of the assertion. This is shown in Figure 8. A trace slice is the backward trace from c to the trigger time of the assertion. If we had another support signal of the failing expression, we could generate another slice starting from that reference signal. The assertion and its dynamic validation data, however, give us more information for isolating the failure. We know that not all the drivers of signal c caused the failure because only a limited number of paths in the previous cycle are valid, namely those where b holds. This is a dice where additional info is used to limit the paths to be traced. Signal a provides for an additional dice in the earlier cycle again limiting the valid paths to trace for finding the cause of the failure. The cause can be from one (single fault) or more of the paths (multiple faults) involved, so the debug infrastructure discussed earlier is needed to find the real cause of the bug. Also, incorporating more assertions that share some of the expression support (some segments are subset of both) and their failure or success can help bias the path choice consideration; a path involved in a successful assertion is less likely to be the cause of a particular failure, and one involved in a failure more likely. Let us now consider the simplified CPU example and its ALU sub-unit to see how this approach works on a simple realistic case using the statement flow graph presented earlier. Assume that in Increment Accumulator mode the AluBuf output register should follow a sequence of 0,1,2,3,4,5 yet it mysteriously follows the sequence of 0,1,2,3,aa,4,5 as shown in Figure 9.
Figure 10: Trace Slicing of AluBuf Assertion Trace dicing can be performed using the property’s support or we can invoke a complete dynamic dice where only the active design paths for the specific simulation run in this time range are outlined as shown in Figure 11 below. After dicing, it becomes clear that the cause in this case is the mysterious ACC 55 value (propagated to AluBuf), which has been discussed in the earlier part of the paper to motivate the value tracing debug infrastructure. As shown in Figure 118, additional assertions can also eliminate suspect paths if we had more than one candidate. For example, in the case above, if the available information gave us two suspect paths as in the drivers of a and b respectively, an additional assertion that validates one of the two would help us localize the bug to the other path.
Figure 9: Bug in AluBuf Register If we had an assertion running with the simulation or a query added later for design behavior query and exploration, then a FAIL at time 826 would be flagged and a trace slice built for the AluBuf signal as shown in Figure 10. The assertion could take the form of: Always @ (posedge(CLOCK4)) { If (OpBusMode == INCA) then AluBuf = previous (AluBuf) +1; }
Figure 11: Trace Dicing of AluBuf Assertion
3. EXPERIMENTAL RESULTS Since our value tracing approach has the ability to automatically trace backward in time from the bug symptom to its suspected cause, its productivity improvement is proportional to the number of cycles in the bug cause-symptom trace. The cost of a cycle is that of source level statement by statement tracing for a designer using structure debug, and a single backward (active) fan-in
trace computation for the value trace debug. Indeed it should be clear that the human debugger’s analysis cost varies with experience and design knowledge. The structure debug process of a long trace is certainly much more error-prone (with numerous trial and error iterations), than the automatic fan-in trace unrolling. In order to give concrete data, we present here value tracing results for this paper’s CPU design example, Sun’s PicoJava design, and a customer gate-level Case_X design for unknown tracing. Results are based on a simple metric, number of cycles (i.e., debug steps) in the error trace, as a means to quantify
the debug speedup our new-layered debug approach provides. We also present the memory/time tradeoff of the additional analysis. Table 1: Compilation and Analysis Comparison Results
BugID
Design Size (RTL lines)
Structure (Memory/Time)
Behavior (Memory/Time)
CPU
1289
43M/1sec
53M/1.6sec
PicoJava
66496
78M/7.8sec
96M/16.9sec
Case_X
77520
124M/19.6sec
218M/83.6sec
In Table 1, compilation for structure analysis means HDL compilation and connectivity analysis. For the behavior analysis we additionally include behavioral inference and behavior representation building. For Case_X, the RTL line- count does not include the cell library. Table 2: Value Tracing Comparison Results
BugID
Structure Debug
Behavior Debug
Steps
Memory
Steps
Memory
Time
CPU
13
43M
1
53M
2s
PicoJava
14
78M
1
96M
20 s
Case_X
>1000
124M
1
236M
492 s
In Table 2, CPU is the case of tracing the cause of ACC 55 in our example. It takes one click to find the error cause, while it takes 12 steps in the structure statement-by-statement trace back along with manual cross referencing of waveform and source code. The last one is a case for tracing the cause of first unknown. The behavior analysis traces back 427 fan-in cones and stops at the statement that first generates X. If for each fan-in cone a user needs to trace an average of 3 statements, one will need to trace back more than 1,000 statements to find the cause of X. This is very error-prone and tedious. We also present in the table memory consumption of structure vs. behavior tracing as a means to capture the trade-off in space for the more time efficient behavior analysis. For the behavior exploration, it should be quite evident that exploring at this level provides for tremendous reduction in regression time (for both bug-fix assurance and alternative scenario evaluation) since: • Immediate local evaluation update is much quicker compared to changing the testbench to force the user set values, constrain the simulation scope, and re-simulate. The resimulation iteration time certainly dominates the measure. • Finding all the satisfying assignments for a target value is incomparable to any current day simulation-based debugging approach. For behavior query, it is also clear that productivity improvements in this targeted assertion query-driven approach for trace slicing
are actually orders of magnitude greater than a “blind” debugging approach where the user does not formalize what specification the implementation must comply with.
4. CONCLUSIONS AND FUTURE WORK We have put forth a new RTL debug methodology and infrastructure intended to significantly increase designer efficiency. With the behavior analysis and debug technique, IC designers and verification engineers can quickly locate and diagnose errors with behavior query, evaluate potential corrections with behavior exploration, and quickly trace back to the root causes with the highly automated infrastructure. The infrastructure continues to evolve as we investigate new design styles and various application domains. Behavior exploration uses formal methods to reduce the “re-simulate for every suspected fix” phenomenon. We continue to improve both BDD and ATPG engines and to develop methodologies that combine the advantages of both approaches. Behavior query empowers designers to quickly detect an error in the implementation. The query approach to debugging permits a high level of debug interaction — that of the specification itself — not wires and registers as in typical debug. Behavior query provides fertile ground for future research and development not only in automated error diagnosis, but also in the areas of functional coverage and reactive testbenches.
5. ACKNOWLEDGEMENTS The authors would like to recognize the following for their numerous contributions to this work: Scott Sandler, George Bakewell, Tayung Liu, Kunming Ho, Jack Changfan, Winston Hwang, Hermes Lin, Gary Lin, Wells Jong, and Ying-Tsai Chang. The authors also want to thank the reviewers for their comments.
6. REFERENCES [1] Bertacco, Valeria, Maurizio Damiani, Stefano Quer: “Cyclebased Symbolic Simulation of Gate-level Synchronous Circuits”, DAC 1999, p. 392-396.
[2] Bryant, Randal E. “Graphical-Based Algorithms for Boolean Function Manipulation”, IEEE Tranactions On Computers, 35(8):677-691, 1986.
[3] Ganai,
Malay; Aziz, Adnan; Kuehlmann Andreas, “Enhancing Simulation with BDDs and ATPG”, DAC 1999, p. 385-390.
[4] OpenVera Assertions, www.open-vera.com, 2002. [5] Sugar PSL, www.accellera.org, 2002 [6] Temporal E assertion constructs, Verisity Inc., 2002. [7] Vardi, Moshe “Branching Time vs. Linear Time: Final Showdown”, ETAPS, 2001.
[8] Vardi, Moshe “The ForSpec Temporal Language: A New Temporal Property-Specification Language”, TACAS, 2002.
[9] Weiser, Mark “Program Slicing”, IEEE Transcations on Software Engineering, 10:352-357, July 1984.


![([PDF]) Advanced Apple Debugging & Reverse ... - Google Sites](https://m.moam.info/img/260x300/pdf-advanced-apple-debugging-reverse-google-sites_6478acc3097c474b228d75b3.jpg)

![[Download] Advanced Apple Debugging & Reverse ... - Google Sites](https://m.moam.info/img/260x300/download-advanced-apple-debugging-reverse-google-s_64770aee097c474c228b83ba.jpg)
