acts as a summarizing block for its descendant blocks and is used when its descendants constitute an e-block; an e-block is the unit of incremental tracing during.
Techniques for Debugging with Flowback Analysis JONG-DEOK
Parallel Programs
CHOI
IBM Thomas J. Watson Research Center and BARTON P. MILLER and ROBERT H. B. NETZER University of Wisconsin — Madison
Flowback analysis is a powerful technique for debugging programs. It allows the programmer to examine dynamic dependence in a program’s execution history without having to reexecute the program. The goal is to present to the programmer a graphical view of the dynamic program flowback analysis while dependence. We are building a system, called PPD, that performs keeping the execution time overhead low. We also extend the semantics of flowback analysis to parallel programs. This paper describes details of the graphs and algorithms needed to implement efficient flowback analysis for parallel programs. Execution-time overhead is kept low by recording only a small amount of trace during a program’s execution. We use semantic analysis and a technique called incremental tracing to keep the time and space overhead low. As part of the semantic analysis, PPD uses a static program dependence graph structure that reduces the amount of work done at compile time and takes advantage of the dynamic information produced during execution time. Parallel programs have been accommodated in two ways. First, the flowback dependence can span process boundaries; that is, the most recent modification to a variable might be traced to a different process than that one that contains the current reference. The static dynamic program dependence graphs of the individual processes are tied together with synchronization and data dependence information to form complete graphs that represent the entire program. Second, our algorithms will detect potential data-race conditions in the access to shared variables. The programmer can be directed to the cause of the race condition. PPD is currently being implemented for the C programming language on a Sequent Symmetry shared-memory multiprocessor.
[Software Engineering}: Testing and Categories and Subject Descriptors: D.2.5 azd.$ monitors, tracing; D.3.3 [Programming Languages]: Lmwwe Debugging—debugging Constructs and Features—concurrent programming structures, control structures, procedures, functions, and subroutines; D.3.4 [Programming Languages]: Processors–code generation, compilers
General
Terms: Design,
Languages,
Measurement
This research was supported in part by National Science Foundation grants CCR-8703373 and CCR-8815928, Office of Naval Research Contract NOO014-89-J-1222, and a Digital Equipment Corporation External Research grant. Authors’ addresses: J.-D. Choi, IBM Thomas J. Research Center, Yorktown Heights, NY 10598; B. P. Miller and R. H. B. Netzer, Computer Sciences Department, University of WisconsinMadison, Madison, WI 53706. Permission to copy without fee all or part of this material is granted provided that the copies are not made or distributed for direct commercial advantage, the ACM copyright nbtice and the title of the publication and its date appear, and notice is given that copying is by permission of the Association for Computing Machinery. To copy otherwise, or to republish, requires a fee and/or specific permission. @ 1991 ACM 0164-0925/91/1000-0491 $01.50 ACM Transactions on Programming Languages and Systems, Vol 13, No 4, October 1991, Pages 491-530
492
.
J.-D, Choi et al
Additional Key Words and Phrases: Debugging, program, program dependence graph, semantic
flowback analysls
analysis,
incremental
tracing,
parallel
“In solving a problem of this sort, the grand thing is to be able to reason backward This is a very useful accomplishment, and a very easy one, but people do not practise it much In the everyday affairs of life it is more useful to reason forward, and so the other comes to be neglected. There are fifty who can reason synthetically for one who can reason analytically, “Let me see if I can make It clearer. Most people, if you describe a train of events to them, will tell you what the result would be, They can put those events together in their mmds, and argue from them that something will come to pass. There are few people, however, who, if told them a result, would be able to evolve from their own inner consciousness what the steps were which led up to that result. This power is what I mean when I talk of reasoning backward, or analytically. ” Sherlock Holmes in “A Study rn Scarlet” Arthur
Conan Doyle
1. INTRODUCTION Debugging program
is a major initially
programmers veloped
have
low. trace
way
by detailed
since
sequential
that
Whereas
programs
debugging
Program running
it is rare
intends. parallel
a
most
and have programs
dehas
Debugger ( PPD) [31] is a debugon shared-memory multiproces-
“multiprocessors”). PPD efficiently implements a techanalysis [7], which provides information on the data
flow between events while keeping both a method
is generated
programmer
strategies,
difficult. The Parallel for parallel programs
By using
a program,
the
debugging
debugging
sors (hereafter, called nique called flowback and control information
in developing the
experience
satisfactory
proved more ging system
step
behaves
during
information
in a program’s execution. PPD provides this the execution-time and debug-time overhead
called
incremental
execution obtained
and
tracing,
only
is supplemented
by reexecuting
only
a small during
selected
amount
of
debugging parts
of the
program. PPD is also capable of performing flowback analysis on parallel programs and detecting data races in the interactions between processes. This paper describes the mechanisms used by PPD to implement efficient flowback analysis for parallel programs. These mechanisms include program dependence graphs and semantic analysis techniques such as interprocedural analysis
[2, 12] and data-flow
analysis
The goal of PPD is to aid dependence. These dependence tations of erroneous program erroneous
program
state
(the
[22].
debugging by displaying dynamic program should guide the programmer from manifesbehavior (the failure) to the corresponding error)
to the
cause
of the
problem
(the
bug).
Debugging is a difficult job because the programmer has little guidance in locating bugs. To locate a bug that caused an error, the programmer must reason about the causal relationships between events in the program’s execution. There is usually an interval between when a bug first affects the program behavior and when the programmer notices an error caused by the
to locate the bug precisely. bug. This interval makes it difficult method for locating a bug is to execute the program repeatedly, ACM
Transactions
on Programming
Languages
and Systems,
Vol
13 No
4, October
The usual each time 1991.
Debugging Parallel Programs with Flowback Analysis
.
493
of the bug. An easier way to locate placing breakpoints closer to the location a bug is to track the events backward from the error to the point at which the bug
caused
the
programmer
error.
sees,
Flowback
either
analysis
forward
tracks
or
events
backward,
in such
how
a way.
information
through the program to produce events of interest. the programmer can more easily locate the bugs
Using flo whack that led to the
errors. Parallel
sequential
that
programming
complicate
offers
the problem
occurring execution
in parallel is crucial
therefore, ministic.
the cause of errors). Such nondeterminism
program
for
challenges
beyond
of debugging.
First,
debugging
Second, parallel often makes
purposes.
Third,
programs it difficult
interactions
analysis, observed
programming
it is difficult
programs. The ordering of the events for seeing causal relationships between
The
flowed
to order
events
during program the events (and,
are often nondeter to reexecut e the between
cooperating
processes in a multiprocessor system are frequent, and these accesses to shared variables can occur without the proper synchronization. PPD not only performs efficient flowback analysis for sequential programs, but also helps address
the problems
In this
paper
synchronization dezvous)
and
addressing
of debugging
we address primitives
explicit
to such machine
parallel class
(such
(and
automatic
the
parallelism,
generalize
to other
programs
semaphores, process
many
creation.
imperative
languages.
might
Ada
ren-
we are
not
be extended
that the underlying memory system [28]
techniques language We
in this paper [23], but they
address
of the C language,
including
primitives
for synchronization.
a simple approach investigation.
to pointer
variables,
but
this
use explicit or
Although
assume consistent
Symmetry). The C programming
that
monitors,
of our techniques
systems. Our current algorithms architecture has a sequentially
(as is the case on the Sequent are described in terms of the should
as
dynamic)
programs.
of parallel
is a topic
a large
part
We also discuss that
needs further
This paper is organized as follows: Section 2 presents an overview of the design of PPD. Sections 3 and 4 describe the graph structures and tools used by PPD to perform flowback analysis. Section 3 describes the static program dependence between
graph,
events
built
at compile
in the program’s
program dependence dependence between
graph, events
time,
which
execution.
shows
Section
potential
4 describes
dependence the
dynamic
built at debug time, which shows the actual in the execution. Section 4 also describes how
dynamic graphs are built by augmenting the static graphs with traces generated during execution and debugging. Section 5 presents the details of incremental tracing. Section 6 describes how flowback analysis is extended to parallel programs and how data races are detected. Section 7 presents some initial performance overhead results. We conclude with Section 8.
2. STRUCTURAL Flowback during
AND FUNCTIONAL
analysis the
and space.
execution
would
OVERVIEW
be straightforward
of a program.
However,
if we were doing
to trace
every
so is expensive
event in time
The user needs traces for only those events that may lead to the ACM l’ransactlom on Programming Languages and Systems,Vol 13 No. 4, Octobl~r1991.
494
J.-D. Choi et al.
.
detected will
error.
The
be detected
generate
a trace
important
that
Tracing
every
most
often
the
with
analysis. ral
we
time.
that
needs
amortize
be
transfers time
divide
in
the
the
execution phase.
detected. and
distortions
between
is
that
processes. as is often
other
during
as the
of the
reduce
the
programmer
time
-
of information debug
time
interactive
asks
and
as int,erprocedu
At
the
do flowback
compile
amount
execution. over
to
such
log,
debug-
informa-
needed into
idea
the
compiler-generated costs
traces
main
called
portion
analyses,
program fine
The
traces,
traces
semantic
the
difficulties.
interactive
to help
generated into
debugging
phase, When
it
the
three
program
we
debugging
about
dependence
the
along
with
the
emulation
ging
phase
major
the
PPD
produces
halts,
due The
object
be
used
to either
PPD
an
code code
in
programmer’s
debugging the
and is
the
the
preparafiles
running
following
error
Controller
our
During
object
phase,
execution
in
Controller.
the to
phase,
components
the
While a log
begins.
preparatory the
the
debugging
or user
oversees
to be in
intervention, the
debugging
requests.
fill
during
phase,
object
package to
generated
during
code, the
that
will
generate
between
the
the
gap
the
execution
which
the
Compiler/Linker
following:
phase
fine
traces
information and
the
during
the
contained
in
information
debugthe
needed
log
to
do
analysis;
the
static
and
control
the
program
such
preparatory
two
Phase
1 shows
flowback
and
generates
to the
Preparatory
produces,
phases:
are
phase.
phase
responding
Figure
(3)
the and
use
Compiler/Linker
debugging
phase,
(2)
is
reproducibility,
above
fine-grained
analysis,
debugging
phase,
used
(1)
a modified
error
of the
to
anything
overhead
pattern
execution-time
we
generated
are
the
traces the
debugging phase. There Compiler /Linker system: the
2.1
lack
has
program.
we
the
an
coarse-grained
during
coarse
and
tory
not
errors
user
to reexecute
because lack
what
the
unacceptable
that
generate
of generating
traces
has
interaction
to reduce
to
data-flow
cost
The
the
the
compile
to
the
session. in
use
and
the
know
will
after
of
programs
Then,
method
At
analysis
is
incrementally
This
debug
tracing
execution.
produce
user
because in
to either
traces
traces
programs
way
programs.
tracing
session, to
or the
parallel for
a no program;
the
necessary
introduce
parallel
so that
expensive for
incremental
program
ging
the
is
of the
is detected,
is
would
incremental
tion
error
impractical
use
during
event
is impractical
case
of
an
there
execution
every
event
debugger
we
is that
the
generates
Reexecution the
of
when
program
problem
before
program
as the
2.2
Execution
The
object
the
execution
code
ACM TransactIons
dependence
dependence
database places
graph
among that
where
that
shows
components
contains
a variable
the
of the
information is defined
static
(possible)
program;
and
on
the
program
data
text,
or used.
Phase plays phase,
the
major
during
on Programming
role which
in the
the
execution object
phase.
code
Languages and Systems, Vol
generates
Figure the
13 No 4, October 1991
2 shows normal
Debugging Parallel Programs with Flowback Analysis
,----
.
495
- —- —- —________ 1
~
;
I
~_–.
‘
&tJLATION
..................
J–l
I , I
PACKAGEI
I
;;;&–m-D;
i
-
-–/
–.–-–
1
-- —_—-—-_
FxLEs ! .................. I I ----------- : provided by user ‘----
:generated
l___________ I L_________________l
bycompiler Fig. 1.
Preparatory
phase.
~~ +3 ,.—. .
/’
..................
..................+’ \ \
‘\
‘~
0::;
J
\
OUTPOT’
/’
----”
----------” : provided by user ‘-–- : generated by compiler : generated by object code Fig. 2.
program
output
and
execution.
The
debugging
phase
entries
in the are
is
to
before
the
program
described
in
The
goal
of the
from
ated
by
the the
code
with
the
emulation
ging
emulation 3. The
STATIC static
package
program
the
to
static
Transactions
program
log
the
The
variables
and
This
the
graph,
fine
to
that
record
the
entries
and
build
log
might changes tracing
a graph
and
the
informa-
database log
information
~gener -
generated
is used
traces
Controller
of the
assembles
program
detailed
PPD from
static
is
phase
phase,
The
DEPENDENCE dependence
3)
graph
phase.
the
analysis.
which The
debugging
preparation
requests and
point.
Figure
The
to generate
log
of the
program during
5.
(see
the
to generate
between ACM
Section
execution
PROGRAM
dependence
postlogs,
logging
about
package,
flowback
and
the
responds
the
point,
dependence.
from
for
values
the
package
information
emulation
the
phase
phases:
during
It data
traces
last
in
the
record
during
dynamic
phase.
necessary
the
detail
previous
object
of the
logging
phase.
dynamic
with
in a program.
compiler
the graph
which
debugging
dependence
tion
fine
more
Debugging Phase
dynamic
generate
since
2.3
contains
along
next
state
that
used,
prelogs,
include
be read
a log
log
Execution
needed
to bluild
oversees
the
programmer,
and
then
by
together
the
a
debug-
locating
executing
parts
the of the
traces.
GRAPH graph
(static
components,
on Programming
Languages
graph) such
as
shows
data
and Systems,
Vol.
the
potential
dependence.s
[241
13 No. 4, October
1991.
496
.
J.-D. Choi et al.
,–––. –...................... :: ,.......––.–. :: ;: !: :
~--:
~~
~
:
. . . . . . . . . .. . .. . . . . . . . . . . . . .. . .. . . . . . . . . . . .
. . . . . . . . . . . . . . . . . ...1 ; SOURCEFILES ; .................... :: ,.. . PROGRAM ! DATASASE [ r --------------J-- -----,
DYNAMIC PROGRAM DEPENDENCE GRAPH
:
“--; SXATICPRCCRAM ~[ ;: DEPENDENCE ; :
......................... :
I
. . . . . . . . . . . . . . . . . . . . . .. . . . . . . . . . . .
—+ : control flow —
USER
: information
o:
flow
system provided
: generated during debugging phase
.......... .......... : generated during previous phases Fig. 3.
and
deperzclence.s
branch
graph
is
graph
(dynamic
The
by
that
the
can
graph
Kuck
the
(similar
to
control
block
a variation [251.
~ : compiler generated
[151).
dependence
of the
two
the
then,
dy~amic
The
program
static
dependence
there
any
been
as an
361.
The
to their
potential
intro-
variations
applications.
First,
program
and main
graph
numerous
intermediate
vectorizing,
24–26,
exists
dependence
have
according
is used
of optimizing, [15,
program
there
classes,
graph
program
whether
of
Since
into
purpose
of the
decide
is
et al.
dependence
for
mations
. .
Debugging phase.
building
be categorized
program
tation
basic
.>
graph).
static
duced
the
also
(
represen-
parallelizing
concern
dependence
in
transfor-
this
between
class two
is to
sets
of
statements. Second,
the
program.
program
A slice
is the
set of all the
slices
can
be
debugging
used
[15,
applications
34,
is that
program
execution.
dynamic
information
the slice
dynamic
graph.
of the
program
between
dependence
of a program
statements for
graph
with
respect
that
might
integrating
37, they
381.
However,
in
obtained The at
common
use
PPD,
execution
the
value of
augment
point
of
[211
program u
the
the and
PPD
can
based
on
program
graph
be viewed actual
in
on Programmmg
Languages and Systems,
Vol
13 No
4, October
of
during with
the
building
as a dynamic dependence
statements.
ACM Transactions
a
p
classes
obtained
debugging the
for
two
static
from point
at p [38]. Such
and
information
execution in
slices
extract v and
attribute
we
graph
to
variants
dynamic
during
dynamic an
the
used
affect
program
One
do not
is
to variable
1991
Debugging Parallel Programs with Flowback Analysis Accordingly,
the
previous
systems.
following
observations:
mation
to
build
generated time
at
tion
structure
the
vectors
execution
time.
at run
mate
direction
such
precise identify
Moreover,
time
information
subroutine.
this
ence,
we can
the
at compile
time.
dynamic
We,
trace
direction of depend-
Although automatic this
co input loop
-
]paral
information
at
actual paths of controd flow trace), we need not approxi-
therefore,
do not
construct
a
Finally, for each subroutine, we want to might be used or defined by the execution allows
a static
us to decide when
graph
branch dependence layer, called the data
whether
showing
consisting
the
to sh~ow or depend~ences
of two
graph, shows the dependence graph,
the
and the inner
the
of a subroutine
we describe
called
the
to
informa-
dependence
reconstruct
dynamic
trace
execution-
characterizations for
the
inforof
low
dynamic
dependence. essential
from by
be compromised
Since
data
ways
amount
not
497
enough
means with
times.
we require
from
small
should
computing
is
Such identification
section
layer,
a
of trace
compile-time
static control flow graph. the sets of variables that
of that
In
loops,
because
to skip the execution details requested by the user. outer
debugging
because
contain
determined
vectors
(obtained
should only
execution-time
[3], it is unnecessary
execution
taken
motivated
efficiency
all
to show
several
is
amount
easily
are approximate
dependence
lelization
and
in
graph
with
small be
unrolls
is unnecessary
data
can
differs
static graph
graph A
in PPD the
static
compile-time
effectively
[39], which
ence,
the
time. that
at
of
dynamic
Second,
obtained
structure
First,
dependence
information
ing
graph
The
execution
overhead.
identify
static
.
layers.
branch shows
The
dependthe data
dependence within the blocks of the branch dependence graph. We discuss the two layers in detail. Interprocedural analysis is used in building the data dependence graph. With separate compilation, interprocedural analysis also allows us to avoid rebuilding more modules of the program described dural
in detail
analysis
the entire static graph from are modified. The separate
in Section
in building
3.5, where
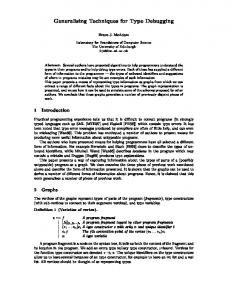
the static
3.1
Branch Dependence
Graph
The
outer
static
(static) syntactic this
layer
branch
graph
of the
dependence
program with
analysis the control
dence graph consists edges between these graph. Such a graph
how we use interproce-
graphs.
graph
graph,
we describe
scratch when one or compilation issue is
is the
which
(i. e., at parse dependence
branch
dependence
is always time).
graph
a tree,
graph.
This
is developed
from
In Section
[15].
The
of nodes called control blocks and nodes. Figure 4 shows an example is constructed for each subroutine
4.3 we compare
static
branch
branch branch in the
d~epen -
dependence dependence program. A
control block is identical to a basic block, except that labels (which are potential targets of branching statements such as goto) always delimit the start of a new control block. For example, to handle switch statements in C, we also treat
a case
statement
as a label,
since
an implicit
branch
occurs
when a case does not end with a break and is allowed to fall through to the following case. A leaf control block represents a block of statements in which the flow of control always enters at the beginning and exits at the end, and ACM
Transactions
on Programming
Languages
and Systems,
Vol.
13 No, 4, October
1991.
498
J.-D. Choi et al.
.
extern
int
gl,
extern
int
A[1OO],
wolf
(
int
)
i,
SI :
if
k,
(gl
} else F
a,
0
wolf
b:
{
/\
Add2(gl,
g2); 7
/’
C
\
\
,
= o;
SubY ( ) ;
S5:
[
a = gl; D
L1 :
r
s6: * S7:
/.
{
gl
S3:
1,
> O)
a -
r
S4:
g3; B[1O()];
(
j,
S2: I
c32,
G
s8:
a =
(A[i]
b=
= b);
A[j];
A[k]
-B[l]+a+b;
L2 :
S9:
a = gl;
Slo: Sll:
H
S12:
g2
= a;
gl
-
g2;
SubX(a)
S13:
g2
[
;
= g2
+ g3;
}:
S14:
while
I
I
S15: s16:
(a > 1) a=a-
( 1;
IMOD
USE
MOD
E
g2 = g2 * a;
B
IUSE
POINTERTODATA DEPENDENCEGRAPH
1;
Fig.4
Sample static graph,
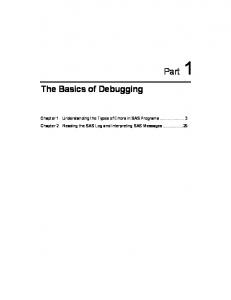
that is devoid of conditional or loop control statements. For programs without labels that are potential targets of branching statements such as goto, the branch
dependence
program, with the branch dependence
graph
is identical
to the
abstract
syntax
tree
[1] of the
basic blocks being the leaf nodes of the tree. Thus, the graphs can be built at compile time without control-flow
analysis. Since we do not perform control-flow analysis of the program, we simply assume at compile time that every label will be a target of at least one. branching statement. This assumption sometimes results in overly finegrained basic blocks, such as blocks F, G, and H in Figure 4, However, the benefit from not performing control-flow analysis easily offsets the small, additional overhead incurred by such pessimistic assumptions. Branching statements, such as goto, can affect the structure of dynamic graphs. In Section 4.3 we describe how the simple structure of the branch dependence graphs, combined with run-time traces, can handle these branching statements. ACM
Transactions
on Programming
Languages
and Systems,
Vol
13 No. 4, October
1991.
Debugging Parallel Programs with Flowback Analysis There
are four
represents
nonleaf
conditional
absence
of gotos
switch
statement
conditional this type.
block
(including falls
node During
types
statements,
needed
such
implicit
through
gotos,
to the
for
as if
C programs.
or switch
which
following
in the static graph will execution, either block
.
The
499
first
type
statements.
occur
when
case),
only
1n the
one case
of a
one child
of a
execute. Block A in Figure 4 is of C or block D will be executecl. The
second nonleaf block type represents loop control statements such as while or for. Execution of the descendant blocks may be repeated zero or more times depending on the loop control statement. Block B in Figure 4 is of this second type. The third and fourth nonleaf block types ment. The third type acts as a summarizing and is used when of incremental descendants root
during
constitute
debugging
of a summarizing
block
construct
its descendants
tracing of a static
an e-block
block
graph
do not correspond to any stateblock for its descendant blocks
is
an e-block; (described
execute
an e-block
in Section
in left-to-right
a summarizing
block,
even
if
All
of the
“L2”; these
descendants
of a dummy
order.
Control
block
Leaf
blocks
G and
descendants.
of the
Also, we
the
do not
block. This block exista only together the blocks (if there
are more than one) dependent on the conditional. The dummy the condition that only one of the descendants of a conditional left-to-right
All
order.
out of the subroutine.
The fourth type of nonleaf block is a dummy as a descendant of a conditional block to group
executed.
is the unit
5.1).
H are
flow of control can potentially labels to show how labels affect
goto statement in the example Associated with each control
block
D in Figure
will
also be executed
4 is a dummy
defined
block satisfies block will be
because
block
with
of labels
in
three
“L1”
and
enter at these points. (We introduce the static graph, although there is no
program.) block (except
dummy
blocks)
are four
sets of
variables—the IUSE, IMOD, USE, and MOD sets—and a data dependence graph. The IUSE set is the set of variables that might be referenced before they
are defined
used variables values
might
variables block
by a statement [1] of this
be defined
that
might
of calls).
The
MOD
The
called
they
this
set is similarly
it is the set of upward-exposed set is the
in this
before
from
block;
IMOD
by statements be used
in a subroutine
in this
block.
block.
are
block
defined
(following
defined.
set of variables
The USE
Whereas
whose
set is the set of
in this
block
or any
the transitive the
IUSE
cllosure and
IMOD
sets are determined locally by inspecting the statements belonging to a block, the USE and MOD sets can only be determined by interprocedural anallysis. 1 The USE and MOD sets are described in more detail in Section 3,5, on interprocedural analysis. The branch dependence graph for a subroutine can have several summarizing blocks, one for each e-block in the subroutine. The four sets (the IIUSE, IMOD, USE, and MOD sets) for a summarizing block are the unions of the
lIn
previous
previously
papers referred
[31]
We now use terminology ACM
we
used
to as DEFINED, from
Transactions
different IUSE
Banning
terminology as USED,
MOD
for
these
sets
as GDEFINED,
as follows: and USE
IMC)D
was
as GUSED.
[8].
on Programming
Languages
and Systems,
Vol.
13 No. 4, October
1991.
500
J.-D. Choi et al
●
same sets of all of the descendants’ However, they do not contain variables
blocks that that cannot
constitute the e-block. be accessed outside the
corresponding e-block, except for upward-exposed static variables. ple, those four sets for a subroutine do not contain variables subroutine,
although
variables. variable, local
static
The program telling
whether
to a subroutine,
subroutine.
variable.
are
treated
[31] contains
a given
a static
It also tells
is a shared
variables
database
variable
variable
whether (Sequent
C has
same
as global
variable
additional
of each
variable,
C), or a formal
global two
way
scope information
is a global
(in
a given
the
the
For examlocal to the
a variable
parameter
of a parallel key
of a
program
words
to support
parallel programming [351: shared and private.) The variables in the IUSE and IMOD set of the summarizing block are the variables that will be written to the log (described in Section 5) at execution time. The structure of the branch dependence graph and the four sets of used and defined variables allows for easy identification might be used and defined during the execution for easy identification Section
5 discusses
incremental 3.2
of which
data
might
structures
use or modify
a given
work
with
together
control
block
Graph
(except
for
summarizing
and
dummy
blocks)
has a data
dependence graph that shows only the dependence between belonging to that block. Data dependence between different resolved at debug time and appear in the dynamic graph. Figure sample
control
block
and its data
dependence
ence graph has two node types: singular node represents an assignment statement, such as an if or a switch, constant
variable.
the log and
tracing.
Data Dependence
Each
e-blocks
how these
of the sets of variables that of an e-block. They also allow
used
on the
or a branch
right-hand
side
graph.
The (static)
statements blocks are 5 shows a data
depend-
and subgraph nodes. The singular a control predicate in a statement
statement
such as goto
of a statement,
or exit.
we create
For a
a constant
node, which is a subtype of the singular node. The subgraph node represents the call site of a subroutine and is a way of encapsulating the inside details of such subroutines. There is one static graph for each subroutine. Each node of the data dependence graph is labeled with the statement number and either an identifier or an expression. The data dependence graph has three edge types: data dependence, flow, and
linking
edges.
[4, 24]. (A statement uses output represented
The
data
dependence
Sz has a true
edge represents
dependence
of S1. ) A flow edge from by n~ immediately follows
on another
a true
dependence
statement
when n, to nJ is defined the event represented by
SI if S’z the event n, during
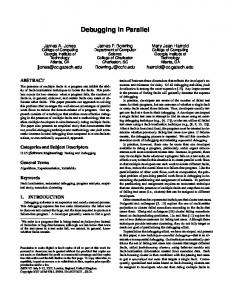
execution; it shows the control flow of the program. The linking edge helps resolve the dependence that can only be determined at execution time, for example, deciding which array element is actually accessed when the array index is a variable. Linking edges are described in more detail in Section 3.4. The top of the control block shows the variables in the IUSE set of the block, block. ACM
and the bottom of the block shows the variables in the IMOD set of the The IUSE set of a block is the set of upward-exposed used variables of Transactions
on Programming
Languages
and Systems,
Vol.
13 No. 4, October
1991
Debugging Parallel Programs with Flowback Analysis
.
501
—
S15:
a=
S16:
g2=g2
IU :
IU
a
gz
VU
a
g2
—
a-l; *a;
RJSE
lM: IMOD _
: data dependence edge : singular node
—
o
Fig. 5.
Basic block and its data dependence graph (control
—
block E in Figure
4).
the block. A data dependence edge from the IUSE entry for a variable into a node N shows a dangling data dependence in this block, meaning that the value of the variable has not been defined in this block before the statement represented by node N. A data dependence edge into the IMOD entry for a variable
shows the last
of the nodes corresponding control events
statement
in the block
modifies
the variable.
All to the in a
block are sequential. This total ordering shows the execution order of represented by the nodes and is represented by the flow edges connect-
ing the nodes,
so we can say that
control
Ordering
block.
in debugging
parallel
events
different
control
recorded
in
debugging
static
are
not
graph.
and are recorded
is described
another
processes in Section
resolved
Interlock
at
compile
time;
dependence
in the dynamic
graph
are
(described
nodle in a
is important 6. We will
not
belonging they
to
are
resolved
not
during
in Section
4).
to Subroutines
Parameters
To map
which
or before
to different
edges in the figures in this section. (dependence between two statements
blocks)
the
a node is after
belonging
programs,
explicitly show the flow Interlock dependence
3.3
that
in a data dependence graph are totally ordered according statements in the control block, because statements
between
formal
parameters
and
actual
parameters
of a subroutine
call during debugging, we create a parameter node (a variant of the singular node) for each actual parameter passed to a subroutine. Each parameter node followed by the parameter position (%0 represents is labeled with “%” a function in Figure
return 4 and
parameters 3.4 Array
value). shows
of a called
Figure 6 shows the static graph of control block C how actual parameters are mapped to the formal
subroutine.
Arrays and Linking Edges index
to identify
values
are usually
the array
elements
ACM
Transactions
unknown that
on Programming
will
at compile actually
Languages
time,
so it is not possible
be accessed. and Systems,
Vol.
Our
apprc)ach
13 No. 4, October
is
1991.
502
J.-D. Choi et al.
.
IU
S2:
a
=
Add2(gl,
gl
cj2
E
g2);
%1
%2
s2: Add2
RJSE
III:
lM: IMOD
%0
O
: singular node s2: a
8
I Fig.
6.
I
Data
to supply type, select nodes data
dependence
enough
dependence
E
: subgmph node
graphs
for parameter
information
can be quickly
in
the
mapping
static
determined
(control
graph
at debug
block
C in Figure
so that time.
array
4)
reference
We use a new
edge
the linking edge, and two variants of the singular node, the index and nodes. Index nodes show the indexes used in array accesses, and select potential represent read-accesses of an array. Linking edges represent dependence and are used during debugging to locate the actual
dependence quickly. To represent an
assignment
to
an
array
created. Nodes “ s6:A” and “ s8:A” in Figure with assignments to scalar variables, this edges from of the
the
nodes
assignment.
representing
However,
for
element,
the variables array
a singular
7 are examples node contains
node
used in the right-hand
assignments,
is
of such nodes. As data dependence
a linking
edge
side is then
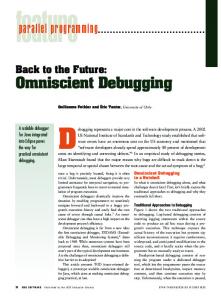
added, from the most recent node in the control block that writes the same array, to the assignment node. If there are no previous writes to the same array in the control block, then a special IUSE set entry is made for the array, and a linking edge is added from this entry. Finally, an index node is created for each array index and is labeled with “70” followed by the index position (similar to a parameter node). A data dependence edge is added from each index node to the assignment node. For example, node “ s6:A” in Figure 7 contains three incoming value, one data dependence
edges: one data dependence edge for the edge for the variable used in the right-hand
index side
of the assignment, and a linking edge from the IUSE set entry for the array being modified (since there were no previous modifications of array “A” in the control block). Because a definition of an array element is a preserving definition [1], which fails to prevent any uses reached by the definition from being upwardexposed,
ACM
a use of an array
Transactions
on Programming
element
Languages
always
creates
and Systems,
Vol.
an entry
in the IUSE
13 No. 4, October
1991
set of
Debugging Parallel Programs with Flowback Analysis
ru
s6:
a -
(A[i]
S7:
b -
A[j];
s8:
A[k]
-
i
A
b
L
i
1
a
b
A
j
1
B
.
503
k
b);
-B[l]+a+b;
[u: IUSE IM: IMOD ~ ------------
: data dependence edge ●
: linking edge
IM Fig. 7.
Data dependence graph with array and linking
the control the control
edges (control
block Gin Figure
block. We also insert an entry if the first reference block is a definition of an element, in anticipation
use of the array. A read from an array element node is created to represent the node “ S7 :B”
in Figure
side of statement from the index
is handled read. For
7 represents
s7. This node and
the array
4).
to the array in of a subsequent
identically except that a select example, the select node above access “Aljl”
on the right-hand
select node has an incoming data dependence an incoming linking edge from node “s6:A”,
edge the
most recent modification of array “A” in the control block. The above mechanisms are similar to the ideas used for array-related dependence in 1341. The actual data dependence for each array read are determined during debugging and are reflected in the dynamic graph. Once the fine traces for the e-block containing an array read are generated, the index values of all array accesses in that e-block will be known. The linking edges are followed backward, from the select node, until an assignment to the same array Iocation is found. A data dependence edge can then be added in the dynamic graph from this assignment to the select node. If no such assignment is found
ACM
Transactions
on Programming
Languages
and Systems,
Vol.
13 No. 4, October
1991.
504
J.-D. Choi et al.
●
(the
IUSE
exists
set entry
for the
described
USE
read.
in Section
Interprocedural
3.5
for the
array
and
identify
MOD
more
array The
was reached),
dangling
then
a dangling
dependence
can then
dependence be resolved
as
5.
Analysis and Data Dependence sets,
precise
computed (potential)
by
Graph
interprocedural
dependence
analysis,
information
than
allow
us
to
the worst-case
assumption that every global variable in the program is possibly used and defined by each call to a subroutine. In this section we describe the use of the USE and MOD sets. Building the data dependence
graphs
with
interprocedural
analysis
is done
in two steps. The first step is done at compile time without interprocedural information, building the pregraph form of the data dependence graphs. The graphs in Figures 5-7 are all pregraphs. The second step is done at link time, producing the postgraphs by modifying (if necessary) the pregraphs with interprocedural
summary
information.
When
several
are recompiled with separate compilation, pregraphs of the recompiled modules. Only calls
to subroutines
again. Figure
whose
USE
or MOD
Figure 8 shows the pregraph 4. We outline how to build
section.
Detailed
Our
algorithms
approach
follows:
When
we meet
to
include
a subroutine
set has changed
and the postgraph the pregraph and
for building
(heuristics)
modules
of a program
we need to rebuild only the those postgraphs that contain
these
graphs
appear
interprocedural
call in building
need
to be built
for control block H in the postgraph in this in [101.
information
the pregraph
is
as
of a control
block, we assume that all of the global variables written so far in the control block might be written by the subroutine. Then, we create a linking edge for each such global variable out of the most recent node that wrote the variable and into the subgraph node representing the subroutine call. We use the linking modified more
edges to identify to produce the
pessimistic
computed modified
than
the parts of the pregraph that might corresponding postgraph. Our approach approaches
interprocedurally, by a subroutine
that
use
as the basis call [21. However,
the
MOD
of determining our approach
set
need to be is certainly
of a procedure,
what is simple
might be to imple-
ment and not overly pessimistic, in that we do not assume that all of the global variables, but only those that are used or defined in a control block, might be modified during the execution of a subroutine called in the control block. We need more experiments with the working prototype under construction before we can evaluate the effectiveness and efficiency of this approach. When building
the postgraph,
reflected in each subgraph dependence edge into the the out the for the
the interprocedural
summary
information
USE set of the subgraph node. Second, we create a data dependence of the subgraph node for each global variable that is in the MOD subgraph node. Finally, we create a linking edge into the subgraph each global variable that is in the MOD set but is not in the USE subgraph node.
ACM
Transactions
on Programming
is
node in the following ways: First, we create a data subgraph node for each global variable that is in
Languages
and Systems,
Vol.
13 No. 4, October
1991.
edge set of node set of
Debugging Parallel Programs with Flowback Analysis IIU: IUSE S9:
a = gl: g2 = a;
Sll: S12:
gl
S13:
g2
rf.f
u: USE M MOD
= g2;
SubX(a)
;
= g2
gl
505
fJ(SubX) = {g2) M(SubX) = (gl, g3)
IW IMOD
Slo:
.
—————$ : dats depmdence edge + g3;
--------- ... ●
g3
f.1
gl
edge
✚linking
g3
—
\
*
s12: SubX
— EM
a
gl
g2
M
a gl
PRE-GRAPH Fig.
8.
Figure
Data
dependence
g2 g3
—
POST-GRAPH graph
before
and
after
interprocedural
analysis
(control
block
H in
4).
The linking edge is needed because USE and MOD are sets of variables that might be accessed during the procedure call. For example, if during debugging we discover “gl”, we need to locate might
modify)
“gI”,
that “SubX>’ (see Figure 8) does not actually modify the most recent node before “SubX’> that modifies (or which
in this
example
is “.s11 :gl”.
The
linking
edge
from “s11 :gl” to “ s12 :SubX” serves this purpose. (Note that the linking was similarly used for arrays in the previous subsection.) Figure 8 shows how the postgraph is constructed from the pregraph information
from
interprocedural
analysis.
First,
the
linking
edge
edge and
of “g2”
into the subgraph node in the pregraph is changed into a data dependence edge, because “g2” is in USE(SubX). Second, the data dependence edge of “g2” out of the subgraph node into the node “s13:g2” is disconnected from ACM
Transactions
on Programming
Languages
and Systems,
Vol.
13 No. 4, October
1991
506
J.-D. Chol et al.
.
the subgraph node and reconnected into the node “s10 :g2”, because “g2” is not in MOD(SubX). The reconnection is done by following the ‘ ‘g2” dependence through the subgraph node. Third, there are two additional edges out of the subgraph node “s13:g2”.
node: These
one into the MOD entry for ‘ ‘g3” and edges are added because “g3” turned
the other into out to be in
MOD(SubX).
Last, the data dependence edge from the IUSE entry for “g3” is deleted. The linking edge out of ‘
tq
tz
t, Fig,
Sub4. given
+14+
+[2+
ts
t4
Log intervals
generation
and debugging
time
activities
are
E-Blocks
how to divide
the program
into
e-blocks.
The only
condition for several consecutive lines of code to form an e-block is that there is a single entry point. Whenever control is transferred from one e-block to another,
the
e-block,
where
where
control the
the control
constructing
must prelog
be transferred is made.
is transferred
an e-block
are well defined. dependence graph
entry
postlog since
point
is made
out of an e-block.
is the subroutine,
of the
at the
One natural
the entry
to the performance
execution and debugging phases. In e-blocks large in favor of the execution
point
candidate
and the exit
for
points
general, phase,
of the system
if we make the debugging
during
the
the size of the phase perform-
On the other hand, if we make the size of the e-blocks small debugging phase, execution phase performance will suffer.
Although
the
introduce
unacceptable
number
of logging
points
performance
should
be small
degradation
during
enough
has no direct
relationship
to the
time
so as not to
the execution
it should also be large enough so as not to introduce unacceptable in generating fine traces during the debugging phase. Consider, the case in which the size of a subroutine is very large. Though subroutine
second
exit
(Actually, an e-block could be any node of the control in PDG [15], since the entry and exit points of each node in
PDG are well defined.) The size of e-blocks is crucial
ance will suffer. in favor of the
to the
The
needed
phase,
time delay for example, the size of a
to execute
it,
we
can act conservatively to construct several e-blocks out of such a large subroutine. Loop constructs, even though small in size, may require long execution time and, thus, introduce unacceptable time delay in generating fine traces. Currently, the PPD compiler constructs one e-block from each loop. However, the
compiler
nested
loops.
constructs Defining
only e-blocks
one
e-block
for
loops
from allows
the the
outermost debugging
of multiply phase
to
proceed without excessive time spent in reexecuting the loops. Still, if the user is interested in the execution details inside such loops, we can reexecute the e-blocks corresponding to the loops. Three elements can affect the program behavior of an e-block: the initial state as recorded by the prelog, the code of the e-block, and input statements ACM TransactIons on Programming Languages and Systems,Vol 13 No. 4, October 1991
Debugging Parallel Programs with Flowback Analysis in the make
e-block.
We need
the behavior
execution. consists
to accommodate
of the
e-block
We can make
each
of the variables
during
input
affected
input
statements
debugging
statement
the
515
in an e-block
same
an e-block,
by the input
.
as that
whose
to
during
IMOD
set
statement.
5.3 Log Optimization Small
and
frequently
called
subroutines
can be a problem.
If we make
an
e-block out of each small subroutine, the amount of logging done during the execution phase may be large enough to introduce unacceptable performance degradation. To avoid this problem, it may be better not to make e-blocks out of subroutines correspond
that
to leaf
do not nodes
contain
in the
subroutine
call
graph).
calls
(i. e., subroutines
If an e-block
that
is not formed
from
such a subroutine, then the subroutine itself does not perform any logging. Instead, the e-blocks that call this routine (its parent e-blocks in the call graph)
perform
its logging.
However,
a subroutine
that
either
contains
a loop
or contains accesses to a static variable such optimization. This process can
(in the C language) is not eligible for be applied recursively to the parent
e-blocks
of levels
and can continue
by the user)
5.4
until
Locating
When
any number
an e-block
phase
starts,
the last log interval, ment executed. (The
that last
execution
to an error
initial
halted
dynamic
due graph
that
up the call graph
is ineligible
(as specified
for optimization.
for Incremental Tracing
Log Intervals
the debugging
is reached
we generate
fine
debugging-time
traces
is, the log interval that contained the log interval usually lacks the postlog or to user
to be constructed.
intervention.)
From
then
This
on, there
for
last statewhen the allows
the
are three
cases
when we need to generate fine traces for a new log interval: (1) when the user wants to know the details of the dependence of a parameter passed from a calling subroutine, (2) when the user wants to know the details of a hidden dependence edge, that is, a dependence edge that either terminates into or comes out of a subgraph node, or (3) when the user wants to know the details of a dangling
dependence
(a dependence
e-block before it is written). When the user wants to know can
easily
intervals
locate
the
are nested
log
for
a variable
the detailed
interval
as in Figure
needed
that
dependence to generate
14, and the
caller’s
is read
in
of a parameter, fine
traces;
log interval
an we
the
log
is the
one
enclosing the current log interval. When the user wants to know the detailed dependence of a function return value, we can also easily locate the needed log interval; the callee’s log interval is one of those intervals nested in the current
log interval,
and
log intervals
at the
same
nesting
level
are gener-
ated in the execution order of the called subroutines. When the user wants to know the details of a hidden or dangling dependence, we need to identify the log interval needed to generate fine traces to show the details. To facilitate identifying such log intervals, we obtain the IMOD set of each e-block at compile time and keep it as part of the program database
[311. We also keep ACM
Transactions
in the
on Programming
program Languages
database, and Systems,
for each variable Vol.
13 No. 4, October
that 1991.
516
J -D. Choi et al.
.
LOG
PRELOG(l)
extern
— e4
g2,
g3;
k 1
POSTLOG(3) — e2 PRELOG(4) — el
,.X
‘.. ._
k
POSTLOG(4) — el
,.
PRELOG(5)
— d
PRELOG(6)
— e2
PRELOG(7)
— e3
TABLE
H
PRELOG(3) — e2
,, ‘.. ..
gl
el, e2, e3
g2
el, e2, e4
g3
el, e3, e4
-1
,., -
..-* ,,, > ,’ ,, ,. * I ,< 4.. .‘, .. ~. --.. . . ... . . . -. -. -. ,,,
E-BLOCK
k 1
POSTLOG(2) — el
,,,
glr
PRELOG(2) — el
,.~ ‘.. .-
.,
int
POSI’LOG(7)
— e3
POSTLOG(6)
— e2
k -1 1 -+-1
k --–-–
~
~
-–-–
;
-t-+-;-7
E-POINTERS Fig.
14,
LOG
might be accessed by more the variable in their IMOD table
in Figure
and “g3”. Figure
14 shows
14 also
with
pointer
for each e-block
type
than one e-block, the list of e-blocks that contain sets. We call the list the e-block table. The e-block the
shows
a back
list
of e-blocks
an example
for three
log file.
Log
variables:
entries
“gI”,
“gZ”,
generated
by the
same e-block form a linked list; each postlog has two pointers: one pointing to its corresponding prelog, and the other pointing to the most recent postlog E-pointers are an array of pointers to the last log made by the same e-block. entry To
made
by
locate
the
variable, their
we IMOD either
case
of hidden
may if the e-block
first the
dependence. need last that
and
recent
retrieve The most
the
list
that
also
of
or the
the
if the of the
potentially
ACM TransactIons on Programmmg
during that
e-blocks
log e-block
variable
fine
entries did
in
the
e-block
any
of these
the
prelog
for not
in the
contain
traces that
in
e-block
variable
Languages and Systems, Vol
the
by
using
log
interval.
actually
execution.
a modification
by
recent
the
modifies
that
produced most
program
contains
is stored
postlog
and
to be repeated modification
list
generate
e-block
updated
interval
of e-blocks
recent
finally
are
log
dependence, We
for
e-block
most
sets.
locate
package
each
modify occurred
the table.
a in
We
e-blocks case
to
variable
then in the
of dangling
the
emulation This
the
process
variable
before
[10]. 13 No 4, October 1991.
a nested
or
Debugging Parallel Programs with Flowback Analysis When
we construct
debugging-time e-block local
that to
more
efficiency might
write
a subroutine
than
one
e-block
considerations, a local
has
variable.
an
out
we in
of subroutine
sometimes
Unlike
instance
need
global
each
. because
of
locate
an
to
variables,
execution
517
a variable
instance
of the
subroutine, and we should not use log entries generated by different tion instances of the subroutine for the detailed dependence of
execua local
variable.
5.5 Arrays and the Log For
an e-block
IMOD in the
with
array
accesses,
sets that contain only e-block. One approach
even if only
a few array
it is not
possible
to compute
elements
are accessed.
A second
to trace every array access. However, both approaches ate a large amount of traces during execution. Our solution array accesses:
entry
a systematic
for the
approach
is simply
can potentially
gener-
if the array is accessed in a loop and the array data dependence on the loop control variable.
access, we regard
the
entire
array
ate a log entry (as usual) for the entire array. types of accesses to arrays as random accesses the array
and
to this problem is as follows: We distinguish two types of systematic accesses and random accesses. We say there is a
systematic access to an array index has a possibly transitive With
IUSE
those array elements that are actually accessed is to generate a log entry for the entire array
array
element
index
and the
at the time
accessed
and gener-
value
(read
or updated
value)
of
the access is made.
6. PARALLEL PROGRAMS AND FLOWBACK The discussion
as accessed
We regard all of the other and generate a special log
so far has described
ANALYSIS
mechanisms
to implement
efficient
flow-
back analysis for sequential programs. In this section we discuss the mechanisms for extending flowback analysis to parallel programs. For parallel pro~ams, data dependence may exist across process boundaries. Locating such data dependence involves constructing an abstraction of the dynamic graph that the events
contains the events belonging in this graph. With additional
incremental establish
tracing
the program 6.1
Parallel
To apply
scheme
dependence execution Dynamic
flowback
of the dynamic events belonging
described
between
to all processes and then ordering logging of shared variables, the in
processes.
Section
In addition,
5 can
then
potential
be data
used
to
races in
can be detected. Graph and Ordering
analysis
to parallel
Concurrent programs,
Events we construct
graph, called the parallel dynamic graph, to all processes in the program execution.
an abstraction
that contains the To this graph we
add edges that allow us to determine the order in which these events executed. From this ordering, data dependence can be established across process boundaries, and data races can be detected. We now describe how to construct the parallel dynamic graph and what run-time information must be recorded ACM
to
do
so.
Transactions
We
then
on Programming
show
how
Languages
this
graph
and Systems,
orders Vol.
the
events
13 No. 4, October
1991.
518
J.-D. Choi et al.
.
belonging to different processes, and how this ordering data dependence, and data races, to be detected.
6.1.1 Parallel dence graph (or graph tailed the
Dynamic parallel
that shows dependence
node,
edge (Figure
interprocess
dynamic
program
is an abstraction
of the
between processes while This graph contains only
and two
15 shows
parallel
graph)
the interactions of local events.
synchronization
internal
The
Graph. dynamic
allows
edge types,
an example
the
dependynamic
hiding the deone node type,
synchronization
of a parallel
edge and
dynamic
graph).
A
synchronization node is constructed for each synchronization operation in the program execution. A synchronization edge from one node to another indicates that the first synchronization operation executed before the second. An internal edge abstracts out all events (belonging to the same process) that executed example, event
between the synchronization operations connected by the edge. For in Figure 15 all of the events of process PI that executed before
nl, ~ also executed
after
event
viewed
nz, ~. The
before
as a generalized
We now describe
all
those
synchronization flow
edge that
how to construct
events edge
spans
Pz that
nl, ~ and
executed
nz, ~ can
be
the two processes.
synchronization
use semaphores. Other synchronization dezvous, etc.) can also be handled [10]. nization between
of process
between
primitives In general,
edges for programs
that
(such as messages, renwe construct a synchro-
edge between two nodes if we can identify the temporal ordering them. We say that the source node of an edge is the node connected
to the tail of the edge, and the sink node of an edge is the node connected to the head of the edge. Semaphore operations, such as P and V, are used in controlling accesses to shared resources by either acquiring resources (through a P operation) or releasing edge
resources
from
senting
the
(through
node
a V operation).
representing
some P operation
on the
each same
We construct V
operation
semaphore.
Each
a synchronization to
the
node
V operation,
reprewhich
releases resources, is paired with the P operation that acquires those released resources. There are two cases to be considered. The first case is where the second process tries to acquire the resources before the first process releases them; the second process thus blocks on the P operation until the V operation of the first process. The second case is where the first process releases the resources before the second process tries to acquire them; the second process does not block on the P operation in this case. In both cases, we define a source node for the V operation and a sink node for the corresponding P operation. The operations on a semaphore variable are serialized by the system that actually implements semaphore operations, and identifying a pair of related semaphore P operations is done by matching the nth V operation to the (n + i)th value operation on the same semaphore variable, where i( z O) is the initial of the semaphore variable. Additional logging is necessary to record the information required to determine this semaphore pairing. Each semaphore operation generates a log entry ACM
(for the process Transactions
it belongs
on Programming
to) containing
Languages
and Systems,
a counter Vol.
13 No
that 4, October
indicates 1991
how
Debugging Parallel Programs with Flowback Analysis P2
PI
H
nl,l
.
519
P3
internal edge
/
n2,1
n2,2
synchronization
edge
n2,3
h
n2,4
nl,2
Fig.
many
operations
on the
15.
Example
given
semaphore
semaphore
operations
can
constructed
from
log entries.
6.1.2 represents
these
parallel
easily
dynamic
have
be paired
graph.
previously
and
the
been
issued.
synchronization
Ordering Events. In the parallel dynamic graph, the set of events bounded by the surrounding
The edges
each internal edge synchronization
operations. The order in which two events executed can be determined if there is a path between the two internal edges that represent those events (if no such path exists, then the actual execution order cannot always be determined). We partially order the nodes and edges of the parallel dynamic graph
by defining
the
happened-before
relation
[27], + , as follows:
(1) For any two nodes nl and nz of the parallel dynamic graph, nl true if nz is reachable from nl by following any sequence of internal synchronization
nz is and
edges.
(2) For two edges el and ez, el + ez is true if nl + nz is true where nl is the sink node of the edge el, and nz is the source node of the edge ez. There
are
several
approaches
to
ordering
events
in
a parallel
program
execution [10, 14, 16, 17, 27, 32]. Although the ordering between two events can be determined by searching for a path in the graph, a more efficient representation of the happened-before relation can be constructed that allows the order between any two events to be determined in constant time. Such a representation is constructed by scanning the graph and computing, for each node, vectors that show the latest (or earliest) nodes in all processes that happened before (or after) that node [10]. ACM Transactions on Programming Languages and Systems,Vol. 13 No, 4, October 1991
520
6.1.3 have
J.-D. Choi et al.
. Data
been
Races.
ordered,
Once the events flowback
in the execution
analysis
can
of a parallel
be performed.
program
Dependence
that
span process boundaries can be successfully located when the execution is data-race free. Once these dependence are located, the incremental tracing scheme described in Section 5 can be extended to reexecute e-blocks belonging to different processes, allowing the dynamic graph to be constructed. We now
show
how
subsequent processes When
to determine
subsections,
when we
and how to extend the
user
the
show
execution
how
incremental
requests
to
see the
to
contains
locate
tracing
data
races.
dependence
to parallel
dependence
for
that
In the span
programs.
a read
of a shared
variable, “SV”, we must locate the event that assigned the value to “SV’> that was read. Locating this event involves finding all events that wrote “SV” and determining their order relative to the read event. However, when two events both access “SV” and are unordered by the happened-before relation, not enough information is available to determine which access occurred first. If at least one of the accesses is a write, A data race is usually a program race is said to exist.
then bug,
two events
both
at least
and either
did execute
Definition A ~ (e2 +
access a common
6.1.
shared
concurrently
Two
edges
variable
(that
or had the potential
el and
ez are
a potential and exists
one modifies)
of doing
simultaneous
edges
data
when
so. if ~ ( el -
e2)
cl).
Definition 6.2. READ-SET (e,) is the set of the shared variables read in e,. WRITE_SET( e,) is the set of the shared variables written in edge e,.
edge
Definition
6.3.
the following
Two simultaneous
conditions
(1) WRITE_
SET(el)
fl WRITE_
(2) WRITE.
SET(el)
(l READ.
(3) READ_
SET(el)
Definition
6.4.
of simultaneous To
(1 WRITE A program
when
el and
SET(e,)
ez are
data-race
free
if all
the
= @.
SET(e,)
= @.
_SET(e,)
= @.
execution
edges in the execution
determine
edges
are true:
program
is said to be data-race are data-race execution
free
if all pairs
free.
is data-race
free,
additional
tracing must be performed to record the shared variables that are read and written by the events represented by each internal edge. For this purpose we maintain bit-vectors (representing basic blocks) during execution and set a bit every time execution enters a basic block [5]. The size of these bit-vectors is computed at described in the tors, the sets of determined. To trace each array arrays (described flowback analysis,
compile time (by inspecting the simplified static graph, next subsection). From the run-time trace of these bit-vecscalar shared variables that were read and written can be determine which shared array elements are accessed, we access. Our mechanism for logging randomly accessed in Section 5.5), which must be employed anyway for will provide the necessary information. However, for
ACM Transactions on Programming Languages and Systems,Vol. 13 No 4, October 1991
Debugging Parallel Programs with Flowback Analysis systematic
accesses,
we must
Since only the access type value,
optimizations
overhead.
For
read
instead
trace
or write)
can be performed
example,
regions of the array that single record, resulting fraction
additionally
(either
to reduce
of writing
each
must
shared
. array
be recorded,
the associated
a trace
521 access.
and not the
execution-time
record
for
each
access,
were accessed can sometimes be summarized [61 by a in a trace whose length is proportional to a small
of the number
of array
elements
The execution can be analyzed ways. Either the entire execution
accessed.
for the presence can be checked
of data races in one of two for data races at one time,
or data races can be detected only when the user follows back dependence. In either case, we can only detect when a program execution is data-race free. When an execution is not data-race free, a set of potential data races (between edges that are not data-race free) is reported. Only potential data races
are
reported
necessarily
mean
because that
when
two
edges
all of the events
are
comprising
simultaneous
it
does not
the edges executed
concur-
rently or had the potential of doing so. Rather, it means that the program’s explicit synchronization did not prevent the events from executing concurrently;
accidental
still
prevent
always
synchronization
them
detects
from
data
(through
executing
races when
they
the
use of shared
concurrently.
However,
exist
reports
and only
variables) this
a data
at least one occurs [32, 331. This data-race detection scheme is similar to other methods 33], with the exception of pairing the P and V operations.
6.1.4
Data
Dependence
for Parallel
Programs.
When
see a dependence for a read of a shared variable, most recent modification to that variable. This finding
the event
is the one that the
that
wrote
happened-before
assigned “SV”
the value
that
relation.
is most
To locate
this
race when
[5, 13, 18, 32,
the user requests
“SV”, we must locate dependence is located
to “SV” recently
can
approach
that
was read.
ordered
write
event,
This
before the
to the by
event
the read
latest
by
edge
in
each process that happened before the edge containing the read is located. These edges give a boundary beyond which all events executed concurrently with or after the read event. Each process in the parallel graph is then scanned backward from this boundary to find an edge that modified “SV”. The
ordering
executed
last.
the
event.
read
of all A data
such
write
events
dependence
A unique
write
is examined
can then event
to determine
be drawn
is guaranteed
from
this
which last
to be found
is read
by
process
p~ and
is modified
by
processes
PI
to
if no data
races involving “SV” exist (unless, of course, “SV” was uninitialized). Figure 16 shows an example of a parallel graph in which a shared “SV”
one
event
and
variable Pz.
establish the data dependence edge for “SV”, the most recent modification “SV” that occurred before the read must be located. If events belonging edges ez ~ (the edge emanating from node n2, 1) and el, o (the topmost edge then a data dependence process ‘pl) are the only modifications of “SV”,
TO of to of is
established between the event ez, ~ that modified “SV” and the event in e3, 1 that read “SV>’. If, for example, there exists another event that modified “SV” in any of the edges el, ~, el, z, ez,2, e2, ~, or ez,A (i.e., edges simultaneous ACM Transactions on Programming Languages and Systems,Vol. 13 No. 4, October 1991.
522
J.-D. Choi et al.
.
PI
P3
P2
el,o e 2,o e3,0
ez,l
Fig.
16.
Dependence
that
span
‘?
el,l
pro-
SV=b ;
cesses.
e2,2
n2,3 e2,3
e3,1 > n 2,4
nl,z I
e 2,4 el.2
to ea, ~), then data 6.2
we cannot
race is reported Incremental
tell
which
Tracing
for Parallel
Our implementation of incremental the reproducibility of the debugged mental tracing to shared-memory ity.
Our
subset
solution
of the
nization
operations
additional 6.2.1
fied
static
logging Simplified
static
graph,
event
actually
modified
“SV”
last,
and a
to the user.
uses a graph graph
that
between
Static
tracing described in Section 5 relied on program. We now discuss applying increparallel programs that lack reproducibil-
called abstracts
processes.
is required
consider
Programs
Graph.
to support
the
simplified out
From
this
graph, except
graph
incremental
To motivate
the example
static
everything
we
is a
synchro-
determine
what
tracing.
the construction
shovvn in Figure
which the
of the simpli-
17, which
contains
a
subroutine that accesses a global variable named “SV”. The subroutine also constitutes an e-block. The statement indicated by the arrow is the first statement that accesses the variable “SV’> in this subroutine. In the case of a sequential program, we construct a prelog that saves the value of “SV” at the beginning of the subroutine. The value of “SV’> will not be changed until it is first accessed in the statement indicated by the arrow. Hence, one prelog and one postlog are sufficient to obtain reproducible behavior when reexecuting parts of sequential programs during debugging. However, now consider the case of a parallel program. If “SV)’ is a shared variable, we cannot guarantee that the value of “SV” saved in the prelog at the beginning of the subroutine will be the same as when “SV” is first read; other processes may have changed the value of “SV>’ between these two moments. Reexecution of this e-block may therefore perform a different ACM Transactions on Programming Languages and Systems,VO1 13 No. 4, October 1991
Debugging Parallel Programs with Flowback Analysis
SubB
.
523
ENTRY
()
{ int
a,
if
(p==. if
b,
c,
p,
..)
{
?
q;
..)
(q==. . .
}
llse . . .
{
Subc }/*
q
*/
() ;
L?6
q*/
else +
/’
{
/*
P
*/
SV=a+b+SV; SubA()
;
. . . )
}/* /*
p*/ SubB
*/
EXIT
❑
: branching node
O
:non-branching
7
Thisnode
o
This nodecomesponds Fig. 17.
node
corresponds tothesubroutine
Subroutine
computation than was originally more run-time information must parallel
programs.
Such
totiesubroutine
callof
SubA
cdlof
SubC
and its simplified
static graph
performed during execution. In general, be recorded to ensure reproducibility of
additional
information
is used
to restore
the
pro-
gram state for read-accessed shared variables. The simplified static graph allows us to determine which shared variables must be recorded and where in the program they should be logged. In our examples we only consider semaphore
operations;
synchronization The simplified
however,
primitives. static graph
this
approach
is a subset
only flow edges and nodes that (such as if or case statements)
can be generalized
of the
static
graph
represent either possible or semaphore operations
that
to other contains
control transfers (Figure 17 also
shows the simplified static graph for subroutine SubB). Any subgraph node representing a subroutine that may perform a semaphore operation during its execution (or during the execution of any subroutine that may be transitively called by it) is treated as a semaphore operation. The simplified static graph therefore contains only branching nodes, which represent possible and non branching nodes, which represent possible control’ transfers, semaphore operations. 6.2.2 Synchronization the additional logging
for
Units and Additional shared variables, the
Logging. simplified
To static
generate graph is
ACM Transactions on Programming Languages and Systems,Vol. 13 No, 4, October 1991
524
J.-D. Choi et al.
.
partitioned to record
into synchronization units, which identify which and where in the program they should be logged.
Definition
6.5.
reachable
A
from
without
passing
synchronization
unit
a given
nonbranching
through
another
consists
node
nonbranching
The sets {el, e2, e3, e5, efj, ‘a, eg } , {e., each constitute a synchronization unit. The object code generates an additional synchronization accessed
unit
inside
the
for
those
generated
for the write-accessed as the
unit,
shared
synchronization
tion
regular
of all
the
e,},
and
e,,
at the that
There
static
e,}
are
graph
in Figure
beginning
are
17
of each
potentially
read-
is no corresponding
variables
generated
edges that
simplified
{e,,
prelog
unit.
the
variables
node.
variables
shared
logs
in
shared
postlog
at the end of a synchroniza-
at the
beginning
and
end
of the
e-block contain the values of both shared and nonshared variables. The additional prelog of the read-accessed shared variables is used to ensure repeatable reexecution of the events in the synchronization unit. As long as there were no data races during for ensuring repeatable execution 7. PERFORMANCE This
section
presents
measurements
time
the
code generated
Sequent time
of application
Symmetry
trace
size.
the additional prelog during debugging.
will
suffice
MEASUREMENTS
execution object
execution, behavior
by the
C Compiler. There
of the
programs. PPD
overhead
compiler
with
We also present
is a trade-off
caused
We compare
between
the that
by PPD
execution generated
measurements
the
amount
on the time
of
by the
of execution-
of trace
generated
during execution time and the amount generated during debug time. The trade-off is based on selecting the size and location of e-blocks. Our current heuristics for making this selection are quite simple, so the performance numbers give only an initial indication of the cost of using PPD. We present SH.PATH
measurement
- 1, SH-PATH-2,
results
of five
and CLASS.
test
SORT
programs:
SORT,
sorts a vector
MATRIX,
of 100 integers
using an Insertion Sort algorithm, whose time complexity is 0( nz ). MATRIX multiplies two square matrices of integers into a third matrix. The size of each matrix, for our tests, is 100 by 100. MATRIX uses a subroutine in multiplying two scalar elements of the two matrices. The subroutine does not contain a loop or accesses to a static variable, making that subroutine a target of log optimization (see Section 5.3). SH.PATH. 1 computes the shortest paths from a city to 99 other cities using an algorithm described by Horowitz and Sahni [19]. SH–PATH-2 is the same as SH_PATH - 1 except that it computes the shortest paths from all of the 100 cities to all of the other cities. CLASS is a program that emulates course such as registering for courses and dropping from run as an interactive program. 7.1
Execution
The
goal
unduly
registration for courses. CLASS
students, also can
Time
of the
burdening
PPD the
design other
is to minimize phases
execution-time
of program
execution.
overhead Table
without
I shows
ACM Transactions on Programming Languages and Systems,Vol. 13 No 4, October 1991.
the
Debugging Parallel Programs with Flowback Analysis Table I.
Test Program
Execution
Time Measurements PPD
Sequent
without
compiler SORT CPU
Elapsed
MATRIX CPU
Elapsed
525
(time in seconds)
compiler
PPD compiler
log optimization
(overhead
.
with
in%)
log optimization
(overhead
in%)
5.5
5.7
(3.6%)
5.7
(3.6%)
5.6
6.1
(8.9%)
6.1
(8.9%)
12.7
52.5
(313.4%)
13.4
(5.5%)
12.7
54.7
(330.7%)
13.7
(7.9%)
SH.PATH.1
1.1
1.8
(63.6%)
1.8
(63.6%)
CPU
1.3
2.2
(69.2%)
2.2
(69.2%)
Elapsed
sH_PATH_2
107.0
105.5
CPU
107.0
107.3
(2.8%)
0.3
0.4
(33.3%)
0.4
(33.3%)
0.4
0.7
(75.0%)
0.7
(75.0%)
Elapsed
CLASS CPU
Elapsed
105.5
(-2.4%)
(–2,4%)
107.3
(2.8%)
execution-time overhead of the tested programs. Execution-time overhead ranges from O to 330 percent for object code that is not log-optimized and from O to 75 percent for object code that is log-optimized. MATRIX has the largest performance improvement from log head of MATRIX is reduced from subroutine
that
is called
subroutine. Without prelog-postlog pair, one million loop
becomes
one million
(100
The execution-time percent. MATRIX
by 100 by 100) times
log optimization, each call to this resulting in a large execution-time
prelog–postlog
or accesses
optimization. 330.7 to 7.9
pairs).
to static
a non-eblock
However,
variables;
subroutine,
with
this log
subroutine
Log optimization
might
non-eblock
in the program; additional invoked.
parent
produce
is never
becomes
the parent
e-blocks
a higher
invoked
of these
does not have this
and the caller
actually
subroutine
by another generates a (due to the
optimization,
The non-eblock subroutine does not generate log smaller execution time, Accordingly, log optimization have a large reduction in the size of execution-time if the
subroutine overhead
a
subroutine e-block.
entries, yielding a much also causes MATRIX to traces. execution-time
due to conditional
non-eblock
overhas a
subroutines
overhead statements
may generate
log information for the non-eblock subroutines that are never However, we expect that such cases of losing by log optimization
should be rare. We also see that the beginning
copying
the contents
of an entire
or at the end of a loop is inexpensive
overhead if most is the case with
of the array elements program SH–PATH–2.
are actually However,
array in terms
(for a log entry)
at
of execution-time
accessed in the loop. Such if only a fraction of the
array elements are accessed in a loop, dumping out an entire array can be expensive, as seen in test program SH–PATH– 1. One possible way to reduce this overhead is to generate a smaller log entry containing only the particular row (or other part) of the matrix that is actually accessed by employing techniques for succinctly summarizing data accesses in arrays [6]. ACM
Transactions
on Programming
Languages
and Systems,
Vol.
13 No
4, October
1991.
526
J.-D. Choi et al.
.
Array
logging
also
can
cause
interesting
some
Notice that test program SH.PATH-2 time (the sum of user and system time) compiler. loop that This
anomalies.
The PPD compiler generates logging code immediately before the accesses a large array; the logging code accesses the entire array.
extra
tecture
performance
shows a slight improvement in CPU with the code generated by the PPD
access seems to affect
level)
of the
the paging
program,
currently investigating Program CLASS can
behavior
resulting
less
in
this anomaly. also run as an interactive
@ossibly
at the
execution
time.
program,
archi-
We
Whereas
are
there
is
a 33 percent
increase in CPU time and a 75 percent increase in elapsed time file, there was no noticeable difference in CLASS ran using an input
when
the response 7.2
times
Execution-Time
when
CLASS
Trace
Size
ran
interactively.
Table II shows the sizes of execution-time traces (log) generated by the test programs. As described before, pro~am MATRIX has a substantial decrease in trace size from log optimization. Program CLASS has a slight increase in trace
from
size
7.3
Trade-off
As
described
execution
log optimization Between
of the reason
Run Time and Debug
Section
in
because
3, there
and response
is
during
time
previously.
Time
trade-off
a
described
between
debugging.
efficiency
If we construct
during e-block
an
in
favor of the execution phase, debugging phase performance will suffer. On an e-block in favor of the debugging phase, the other hand, if we construct execution phase performance will suffer. Table III shows the reexecution times and debug-time trace sizes of various e-blocks of the tested programs. nested loop that sorts the list
The e-block from SORT consists of a singly of numbers once. The e-block of MATRIX is
made of a triply nested loop. By constructing a single e-block out of the triply phase overnested loop of MATRIX, we were able to reduce the execution head, but with a large debug-time overhead: 166 seconds in reexecution time and
about
58
Mbytes
time
of MATRIX
0.12
Mbytes,
is out
of the
execute nated These
than
generate tion
time
decision tion
of a singly
one (such
as to
of an e-block
an
that
out
one
of
full.
it
made another
be made
shortest
might
that
sometimes loop.
out
of
One for
dynamically
from
about the
100 be
100
of
with
a nested
loop).
In
pair
during
SH_
of trace.
to
construct
might
e-block
to
termi-
e-block
better
cities
5 seconds
Mbytes
alternative
at execution
paths
PATH–2
an
prelog-postlog
is III
is constructed
of SH–
than
size
Table
shortest
paths
time,
more
pair
the
- 1 took
e-block
At
with
a nested
e-block
on Programming
the the
prelog-postlog
generate
could
was
computes
1 in
of SH-PATH-2
of SH-PATH
7 minutes
suggest
than
whether
ACM Transactions
system than
that
execution
trace
of SH-PATH.
e-block
while
the
execution-time
e-block
computes
e-block
a comparison,
and
loop the
of trace,
e-block
more
that
The
file
more
results
while
loop
Mbytes
the
nested
cities,
cities.
1.3
lasted two
more
The
nested
because
PATH-2
optimization.
other
with
For
log
to 99 other
of a doubly
to all
trace. 13 seconds,
out
a city
debug-time
is about
with
constructed
from
of
itself
long this
be
case, the
time.
Languages and Systems, Vol. 13 No. 4, October 1991.
to
executhe
execu-
Debugging Parallel Programs with Flowback Analysis Table
II.
Execution-Time
Trace
Size Measurements
With log optimization
log optimization SORT
18,209
18,209
40,120,221
SH.PATH.
1
120,217
825,517
825,517
sH_PATH.2
417,129
417,129
CLASS
104,508
104,892
Table
III.
Reexecution
Times
527
(sizes in bytes)
Without
MATRIX
.
and Trace
Sizes (time
in seconds)
Debug-time Reexecution
Original
e-block 1 (SORT) e-block 2 (MATRIX) e-block 3 (SH_PATH_ 1) e-block 4 (SH_PATH_2)
7.4
Summary
In this
Elapsed
0.1 160.5 3.8 >364.8
1.7 165.5 4.8 >422.8
section of PPD.
vary
significantly
increases
in
techniques more
we
execution
for
and
the
The
test
these have
used
in
programs
size.
will
the
approach
for
the
debugging
of the the
in
time
However,
larger
access
overhead
complex
various
execution
that
this
accesses
in
that
balance during
the
up
small
show
is
only to
part
employ
arrays
[6].
With
a
objects,
we
expect
a
we
think
proportionally measurements
feasibility parallel
(less
than
1 Mbyte
we
need
more
between
the
trace
in
all
experiments size
during
debugging.
performance
However,
scale
programs
such
generally
better time
performance
demonstrated
data
in
overhead. are
a
response
programs small
general,
1.24 >117,79
programs.
reduce for
measurements
achieve
the
test
test
to
analysis
sizes
the
from
way
execution-time
to
and
come
increases
the
summarizing
trace
research
general,
0.37 57.76
measurements
that
among
possible
dependence
However,
execution
show
time
One
succinctly
Execution-time cases).
performance
(O to 86 percent)
loops.
in
provided
measurements
sophisticated
reduction
In
have
The
in the
arrays
0.1 10.5
size
(Mbytes)
of Measurements
parts
of