Sep 23, 2008 - Donald V. Helmberger1, Arthur J. Rodgers2, Sidao Ni1,3, Shengji Wei1, ..... Bias in the CMT MW's in Central Asia was reported by Patton and.
2008 Monitoring Research Review: Ground-Based Nuclear Explosion Monitoring Technologies
ADVANCED WAVEFORM SIMULATION FOR SEISMIC MONITORING Donald V. Helmberger1, Arthur J. Rodgers2, Sidao Ni1,3, Shengji Wei1, and Jeroen Tromp1 California Institute of Technology1, Lawrence Livermore National Laboratory2, and URS Group, Inc.3 Sponsored by National Nuclear Security Administration Contract No. DE-FC52-06NA273191 and DE-AC52-07NA273442 Proposal No. BAA06-04
ABSTRACT Earthquake source parameters underpin several aspects of nuclear explosion monitoring. Such aspects are: calibration of moment magnitudes (including coda magnitudes) and magnitude and distance amplitude corrections (MDAC); source depths; discrimination by isotropic moment tensor components; and waveform modeling for structure (including waveform tomography). This project seeks to improve methods for and broaden the applicability of estimating source parameters from broadband waveforms using the Cut-and-Paste (CAP) methodology. The CAP method uses a library of Green’s functions for a one-dimensional (1D, depth-varying) seismic velocity model. The method separates the main arrivals of the regional waveform into 5 windows: Pnl (vertical and radial components), Rayleigh (vertical and radial components) and Love (transverse component). Source parameters are estimated by grid search over strike, dip, rake and depth and seismic moment or equivalently moment magnitude, MW, are adjusted to fit the amplitudes. Key to the CAP method is allowing the synthetic seismograms to shift in time relative to the data in order to account for path-propagation errors (delays) in the 1D seismic velocity model used to compute the Green’s functions. The CAP method has been shown to improve estimates of source parameters, especially when delay and amplitude biases are calibrated using high signal-to-noise data from moderate earthquakes, CAP+. In the last year, we have focused on several tasks: (1) Building a High-Quality Catalog of Earthquake Source Parameters for the Middle East and East Asia. In East Asia we computed source parameters using the CAP method for a set of events studied by Herrmann et al., (2006) using a complete waveform technique. Results indicated excellent agreement with the moment magnitudes in the range 3.5–5.5. Below magnitude 3.5, the scatter increases. For events with more than 2–3 observations at different azimuths, we found good agreement of focal mechanisms. Depths were generally consistent, although differences of up to 10 km were found. These results suggest that CAP modeling provides estimates of source parameters at least as reliable as complete waveform modeling techniques. However, East Asia and the Yellow Sea Korean Paraplatform (YSKP) region studied are relatively laterally homogeneous and may not benefit from the CAP method’s flexibility to shift waveform segments to account for path-dependent model errors. A more challenging region to study is the Middle East where strong variations in sedimentary basin, crustal thickness and crustal and mantle seismic velocities greatly impact regional wave propagation. We applied the CAP method to a set of events in and around Iran and found good agreement between estimated focal mechanisms and those reported by the Global Centroid Moment Tensor (CMT) catalog. We found a possible bias in the moment magnitudes that may be due to the thick low-velocity crust in the Iranian Plateau area. (2) Testing Methods on a Lifetime Regional Data Set. In particular, the recent February 21, 2008, Nevada Event and Aftershock Sequence occurred in the middle of USArray, producing over a thousand records per event. The tectonic setting is quite similar to the Central Iran area and thus provides an excellent testbed for CAP+ at ranges out to 10°, including extensive observations of crustal thinning and thickening and various Pnl complexities. Broadband modeling in 1D, 2D, and 3D will be presented. (3) Testing Shallow Crustal Structure and Sparse Network Source Inversions for Southern California. We conducted a detailed test of a recently developed technique, CAPloc, in recovering source parameters including location and depth based on tomographic maps. We tested two-station solutions against 160 well-determined events, which worked well except for paths crossing deep basins and along mountain ridges.
408
Form Approved OMB No. 0704-0188
Report Documentation Page
Public reporting burden for the collection of information is estimated to average 1 hour per response, including the time for reviewing instructions, searching existing data sources, gathering and maintaining the data needed, and completing and reviewing the collection of information. Send comments regarding this burden estimate or any other aspect of this collection of information, including suggestions for reducing this burden, to Washington Headquarters Services, Directorate for Information Operations and Reports, 1215 Jefferson Davis Highway, Suite 1204, Arlington VA 22202-4302. Respondents should be aware that notwithstanding any other provision of law, no person shall be subject to a penalty for failing to comply with a collection of information if it does not display a currently valid OMB control number.
1. REPORT DATE
3. DATES COVERED 2. REPORT TYPE
SEP 2008
00-00-2008 to 00-00-2008
4. TITLE AND SUBTITLE
5a. CONTRACT NUMBER
Advanced Waveform Simulation for Seismic Monitoring
5b. GRANT NUMBER 5c. PROGRAM ELEMENT NUMBER
6. AUTHOR(S)
5d. PROJECT NUMBER 5e. TASK NUMBER 5f. WORK UNIT NUMBER
7. PERFORMING ORGANIZATION NAME(S) AND ADDRESS(ES)
8. PERFORMING ORGANIZATION REPORT NUMBER
Lawrence Livermore National Laboratory,PO Box 808,Livermore,CA,94551-0808 9. SPONSORING/MONITORING AGENCY NAME(S) AND ADDRESS(ES)
10. SPONSOR/MONITOR’S ACRONYM(S) 11. SPONSOR/MONITOR’S REPORT NUMBER(S)
12. DISTRIBUTION/AVAILABILITY STATEMENT
Approved for public release; distribution unlimited 13. SUPPLEMENTARY NOTES
Proceedings of the 30th Monitoring Research Review: Ground-Based Nuclear Explosion Monitoring Technologies, 23-25 Sep 2008, Portsmouth, VA sponsored by the National Nuclear Security Administration (NNSA) and the Air Force Research Laboratory (AFRL) 14. ABSTRACT
see report 15. SUBJECT TERMS 16. SECURITY CLASSIFICATION OF: a. REPORT
b. ABSTRACT
c. THIS PAGE
unclassified
unclassified
unclassified
17. LIMITATION OF ABSTRACT
18. NUMBER OF PAGES
Same as Report (SAR)
11
19a. NAME OF RESPONSIBLE PERSON
Standard Form 298 (Rev. 8-98) Prescribed by ANSI Std Z39-18
2008 Monitoring Research Review: Ground-Based Nuclear Explosion Monitoring Technologies
OBJECTIVES The objective of this study is to advance estimation of event source parameters using waveform modeling techniques. Principally we are applying the CAP methodology to regions of interest such as East Asia and the Middle East and evaluating the reliability of the method with real data, such as dense high-quality recordings from US Array, and synthetic data computed with 3D models. Time domain waveform modeling is a proven method for estimating seismic moment (and moment magnitude, MW), focal mechanisms and depths and thus supports several aspect of nuclear explosion monitoring. RESEARCH ACCOMPLISHED Introduction Extraordinary amounts of seismic recordings are presently being produced by the many arms of Earthscope and the world community. These data are being used both in traditional event-station analysis as well as station-to-station ambient noise measurements to generate short-period spectral models. The latter methods produce upper crustal shear-velocity models which can be related directly to short-period source studies such as the CAP method. The possibility of locating small events using sparse but entire 3-component records is becoming increasingly attractive where these various methodologies are combined. We are addressing such a synergy with a special study of the best recorded regional event to date (Wells event) and in Southern California, where over 250 events have been studied with the CAP method. Some important issues are (1) How reliable is the CAP methodology in retrieving source information at larger ranges in complex tectonic regions, western U. S., Iran, etc., and how do these source parameters compare with other methods? and (2) Can we now determine self-consistent source parameters at all ranges by developing better 3D models and/or special path calibration? In this short presentation, we will first discuss the Nevada event and then progress on modeling the Iranian events. Regional Analysis of the Wells Events (Nevada) This sequence of events was extremely well recorded by the USArray (Figure 1) and produced an extraordinary set of crustal guided waves. Here, we examine the three-component data in terms of how well existing models perform in predicting the various regional phases, Rayleigh waves, Love waves, and Pnl waves. Previous events from this Basin-and-Range region recorded in southern California have been studied by Zhao and Helmberger (1996) and a 1D model produced by a joint-inversion of minimizing timing-delays and waveform fits, Song et al. (1996). Since this path is essentially the same as theirs to the present TriNet, we can expect good results as demonstrated below. Earthscope studies have greatly added 3D detail by using various analyses based on tomographic methods and noise-generated models. An example of a 2D cross-section along a particularly interesting azimuth is presented in Figure 1b, after Lin et al. (2008). They find relatively strong variation in the main crustal layer of up to 10%. As an introduction to the CAP method, Zhu and Helmberger (1996), we conducted a test against synthetic data. We generated synthetics from four models as displayed with 5% and 10% variation in velocities. These synthetics (now data) are then fit by the CAP method assuming an averaged 1D model where the Pnl are allowed to shift relative to the surface waves. These shifts simply correct for the timing issue. Note that the amplitudes display some disagreement caused by the receiver functions. We recover the mechanisms just fine with this shifting method. This method is applied to the Nevada data, where we perform the inversion as a function of range: 0 to 100 km, 100 to 200 km, etc. Note the stability of the inversion from 100 and beyond where the three fault parameters strike, dip, slip and Mw vary only a few percent, see Figure 2. Some results from the analyses of aftershocks is presented in Figure 3 along with preliminary results from inverting teleseismic waveforms for directivity effects of the main event by applying a wavelet inversion procedure, Ji et al. (2002). A more detailed picture can be constructed by calibrating the (.5–2s) periods for amplitude amplification factors, Tan and Helmberger (2007, 2008), and using the CAP+ procedures. We used the solution from Figure 2 to predict the various phases at all stations in the array. Both the 10s Love waves and Rayleigh waves remained useful out to 11° although crossing basins produced some multi-pathing. In Figure 4, we display the delays along various paths in percentage of travel-time variation and simple mapping contours. Note
409
2008 Monitoring Research Review: Ground-Based Nuclear Explosion Monitoring Technologies
that many of the well-known geological features appear, i.e., Mooney et al. (2005). The delay map for the Rayleigh waves can be directly related to the velocity variation in the seismogenic zone (mid-crust), (Tan and Helmberger, 2008). Our results indicate slow-zones beneath the California-Nevada-Oregon corner and northern Utah-Colorado edge, and fast-zones to the northwest and southwest. These same features are apparent in noise-modeling, Lin et al. (2008). Thus, it appears that these delays can be predicted. The simplest profile of Pnl’s (Figure 5) occurred along the profile to Southern California, and the most interesting towards Washington. The apparent waveform periodicity of about 15s (southern profile) is caused by crustal multiples trapped between the surface and the Moho, see Helmberger (1983). Paths to the north have enhanced Pn (becoming P) caused by high-velocity fine structure at shallow upper mantle depths, Helmberger (1973). To explain these interesting features, we have initiated numerical runs on existing models such as presented in Figure 1b. Some preliminary runs using 2D (finite-difference [FD], Helmberger and Vidale, 1988) and 3D (spectral-element [SEM], Komatitsch and Tromp, 1999) did not produce fits as good as presented in Figure 2. Part of the problem is that these models do not contain the shallow surface layer which controls the waveform surface wave shapes at these periods. There are, also, numerical issues involving element-sizes and grid-dispersion. We have conducted some 2D code testing against WK for these particular distances and frequencies, Figure 6. Although there are some amplitude differences at small ranges, the synthetics at larger distances look very good. Earthquake Source Parameters in East Asia and the Middle East As an initial test of the CAP methodology, we computed source parameters for a set of earthquakes in East Asia studied by Herrmann et al. (2007). Green’s functions were computed using the same velocity model (mdj2). Results (Figure 7a) indicated that moment magnitudes, MW, agree very well above about 3.5, while depths are more scattered with differences of up to 10 km. Focal mechanisms showed good agreement when 2-3 stations with good azimuthal coverage were available, but large differences were seen when the azimuthal coverage was poor or the signal-to-noise was low (such as for small events). Applying 1D waveform modeling techniques to the Middle East is more challenging due to the great variability of sedimentary structure, crustal thickness and seismic velocity heterogeneity. We computed Green’s functions for an average model of the region and estimated source parameters for a set of 17 earthquakes with Global CMT solutions, all with MW greater than about 4.5. These events were widely distributed throughout Iran and the mechanisms showed good agreement with the CMT double-couple solutions (Figure 7c). Comparison of the MW and depths from both methods is shown in Figure 7b. We found a bias in the MW’s with the CAP method consistently resulting in higher values. This could be due to the use of a more realistic regional velocity model with lower average seismic velocity and thicker crust. Bias in the CMT MW’s in Central Asia was reported by Patton and Randall (2002). They found a bias of 0.16 in MW. We found a bias of twice as much; however this is sensitive to the seismic velocities at the event depth. A higher velocity would result in a smaller bias. Further work will be done to find an optimal average model for the entire region or sub-regions. CONCLUSIONS AND RECOMMENDATIONS Cut-and Paste modeling for double-couple mechanisms, depth, and moment proves effective even in complex structures, although some bias in moment is still not resolved for the Iran area because of instrument troubles. There also seems to be a bias in depth estimates where CAP usually produces shallower focal depths. The latter estimates are controlled by using the body-wave depth phases included in the Pnl inversions. Current 3D models for the western United States and the Middle East display great variability and roughly predict regional delays in short-period surface waves. However, these models need to be tested and refined to improve source inversion for small events, especially at shorter periods.
410
2008 Monitoring Research Review: Ground-Based Nuclear Explosion Monitoring Technologies
ACKNOWLEDGEMENTS The facilities of the Incorporated Research Institutions for Seismology (IRIS) Data Management System (DMS), and specifically the IRIS Data Management Center (DMC), were used for access to waveform and metadata required in this study. The IRIS DMS is funded through the National Science Foundation and specifically the GEO Directorate through the Instrumentation and Facilities Program of the National Science Foundation under Cooperative Agreement EAR-0552316. We also thank Bill Walter for velocity model (mdj2) information. REFERENCES Ji, Chen, D. J. Wald, and D. V. Helmberger (2002). Source description of the 1999 Hector Mine, California earthquake. I. Wavelet domain inversion theory and resolution analysis, Bull. Seismol. Soc. Am. 92: 1192–1207. Helmberger, Donald V. Helmberger (1973). On the structure of the low velocity zone, Geophys. J. R. astr. Soc. 34; 251–263. Helmberger, D. V. (1983). Theory and application of synthetic seismograms, in Earthquakes: Observation, Theory and Interpretation, pp. 173–222, ed. Kanamori, H., Soc. Italiana di Fisica, Bologna, Italy. Helmberger, Donald V. and John E. Vidale (1988). Modeling strong motions produced by earthquakes with two-dimensional numerical codes, Bull. Seismol. Soc. Am. 78; No. 1, 109–121. Helmberger, D. V., D. Dreger, R. Stead, and H. Kanamori (1993). Impact of broadband seismology on the understanding of strong motions, Bull. Seismol. Soc. Am. 83: 830–850. Herrmann, R., W. Walter, and M. Pasyanos (2007). Seismic Source and Path Calibration in the Korean Peninsula, Yellow Sea, and Northeast China, in Proceedings of the 29th Monitoring Research Review: Ground-Based Nuclear Explosion Monitoring Technologies, LA-UR-07-5613, Vol. 1, pp. 592–601. Herrmann, R., Y. Jeon, H. Yoo, K. Cho, W. Walter, and M. Pasyanos (2006). Seismic source and path calibration in the Korean Peninsula, Yellow Sea, and Northeast China, in Proceedings of the 28th Seismic Research Review: Ground-Based Nuclear Explosion Monitoring Technologies, LA-UR-06-5471, Vol. 1, pp. 60–70. Komatitsch, D. and J. Tromp (1999). Introduction to the spectral-element method for 3D seismic wave propagation, Geophys. J. Int. 139: 806–822. Lin, F., M.P. Moschetti, and M.H. Ritzwoller (2008). Surface wave tomography of the western United States from ambient seismic noise: Rayleigh and Love wave phase velocity maps, Geophys. J. Int., in press. Mooney, Walter D., V. V. Rao, P. R. Reddy, G. S. Chulick, and S. T. Detweiler (2005). Comparison of the deep crustal structure and seismicity of North America with the Indian subcontinent, Current Science 88: No. 10, pp. 1639. Ni, Sidao, A. Pitarka, and D. V. Helmberger (2008). Short-period synthetics for 3D models: Numerical vs. Analytical, Seismological Res. Lett. 79: No. 2, p.298. Pasyanos, M.E., W.R. Walter, M.P. Flanagan, P. Goldstein and J. Bhattacharya (2004). Building and testing an a priori geophysical model for Western Eurasia and North Africa, Pure Appl, Geophys. 161: 235–281. Patton, H. and G. Randall (2002). On the causes of biased estimates of seismic moment for earthquakes in central Asia, J. Geophys. Res. 107: B11, 2302, doi:10.1029/2001JB000351. Song, Xi J., D. V. Helmberger, and L. Zhao (1996). Broad-band modeling of regional seismograms: the Basin and Range crustal structure, Geophys. J. Int. 125: 15–29. Sun, Daoyuan, D. V. Helmberger, S. Wei, and L. Alisic (2008). MULTI-PATH DETECTORS I and II (Poster 8081), EarthScope IRIS Annual Meeting/Workshop, Portland, OR, June 3–10, 2008. Tan, Ying and D. V. Helmberger (2007). A New Method for Determining Small Earthquake Source Parameters Using Short-Period P Waves, Bull. Seismol. Soc. Am., 97, No. 4, 1176–1195. Zhao, L. S. and D. V. Helmberger (1996). Regional moments, energy levels, and a new discriminant, Pure appl. Geophys. Zhu, Lupei and D. V. Helmberger (1996). Advancement in source estimation techniques using broadband regional seismograms, Bull. Seismol. Soc. Am. 86: 1634–1641.
411
2008 Monitoring Research Review: Ground-Based Nuclear Explosion Monitoring Technologies
1a
1b
1d
1c
1e
Figure 1. (a) Display of USArray stations. Only the stations less than 5° are displayed here arranged in circles; 6 stations within 100km, 18 between 100 and 200 km, 32, 43, 87, etc. (b) A 2D velocity section (after Lin et al., 2008), starting from the Nevada Event source position with azimuth of 315°. (c) Upper four models are used to generate synthetic data and then the average model (lower one) is used to recover source mechanism. (d) CAP inversion using the average model. The length of Pnl traces is 35s and surface waves 70s, respectively. The dots on the focal plot indicates the sampling of mechanism. The fits are good and trial mechanism recovered. (e) Depth-mechanism-misfit indicates that the depth and mechanism are well-resolved.
412
2008 Monitoring Research Review: Ground-Based Nuclear Explosion Monitoring Technologies
2a
2b
Figure 2. According to the epicenter distance, data within five degrees are sorted into five groups. (a) Figure 2a shows 0 to 100km, etc. The “Cut and Paste” (CAP) modeling of Pnl and Surface waves have been done for each group of the data for the main Nevada Event. The name of the station is at the left of each seismogram, the number below the station name is the epicenter distance in kilometer, and above is the azimuth. The numbers on the lower left side of the seismograms are the time shifts(upper) and crosscorrelation coefficient in percent (lower). Positive time shifts mean that the synthetics have been shifted to the right. Pnl waves are filtered with bandpass (0.02~0.2Hz) and Surface waves are filtered with (0.02~0.1Hz). Only representative recordings have been included at the larger distances although all the data is used in the inversion. This earthquake features a mostly dip-slip mechanism (normal). The focal depth is estimated to be around 9km. Note the stability of the inversion where three fault parameters, strike, dip, slip and Mw vary only a few percent. The delays can be used to create a tomography image, Tan et al. (2008), discussed later. Figure 2b displays the corresponding depth resolutions. Since Pnl is included in the inversion, CAP has a good constraint on depth. The velocity model is from the Song et al. (1996) paper, featuring a 34km deep Moho in the Nevada area.
413
2008 Monitoring Research Review: Ground-Based Nuclear Explosion Monitoring Technologies
3a
3b
3d
3c
3e
Figure 3. (a) A preliminary distributed slip inversion for the main event. Slip contours (black) and slip model contours plotted for each 2.5 seconds. (b) Comparison between synthetic and data at teleseismic distance. The number on the left is the data amplitude in microns. Synthetic and data are shown with absolute amplitudes. Values on the right are azimuth(upper) and distance(lower). The rupture velocity is between 2~2.5km/s. Such inversions can be greatly improved by adding stations corrections, Ni et al. (2008) and regional data by including the CAP+ procedure. (c) The source mechanism of 7 aftershocks have been modeled. The waveform fits are given for two indicating some changes in strike. Including higher frequency in Pnl(up to 3Hz) still produces excellent fits and will be used in detailed inversions of the main event. Refer to Figure 2 for definition of numbers. (d) Depth resolutions corresponding to (c). (e) Aftershocks with their positions (NEIC). Only events with magnitude larger than 3.0 are shown.
414
2008 Monitoring Research Review: Ground-Based Nuclear Explosion Monitoring Technologies
4a
4c
4b
4d
Figure 4. Relative time shifts of surface waves between synthetic and data can used in locating events (CAPloc, Tan et al.(2006)) and are plotted in 4a and 4b. These shifts can be normalized by travel times and used to contour relative velocities, 4c and 4d.
415
2008 Monitoring Research Review: Ground-Based Nuclear Explosion Monitoring Technologies
5a
5c
5b Figure 5. (a) Stations along specific azimuths(to the northwest and southwest) and epicenter distance. (b) Record-section of Pnl portion of data and 1D synthetic in northwest direction. Data is in black and synthetic of 1D model in blue. The number on the right of each seismogram is peak amplitude in centimeter. (c) Record-section of Pnl portion of data and 1D synthetic in the southwest direction. Many sections compare quite well out to about 900km, event with this simple model of a uniform mantle. The most interesting profile is displayed along the sector 290~330 degrees. In particular, note that the beginning portions of the Pnl wave train(H04A, G04A, etc.) are indeed Pn-like while some stations (COR, TAKO, F03A, etc.) are P-like (impulse) indicating significant mantle structure. These 3D effects are presently being investigated where the same set of stations display interesting multipathing of teleseismic signals (Sun et al., 2008).
416
2008 Monitoring Research Review: Ground-Based Nuclear Explosion Monitoring Technologies
6a
6c
6b
Figure 6. Comparison of synthetics (FD vs. FK). (a) Vp model for validated calculation. (b) Synthetic seismograms comparison between FK (red) and 2D FD (black). Only Pnl-portion is plotted. The number on the right of each seismogram is the peak amplitude in centimeter. A highpass filter with corner frequency of 0.025Hz is applied to both synthetics. (c) Surface wave comparison between FK and 2D FD. The number on the right of each seismogram is peak amplitude in centimeter. There two methods show high consistency up to distances beyond 1000km with a grid-size of 250m.
417
2008 Monitoring Research Review: Ground-Based Nuclear Explosion Monitoring Technologies
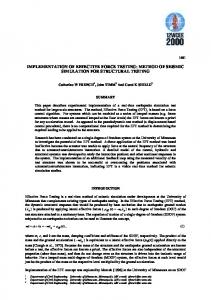
Figure 7. Over 20 events distributed throughout the Korean Peninsula were analyzed with the CAP code both at local and regional distances (10 deg). Several 1D models were used but the most successful proved to be mdj2 (Bill Walter). The results with comparison with the Herrmann and Walter Catalog are given in Figure 7a. The results for the Middle East are given in Figures 7b and 7c and compared to the CMT solutions. The 1D model is an average of three provinces (Central Iran, Turkey-Iran, Arabian Platform) taken from the 3D model WENA (Pasyanos et al, 2004).
418