8th Asian Rock Mechanics Symposium
ARMS8 14-16 October 2014, Sapporo, Japan
Continuous Monitoring of Seismic Waveform Changes during Several Days at the Green Tuff Area in Japan Using a Seismic Vibrator J. Kasaharaab*, R. Kubotaa, Y. Kanaia, O. Tazawaa, O. Fujimotoa, E. Nishiyamaa, A. Kamimuraa, K. Murasea, S. Noguchia, T. Ohmuraa and Y. Hasadac a
Kawasaki Geological Engineering Co., Ltd., Japan Tokyo University of Marine Science and Technology c Daiwa Exploration and Consulting Co. Ltd *
[email protected]
b
Abstract In order to estimate the physical property changes in the subsurface, the time-lapse measurement is quite useful for various cases such as CCS (Carbon Capture and Sequestration) zone, shale gas exploration, oil production, EOR (Enhanced Oil Recovery) and rock mines. We carried out the time-lapse experiments in some weeks from August in 2013 to February 2014. In this study, we used an improved conventional electromagnetic vibrator in the green tuff mining area with 3 km in EW x 5.5 km NS in Japan. We obtained Vp and Vs structure down to 200 m depth using VSP. The comparison of seismic records by walkaway and fixed source at the source B indicates large surface wave arrivals at surface, but borehole seismometers do not indicate distinct surface wave arrivals. We calculated transfer functions from the fixed source at A or B to all 126 seismic stations buried at 30 m and two borehole seismometers at 70 m and 200 m. The temporal changes in the original transfer functions were not distinct. If we look the 12 hours waveforms, it is difficult to find the change of those with time. If we calculate residuals waveforms from the first day, we can clearly identify the change of waveforms with time. Very large temporal change is identified at F11 station and this waveform change travel with 300 m/s possibly due to surface wave origin or sound wave in air. Other temporal changes are identified. The transfer functions every hour during December show large waveform changes even in 200 m deep borehole seismometer. The average velocity for this phase is 250 m/s and the temporal change is distinct during the midnight of observation suggesting possibly caused by frozen of near surface layer. Keywords: Time lapse, Near surface effect, Transfer function, Residual transfer function, Green function
1. Introduction In order to monitor the physical processes along the plate boundaries of subduction zones, Kumazawa et al., (2000) and Kunitomo and Kumazawa (2004) had developed a highly stable seismic source called an ACROSS (Accurately Controlled and Routinely Operated Signal System) for several years (Kasahara et al., 2010). We have applied this system to a smaller scale, possibly for monitoring in CCS and EOR. During past several years, we carried out simulation and field studies for this application (Hasada et al., 2011, Kasahara et al., 2010a, b; 2011a, b; 2013). After 2012, we also have carried out the time-lapse experiment using an ACROSS source at the water pumping area called Al Wasse in the Kingdom of Saudi Arabia. In this paper, we report the result of field experiments at the green tuff region in Japan by use of improved conventional electromagnetic seismic vibrator. We drilled into the green tuff layers down to 200 m deep and obtained cores for the entire depth. Then we installed 3-component borehole seismometers at the depths of 70 m and 200 m. Using these borehole seismometers, we carried out 0-offset VSP and a walkaway VSP to obtain the shallow structure of the test field down to 200 m. After the drilling and VSP experiments, we carried out time-lapse experiments during a few days to a week-long from August in 2013 to February 2014. 2. Field experiments and data processing Continuous Monitoring of Seismic Waveform Changes during Several Days at the Green Tuff Area in Japan Using a Seismic Vibrator J. Kasahara, R. Kubota, Y. Kanai, O. Tazawa, O. Fujimoto, E. Nishiyama, A. Kamimura, K. Murase, S. Noguchi, T. Ohmura, Y. Hasada
1615
8th Asian Rock Mechanics Symposium
ARMS8 14-16 October 2014, Sapporo, Japan
2.1 Modification of electromagnetic vibrator In order to do the time-lapse experiment, we improved the conventional electromagnetic seismic vibrator to obtain more accurate source signatures during the operation. We modified the control system of the vibrator by use of the accurate GPS-base time base (Kubota et al., 2014) (Fig. 1). We used the sweep method with one sweep sequence from 10 to 50 Hz during 100 seconds with 5-second rest. One hour sweep sequence comprises of 34 sweeps. The amplitude spectra of source and noise for feedback operation are shown in Fig. 2. For the VSP surveys we used 7 seconds sweep from 20 to 180 Hz.
Fig. 1. Improved electromagnetic vibrator used in this time-lapse experiment (Kubota et al., 2014).
Fig. 2. Source spectra with noise spectra of system. From top to bottom: reaction mass, baseplate and drive signal (Kubota et al., 2014). 2.2. Field experiment The test site is in green tuff mining area with 3 km in EW x 5.5 km in NS in north eastern part of Japan (Fig. 3). The locations of sources and geophones are shown in this figure. We carried out 0-offset and walkaway VSP experiments and time-lapse experiments from August 2013 to February 2014. Before the VSP and the time-lapse experiments, we drilled into the green tuff layers down to 200 m and placed 3-component 4.5 Hz seismometers at the depths of 70 m and 200 m. We obtained whole cores down to 200 m deep. The signals from seismometers were digitized at each location by 24 bit A/D with 1 kHz sampling and telemeters to the data center. We also recorded the same signals of
1616
Continuous Monitoring of Seismic Waveform Changes during Several Days at the Green Tuff Area in Japan Using a Seismic Vibrator J. Kasahara, R. Kubota, Y. Kanai, O. Tazawa, O. Fujimoto, E. Nishiyama, A. Kamimura, K. Murase, S. Noguchi, T. Ohmura, Y. Hasada
8th Asian Rock Mechanics Symposium
ARMS8 14-16 October 2014, Sapporo, Japan
borehole seismometers and nearby seismometers to the source by portable data loggers. Digitizations of whole data were controlled by GPS time base.
Fig. 3. Seismic array used in this experiment (a part). The source at A and B was used in this experiment and borehole geophones KOM1 and KOM2 were located near the source A. 2.2.1. 0-offset VSP and walkaway VSP experiment In advance to the time-lapse experiment, we carried out a 0-offset VSP and a walkaway VSP. The sweep operation for the VSP was from 20 to 180 Hz during 7 seconds. The location of the borehole is KOM1 (or KOM2) (Fig. 3). The source location of the 0-offset VSP was at source A. The seismic signals were recorded by 3-component geophones in the borehole. The walkaway survey was carried out along the road from source A. The length of walkaway was 430 m. Eight sweeps were repeated at every 10 m locations. 2.2.2. Time-lapse experiments After VSP experiments, we carried out the time-lapse experiments. There were four time-lapse experiments, but the length of each experiment were quite different. The frequency band for the time-lapse experiment was different from the VSP. We used the frequency sweep from 10 to 50 Hz during 100 seconds and repeated 34 times in an hour. -First time-lapse experiment: The first test was during night time of 8 PM and 8 AM between August 12 and 19. We did the continuous operation for each day by non-feedback source control mode. Source location was at source B -Second time-lapse experiment: The second test in October 17 and 18 was very short. The source location was at source A (close to borehole). In this test, we compared the feedback and non-feedback source control modes. -Third time-lapse experiment: The third one was carried out during night time of 8 PM and 8 AM between December 15 and 19. The source location was at source A (just above the borehole). The outside temperature during night time of December 15 and 16 dropped to lower than the freezing point. -Fourth time-lapse experiment: The fourth test was only four hours in February 06, 2014. The objective was to confirm the feedback source control mode. The source location was at source A (close to borehole).
Continuous Monitoring of Seismic Waveform Changes during Several Days at the Green Tuff Area in Japan Using a Seismic Vibrator J. Kasahara, R. Kubota, Y. Kanai, O. Tazawa, O. Fujimoto, E. Nishiyama, A. Kamimura, K. Murase, S. Noguchi, T. Ohmura, Y. Hasada
1617
8th Asian Rock Mechanics Symposium
ARMS8 14-16 October 2014, Sapporo, Japan
In all tests, we used 126 vertical geophones buried at the depth of 30 m in the tuff layer (Fig 3). In addition, we used three-component borehole geophones at the depths of 70 m and 200 m. 2.3 Processing of data The method of processing was similar to the ACROSS one (Nagao et al., 2010, Kasahara et al., 2010a). Firstly we carried out Fourier transform of a 210-second observed data to the frequency domain, and stacked 17 sets of 210-second data in frequency domain to obtain one-hour data. We assumed that the source signature was given by the reaction-mass spectrum. The transfer function Hvv was obtained by the vertical particle motion observed by vertical geophone excited by the vertical force. The division of one-hour stacked data by the source spectrum gave the transfer function in frequency domain. We transformed this data to time domain to obtain waveforms. We averaged 12-hours data for each day and also generated residual transfer function by subtraction of a reference transfer function from observed ones at the given station. The hourly averaged transfer functions in December were obtained by one-hour data. 3. Results 3.1 Drilled cores We obtained cores down to 200 m deep (Figure 2). There were some cracks and pores in rocks. The core inspection suggests weathered sedimentary layer above 16 m and very porous green tuff layer below 16 m.
(a) Cores from 20-25 m.
(b) Cores from 99-102 m.
(c) Cores from 198-200 m. Fig. 4. Photos of cores from (a) 20-25 m, (b) 99-102 m and (c) 198-200 m. The rock types do not drastically change along the depth below 16 m.
1618
Continuous Monitoring of Seismic Waveform Changes during Several Days at the Green Tuff Area in Japan Using a Seismic Vibrator J. Kasahara, R. Kubota, Y. Kanai, O. Tazawa, O. Fujimoto, E. Nishiyama, A. Kamimura, K. Murase, S. Noguchi, T. Ohmura, Y. Hasada
8th Asian Rock Mechanics Symposium
ARMS8 14-16 October 2014, Sapporo, Japan
3.2. Results of core inspection and 0-offset VSP The interpretation of 0-offset VSP is shown in Fig. 5. The Vp and Vs of weathered layer above 16 m are very slow. The Vp of green tuff layer below 16 m is ~ 2000 m/s (right in Fig. 5). The maximum Vs is 230 m/s.
Fig. 5. Travel time of Vp (left) and Vs (middle) in ms obtained by 0-offset VSP from 0 to 200 m. (Right) Vp structural model for the calculation of synthetic seismograms using 0-offset VSP data. Numbers in the structural model is depth in meter in right side and Vp m/s in diagram. 3.3. Results of walkaway VSP experiments The results of walkaway VSP and the transfer functions between the source B and borehole (KOM1 or KOM2) are shown in Fig. 6. The origin of distance is the location of the borehole. The source location of the transfer function during the time lapse was the source B. The transfer function between the source B and the borehole is also shown in Fig. 6. The frequency of the walkaway VSP and the transfer function of the time lapse are quite different. Although it is difficult to identify the P first arrivals and S arrivals in the surface seismometer records, we can recognize clear P first arrivals on NS and EW components of 70 m borehole seismometers and vertical and EW components of 200 m borehole seismometers. S phase is not clear for all record, but very large phase arrived after S phase. We calculated synthetic seismograms using the velocity model shown in Fig. 5 assuming 50 Hz 0-phase Ricker wavelet. The results are compared to the observation (Fig.7). The synthetic seismograms at surface show very large surface wave arrivals. The observation of walkaway VSP obtained by surface seismometers indicates large arrivals by surface waves, but there is no apparent surface wave arrivals on records of 70 m and 200 m deep borehole seismometers. The transfer function from source-B vibration between 10 and 50 Hz has clear arrivals for P and S on observed records of 70 m and 200 m deep borehole seismometers.
Continuous Monitoring of Seismic Waveform Changes during Several Days at the Green Tuff Area in Japan Using a Seismic Vibrator J. Kasahara, R. Kubota, Y. Kanai, O. Tazawa, O. Fujimoto, E. Nishiyama, A. Kamimura, K. Murase, S. Noguchi, T. Ohmura, Y. Hasada
1619
8th Asian Rock Mechanics Symposium
ARMS8 14-16 October 2014, Sapporo, Japan
(a) The 0 distance is above the borehole. Receivers were 3-component 2 Hz surface seismometer.
(b) Receivers were 3-component 4.5 Hz 70m borehole seismometers KOM1.
(c) Receivers were 3–component 4.5 Hz 200m borehole seismometers KOM2. Fig. 6. Results of walkaway VSP seismograms and transfer functions of (a) surface seismometer at borehole, (b) 70 m deep borehole and (c) 200 m deep borehole. Red wiggles show the transfer functions from the source B. From left to right are records of vertical, NS and EW components, respectively.
1620
Continuous Monitoring of Seismic Waveform Changes during Several Days at the Green Tuff Area in Japan Using a Seismic Vibrator J. Kasahara, R. Kubota, Y. Kanai, O. Tazawa, O. Fujimoto, E. Nishiyama, A. Kamimura, K. Murase, S. Noguchi, T. Ohmura, Y. Hasada
8th Asian Rock Mechanics Symposium
ARMS8 14-16 October 2014, Sapporo, Japan
(a) The 0 distance is above the borehole. Receivers were 3-component 2 Hz surface seismometer.
(b) Receivers were 3-component 4.5 Hz 70m borehole seismometers KOM1.
(c) Receivers were 3-component 4.5 Hz 200 m borehole seismometers KOM2. Fig. 7. Comparison of walkaway seismograms, transfer function at (a) surface of borehole, (b) 70 m deep borehole, and (c) 200 m deep borehole and synthetic seismograms using model shown in Fig. 5. 3.3. Result of the time-lapse experiments The Hvv transfer functions in 126 stations in time domain obtained on 15 and 18 of August, 2013 are shown in Fig. 8. It is difficult to know the differences by the comparison of two records for three days. Fig. 9a shows details of waveforms each day for a five-day period in 15 stations out of 126 seismometers. The distance of 15 stations are from 11 m to 575 m away from the source. As we see the same results shown in Figs. 8 and 9a, we cannot identify distinct changes for five days in these 15 stations. However, the residual waveforms show the changes of waveforms which occurred at some stations as seen in Fig. 9b. The largest amplitude changes occurred at the station F11 at 451 m offset distance. We also notice smaller amplitude changes at later arrivals in some stations.
Continuous Monitoring of Seismic Waveform Changes during Several Days at the Green Tuff Area in Japan Using a Seismic Vibrator J. Kasahara, R. Kubota, Y. Kanai, O. Tazawa, O. Fujimoto, E. Nishiyama, A. Kamimura, K. Murase, S. Noguchi, T. Ohmura, Y. Hasada
1621
8th Asian Rock Mechanics Symposium
ARMS8 14-16 October 2014, Sapporo, Japan
Fig. 8. Comparison of the source gather Hvv transfer functions of 126 stations among 15 (left), 16 (middle) and 18 (right), in August, 2013. The source location was the source B. The vertical axis is offset distance in kilometer and the horizontal axis is travel time in seconds. There are some noisy traces in August 18.
Fig. 9. (a) 12 hr. averaged transfer functions (Hvv) (15 diagrams in the left side) and (b) residual transfer functions (15 diagrams in right side) for 5 days in 15 stations. The vertical axis is travel time in seconds and the horizontal axis is an elapsed day. Source location was at the source B.
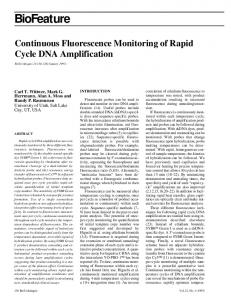
Fig. 10. Time-lapse records of 200 m borehole seismometer and F11 (buried at 30 m deep with 378 m offset distance) from December 14 to 18, 2013 during 8 PM and 8 AM and 8 PM-12 PM of February 6, 2014. Both records are vertical components. The source location was the source A. Each trace is hourly transfer function. Vertical axis is elapsed time (travel time) and horizontal axis is aligned every hour during the night time of each day. The same color shows the same observation group from 8 PM to 8 AM. The circles show portions having most distinct waveform changes.
1622
Continuous Monitoring of Seismic Waveform Changes during Several Days at the Green Tuff Area in Japan Using a Seismic Vibrator J. Kasahara, R. Kubota, Y. Kanai, O. Tazawa, O. Fujimoto, E. Nishiyama, A. Kamimura, K. Murase, S. Noguchi, T. Ohmura, Y. Hasada
8th Asian Rock Mechanics Symposium
ARMS8 14-16 October 2014, Sapporo, Japan
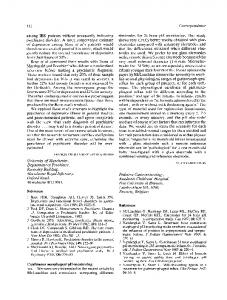
Fig. 10 shows the results for 200 m borehole and F11 vertical seismometers buried at 30 m deep in December. Traces are the transfer functions from the source A (close to the borehole) to the seismometers. The 200 m traces indicate very large temporal change occurred at 0.8 second arrival time. The F11 traces indicate waveform changes at 0.37 seconds and after 0.7 seconds. Because the distance to the borehole geophone is only 200 m, the apparent average speed of the phase at 0.8 second arrival is c.a. 250 m/s. The changes of the arrivals at 0.8 seconds seem to be caused by the outside temperature change. Fig. 11 shows observed Hvv (gray) and residual one (black). The dashed line is the velocity of 300 m/s and the large-amplitude phase appeared at 450 m offset distance and travelled by approximately 300 m/s. This large phase appeared on 16 August, 2013.
Fig. 11. Comparison of residual transfer function (black wiggles) and original transfer functions (gray wiggles). The vertical axis is travel time in seconds and horizontal axis is offset distance in meter. Dashed line is V=300 m/s corresponding to the phase appeared at the station F11 after 16, August, 2013. 4. Discussion The comparison of walkaway records and the transfer function from the source B shows very large surface wave arrivals by surface geophones and small amplitude for surface wave portions by 70 m and 200 m borehole. And transfer functions between the source B and the borehole show clear P and S arrivals. This suggests that the shallow seismometer records were strongly affected by surface waves and borehole records were less influenced by surface waves. The temporal changes were very small on P and S first onsets, but on the later arrivals of P and S were very large. Especially during the night in December we can recognize the distinct waveform changes at very late arrival phases. The average speed of arrivals at 0.8 seconds seen in the 200 m borehole is c.a. 250 m/s and they were strongly affected by the outside temperature change, probably frozen of near surface soils. We observed distinct changes on transfer functions at F11 which is 451 m distance away from the source B. The portion of changes is identified at very slow arrivals. Because we do not see any changes close to the seismic source, it is thought that the cause of the changes is close to the station F11 and/or near surface. The velocity from the traveling is very slow namely 300 m/s, and the velocity may suggest traveling near surface. During the experiment in August, there was no rain and the temperature of the air was more than 30 degrees in Celsius. The cause of change around the station F11 was not clear, and it might be caused by the migration of aquifer at very shallow depth to induce the change of surface wave velocity.
Continuous Monitoring of Seismic Waveform Changes during Several Days at the Green Tuff Area in Japan Using a Seismic Vibrator J. Kasahara, R. Kubota, Y. Kanai, O. Tazawa, O. Fujimoto, E. Nishiyama, A. Kamimura, K. Murase, S. Noguchi, T. Ohmura, Y. Hasada
1623
8th Asian Rock Mechanics Symposium
ARMS8 14-16 October 2014, Sapporo, Japan
5. Conclusions We carried out the time-lapse experiment in the green tuff region with 3 km in EW and 5.5 km in NS in Japan. In this study, we used an improved conventional electromagnetic vibrator as seismic source in the green tuff mining area. We also carried out 0-offset VSP and walkaway VSP to obtain velocity structure in this test field. The comparison of walkaway VSP records and fixed location record at the source B suggests that the 70 m and 200 m borehole seismometers do not show large amplitudes for surface wave origin although the seismometer at surface has very large surface wave arrivals. The transfer functions between the source and receivers were obtained by the division of observed waveforms by source signature in frequency domain. Using the subtraction of waveforms for each day with 12-hour stacked data from the first day, we generated residual waveforms. Although the original transfer functions between the source B and the borehole do not show distinct temporal changes on waveforms, the residual transfer functions indicate distinct change of waveforms for later arrivals for all 126 buried stations and borehole seismometers. The waveform changes of later phase at F11 are extremely large. The waveform change seems to occur near the station F11 and be radiated to other stations. The time lapse during December shows large waveform changes even in 200 m deep borehole seismometer. The average velocity for this phase is 250 m/s and the temporal change is distinct during the midnight of observation suggesting possible cause by frozen of near surface layer. Acknowledgements These works were supported by Japan Cooperation Center, Petroleum (JCCP). The authors express their sincere thanks to officers of JCCP for supporting this project. We also express our thanks Mr. Kato, Ms. Mori, Mr. Ohnuma and Mr. Hasegawa of Kawasaki Geological Engineering Co. Ltd. on their efforts on the project management works. References Hasada, Y., Kasahara. J., and Tsuruga, K., 2011, 3D simulation for time lapse in oil and gas reservoirs and CCS reservoirs using seismic ACROSS technology, Proc. of the 122th SEGJ Conf., 99-102. Kasahara, J., Korneev, V., and Zhdanov, M., 2010a, “Active Geophysical Monitoring”, Handbook of Geophysical Exploration, Seismic Exploration Volume 40, p551, Elsevier Pub. Kasahara, J., Hasada, Y., and Tsuruga, K., 2010b, Seismic imaging of time lapse for CCS and oil and gas reservoirs using ultra-stable seismic source (ACROSS), Proc. of the 123th SEGJ Conf., 74-77. Kasahara, J., Hasada, Y., and Tsuruga, K., 2011a, Imaging of ultra-long term temporal change of reservoir (s) by accurate seismic sources(s) and multi-receivers, in extended abstract of “EAGE workshop on Permanent Reservoir Monitoring (PRM)”, February-March, Trondheim, Norway, 40-44. Kasahara, J., Ito, S., Hasada, Y., Takano, M., Guidi, A., Fujiwara, T., Tsuruga K., and Fujii, N., 2011b, Generation of vertical and horizontal vibrations by a synthetic method using an ultra-stable and continuous seismic source for the time lapse measurements, AGU Fall Meeting Abstract, T43B-2310. Kasahara, J., Ito, S., Fujiwara, T., K., Hasada, Y., Tsuruga, K., Ikuta, R., Fujii, N., Yamaoka, K., Ito, K. and Nishigami, K., 2013, Real time imaging of CO2 storage zone by very accurate stable-long term seismic source, Energy Procedia, 37, 4085-4-92. Kubota, R., Kanai, Y., Uchiyama, A., Tazawa, O., Fujimoto, O., Nishiyama, E., Murase, K., Kamimura, A., Noguchi, S., Ohmura, T. and Kasahara, J., 2014, Development of the Seismic ACROSS using electro-magnetic vibrator, Proc. “2nd KACST-KAUST-JCCP international workshop on Surface and Subsurface 4D Monitoring”, KAUST Feb. 2014. Kunitomo, T., and Kumazawa, M., 2004, Active monitoring of the Earth‘s structure by the seismic ACROSS - Transmitting and receiving technologies of the seismic ACROSS, Proc. 1st International Workshop “Active Monitoring in the Solid Earth Geophysics”, in Mizunami, Japan, S4-04. Kumazawa, M., Kunitomo, T., Yokoyama, Y., Nakajima, T., and Tsuruga, K., ACROSS: Theoretical and technical developments and prospect to future applications, 2000, Technical report, Japan Nuclear Cycle Develop. Inst., 9, 115-129. Nagao, H., Nakajima, H., Kumazawa, M., and Kunitomo, T., 2010, Stacking strategy for acquisition of an ACROSS transfer function in “Kasahara, J. et al., , editors, “Active Geophysical Monitoring”, Handbook of Geophysical Exploration, Seismic Exploration 40, 213-227. Elsevier Pub.
1624
Continuous Monitoring of Seismic Waveform Changes during Several Days at the Green Tuff Area in Japan Using a Seismic Vibrator J. Kasahara, R. Kubota, Y. Kanai, O. Tazawa, O. Fujimoto, E. Nishiyama, A. Kamimura, K. Murase, S. Noguchi, T. Ohmura, Y. Hasada