Study of High Spot Lands in Irrigated Scheme Using Remote Sensing Data and GIS. Case Study: Rahad Irrigated Scheme, Sudan Marwa E. H. Ali1, El-Abbas Doka M.Ali2, Amna A. Hamid3 Faculty of Agricultural Sciences, University of Gezira, Wad Medani, Sudan, 2 Sudan University of Science and Technology, Khartoum North, Sudan, 3 National Center for Research (NCR),Khartoum, Sudan,
[email protected];
[email protected];
[email protected]
1
ABSTRACT The study was carried out in selected sites that cover 1989.8 ha (4735.86 Feddans) in the Rahad Irrigatated Scheme, Gazera State, Sudan. The main objective was to identify the spatial distribution ofHigh Spot Lands that are created by management practices and study their physiognomies at Rahad Scheme using space technologies. Data from Landsat TM and ETM sensors with different spatial resolution (15 and 30m) and temporal resolution (1987, 2000, 2005 and 2013) was utilized to conduct land cover analysis in relation to farming patterns, irrigation system and residential areas. Satellite elevation data from STRM combined with Landsat ETM data and high resolution data from Google Earth were compiled to study the high spots and accumulated soils in relation to the topography of the study area. The GPS was used in the field investigations to delineate the study area and to identify the sites of the high spots and in locating the soil sampling sites. The results of Landsat and DEM analysis showed that a considerable amount of high spots exist within the study area and throughout the northern part of the farmland of the scheme. It was evident that the topography of the land was adequately considered during the initial irrigation system designs in 1987, but consequently little care was given to the levelling of the farming land during different tillage operations. The study concluded that data from Landsat, STRM, ASTER and high resolution data from Google Earth could be used to detect and identify fairly high spot Lands at Farm level and hence contribute to improve management. Keywords: Digital Elevation Model (DEM), High Spot Lands, Space Technologies
1
Introduction
Remote sensing can be defined as the science of collection, processing and interpretation of images and related data, obtained from aircraft and satellites, which record the interaction between matter and electromagnetic radiation [11]. In the Sudan the use of remote sensing technology is a cost effective procedure for surveying natural resources. Starting from 1971 remote sensing has been used in natural resources surveys of specific areas chosen by Food and Agricultural Organization for testing the possible utilization of remote sensing for surveying, mapping, planning and developing natural resources [9]. [7] studied vegetation change in the Sudan using Landsat data and concluded that the desert was then moving southwards with a rate of 5-6 km per year. He attributed this spread of desertification to misuse of land by people. However, [5] showed that there was no systematic desert encroachment and criticized the findings of [7] as misinterpretations resulting from his application of DOI: 10.14738/aivp.55.4150 Publication Date: 30th Oct, 2017 URL: http://dx.doi.org/10.14738/aivp.55.4150
Advances in Image and Video Processing; Volume 5, No. 5, October 2017
the vegetation map of Jackson and Harrison(1958), which depended mainly on the100 mm rainfall isohyets. [5]; [6] stated that vegetation recovered during the rainy season. Remote sensing, in conjunction with parallel development in Geographical Information Systems (GIS), Global Positioning System (GPS) and other ground data collection systems, now provide substantial amount of information about the land, to improve the understanding of the natural systems and offered better chances for preserving it [1]. GIS is needed for obtaining a more comprehensive view of the remote sensing analysis for a particular area of interest. Therefore, the integration of spatial information has been remarkably favoured by most users of satellite remote sensing. The use of GIS and remote sensing has gained much recognition as environmental resources management tools for data collation and analysis [11]. Remote sensing and GIS are known to be not only powerful, but also cost-effective tools for assessing the spatial distribution and dynamics of land cover [13]; [4]; [14]; [15]; [2]. In recent years, there has been an increasing interest in providing integration tools in the area of remote sensing, GIS and spatial models (Franklin, 2001). Nowadays, GIS is considered to be the nerve center that handles geographic information because it can integrate all source of spatial data (RS, cartography, census data, GPS … etc ([1] This research study provided a practical example on how such advanced technologies could be used to investigate spatial distribution of management practices problems such as High Spot Lands and evaluate their magnitude in order to advise on proper management practices.
2 Materials and Methods 2.1 Materials 2.1.1
The Study Area:
Rahad Agricultural Scheme is located about 276 km South Khartoum, on the eastern bank of the River Rahad (a tributary of the Blue Nile). It is subtended by latitudes 13° 08 N and 14° 05 N and longitudes 33° 06 E and 34° 01 E. The Scheme stretches on a narrow strip from south to north along the east bank of Rahad River for 160 km. Rahad agricultural scheme is located in two states; Gedarif and Gezira with about 40 and 60% as share area in eachststerespectively, (Figure 1). Fieldwork conducted during the seasons 2010/2011 to 2011/2012 in a sample area, which is represented the total study area of the scheme. The study area (Rahad Agricultural Scheme) covered by Landsat (TM) image zone 36 between the following two point’s co-ordinates in Universal Transference Marketer (UTM): 1.
(335053.87E, 142422.91N)
2.
(335123.26E, 142319.02N)
Copyright © Society for Science and Education United Kingdom
41
Marwa E. H. Ali, El-Abbas Doka M.Ali, Amna A. Hamid; Study of High Spot Lands in Irrigated Scheme Using Remote Sensing Data and GIS.Case Study: Rahad Irrigated Scheme, Sudan. Advances in Image and Video Processing, Volume 5 No 5, October (2017); pp: 40-47
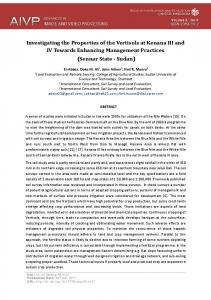
Figure 1: Location of the study Areanorth ofRahad Schemeat Gezira/ Gadarif States, Sudan (on Google satellite map)
2.1.2
Satellite Images
Set of satellite data from Landsat, SRTM, ASTER and Google Earth were used. Four sub images from Landsat covering the selected sites 1989.8 ha (4735.86 fed) were used in this study. Composed of three bands, for four time intervals, 1987 (Thematic Mapper) and 2000, 2005 and 2013 (Enhanced Thematic Mapper plus); the characteristics of these images were listed in Table 1. Table 1: Characteristics of Landsat imageries used in the study
Image 1
Path/ Sensor Band Resolution Row 2.1.3 1-3 1.4 30m 172/50
2 3 4
172/50 172/50 172/50
ETM+ ETM+ ETM+
1-3 1-3 1-3
30m & 15m 30m & 15m 30m & 15m
Date D/M/Y D/M/ 1987
Source: Landsat Satellite images 1987, 2000, 2005 and 2013.
2.1.5
2000 2005 2013
Digital Elevation Models (DEMs)
Several digital elevation models were used during this research. The global products include the NASA Shuttle Radar Topographic Mission (SRTM) produced DEM with spatial resolution of 90 m downloaded from http://srtm.csi.cgiar.org was used; and ASTER GDEM 30 m resolution a product of METI and NASA ; at regional scale a DEM with resolution 10 m and a local DEM with 5 m resolution, both based on topographic maps. For the macro landform classification also DEM with resolution of 200 m was prepared from SRTM DEM.
URL: http://dx.doi.org/10.14738/aivp.55.4150
42
Advances in Image and Video Processing; Volume 5, No. 5, October 2017
2.1.6
Data from Google Earth
Google Earth is the program for viewing anywhere on the planet, allowing you to view high resolution satellite imagery, elevation terrain, road and street labels, and more. High resolution data was obtained from Google Earth in 2014. 2.1.7
ARC Map
Arc Map 10 View (Advanced Spatial Analysis using Raster and Vector Data) was used for analysis and final production. Erdas Imagine 8.5 advance software was also used for image processing and analysis.
2.2 Methods Remote Sensing (RS), Geographical Positioning System (GPS) and Geographical Information System (GIS) techniques were applied effectively in this research study. Remote sensing data consisting of images from Landsat ETM with different spectral and temporal resolution were utilized to conduct land cover analysis in relation to farming patterns, irrigation distribution and residential areas. Satellite elevation data from STRM combined with Landsat ETM data compiled to study the high spots and accumulated soils in relation to the topography of the study area. The GPS utilized in the field investigation to delineate the study area and to identify the sites of the high spots and accumulated soil. It was also used in locating thesoil sampling sites.
3 Results and Discussion 3.1 Identification of High Spot Soils through Landsat Images Soil accumulation and build up as high spots were interpreted based on Landsat False Color Composite (FCC) (172/50), TM (172/50) for the years 1987, 2013.Digital elevation data (DEM) from SRTM combined with Landsat images 2007 was also used to study the topography of the study area. From this interpretation, it was possible to indicate that a considerable amount of high spots exist within the study area and throughout the northern part of the farmland of the scheme. From the layout of the irrigation canals, it seems that the topography of the land was adequately considered during the initial irrigation system designs, but consequently little care was given to the levelling of the farming land during different tillage operations. It appears that the apparent relatively high spots within farming blocks were being avoided and more soil was accumulated on them when leveling the surrounding ground which even worsened the problem of high spots.
3.2 The Use of the Digital Elevation Model (DEM): Topography was identified by a Digital Elevation Model (DEM), which illustrates the elevation of any point on landin a given area at a specific spatial resolution as a digital file. [1] argued that the higher the resolution, the more difficult the evaluation of input data quality and the assessment of the resulting Digital Terrain Model (DTM) area. Experience indicates that the effort is proportional to the square of the inverse value of horizontal resolution. High resolution DTMs are thus more prone to errors. [9] added that visual methods can be very important for the evaluation of spatial data and can balance some weaknesses of statistical methods. They are still under used for at least three reasons. Visual approaches being qualitative are generally more neglected than statistical ones, which are considered more objective. The other two reasons for the lower acceptance of visual methods lie in the insufficient graphical capabilities of computers until recently and in the longer tradition of using statistical methods. Finally, visualization of spatial data has traditionally been part of cartography. Figure (2) shows the study area on Landsat ETM 2007 panchromatic image with 15m spatial resolution. Figure (3) shows Copyright © Society for Science and Education United Kingdom
43
Marwa E. H. Ali, El-Abbas Doka M.Ali, Amna A. Hamid; Study of High Spot Lands in Irrigated Scheme Using Remote Sensing Data and GIS.Case Study: Rahad Irrigated Scheme, Sudan. Advances in Image and Video Processing, Volume 5 No 5, October (2017); pp: 40-47
the DEM map of the study area (SRTM 90 m resolution). In this image, lighter patterns reflect lowlying areas at the northern and southern parts of the study area. High ridge on western part appears in dark tone. The Figure (4a) and (4b) show the contour map and its enlargement for the study area. The lines clearly show the low lying and relatively high grounds within the study area. As well, the elevated ridges west of the area are very prominent. This becomes clearer when comparing the enlarged contour map with DEM .The contour map indicated high landforms on western parts of the study area and within the study area; it shows some elevated and lower parts within 1 m differences. Considerable elevation differences are evident in the contour maps. Figure (5) shows the hill shade of the study area; figure (6) shows the hill shade couples with contour lines. All hill shade figures reflect the heights, slope in the study area and surroundings. As seen from hill shade figures the elevated ridges are particularly clear and these maps can used to separate high physiographic grounds (ridges and rock outcrops) from clay plain areas. Figure (7) shows the study area on Google satellite maps with visual interpretation that indicated the presence of higher rocky lands on the western parts of the study area that limited the expansion of the irrigated farming lands westward. As well, runoff water during rainy season from these high grounds might create flooding hazards to the adjacent farmland areas.
Figure 2: The study area on Landsat ETM 2007
(Source: DIU; Personal communications) Figure 4a: Contour Map for the Study Area (1 m intervals -SRTM elevation data)
Figure 3: The Study Area Digital Elevation Model DEM SRTM
Figure 4b: Enlargement of Contour Map for the Study Area (1 m intervals) using SRTM elevation data (Source: DIU; Personal communications)
URL: http://dx.doi.org/10.14738/aivp.55.4150
44
Advances in Image and Video Processing; Volume 5, No. 5, October 2017
(Source: DIU; Personal communications) Figure 5: Study Area Hill Shade Using (SRTM elevation data) demonstrating the topography of the area and surroundings
(Source: DIU; Personal communications) Figure 6: Contour Map Superimposed on Hill Shade Using SRTM elevation data
Figure 7: Visual Interpretation of Google Image showing High Landform Surrounding the Study Area from the West as shown in Hill Shade and Contour of SRTM
4 Conclusion and Recommendations 4.1 Conclusions •
• •
•
The extensive spatial coverage, regular temporal coverage and reasonable cost of satellite imagery provide an opportunity to undertake routine natural resource monitoring. This can then contribute to efficient decision making in natural resource management. This was proved in this study since the use satellite images allow identification of high spot, their distribution and other physiographic features related to them. Remote sensing and GIS are time and cost–effective tools in characterization of land surface features and evaluation of land use land cover changes. GIS provides a great advantage to analyze multi-layers of geospatial and field quantitative data within a specific area like farm fields. The estimation of soil loss in farms and fields is a core capability of GIS. It does not only provide accurate results but also prove to be cost and time effective tool for analysis. The data available for this study was effectively employed for monitoring and mapping the prevailing land conditions in the study area. The hypothesis of this research that the ground observations and remote sensing data could be used to achieve reliable characterization of the high spot and land degradation proved to be correct.
Copyright © Society for Science and Education United Kingdom
45
Marwa E. H. Ali, El-Abbas Doka M.Ali, Amna A. Hamid; Study of High Spot Lands in Irrigated Scheme Using Remote Sensing Data and GIS.Case Study: Rahad Irrigated Scheme, Sudan. Advances in Image and Video Processing, Volume 5 No 5, October (2017); pp: 40-47
4.2 Recommendations: •
•
•
Research efforts are highly needed to combine the newly emerging technologies including the remote sensing, GIS and GPS data with ground observed data to monitor and evaluate the landscape condition in the area especially in farm land areas where land use is expected to inflict some changes. Expand the use of the decision support tools like space technologies (GIS, RS and GPS) to plan for sustainable development and proper land management in the whole area of Rahad scheme. The integrated approach of remote sensing data from different sources Landsat, SRTM, GPS in addition to conventional field survey and GIS analysis could be followed and adopted to improve land management in the entire irrigated sector in Sudan. REFERENCES
[1]
Chuvieco, E. and Huete, A. 2010. Fundamental of satellite remote sensing, Taylor and Francis Group, New York.
[2]
Dewan, A. M. and Yamaguchi, Y. 2009. Land use and land cover change in greater Dhaka, Bangladesh: Using remote sensing to promote sustainable urbanization. Applied Geography, 29 (3): 390-401.
[3]
Franklin, S. E. 2001. Remote sensing for sustainable forest management. Lewis Publishers. Boca Raton.
[4]
Giridhar, M. V. and. Viswanadh, G. K. 2008. Evaluation of watershed parameters using RS and GIS. Earth and Space Conference: Proceedings of the 11th Aerospace Division International Conference on Engineering, Science, Construction, and Operations in Challenging Environments 323.
[5]
Hellden, U (1978).Evaluation of landsat-2 imagery for desertification studies in Northern Kordofan, Sudan Lund University Naturgegrafiska Institution, RapporterOchNotiser Nr 38.
[6]
Helldén, U. 1988. Desertification monitoring: Is the desert encroaching? Desertification control Bulletin 17: 8-12.
[7]
Lampery, H.F (1975). Report on the desert encroachment reconnaissance in northern Sudan, 21 Oct to 10Nov, 1975. UNESCO/UNEP. 16p.
[8]
Podobnikar T. 2005. Production of integrated digital terrain model from multiple datasets of different quality, IJGIS, 19/1, 69–89.
[9]
Podobnikar, Tomaz. 2009. Methods for visual quality assessment of a digital terrain model, S.A.P.I.EN.S [Online], 2.2 | 2009, Online since 29 January 2009, Connection on 10 October 2012. URL :http://sapiens.revues.org/738. Publisher: Institute Veolia Environment
[10]
Rindfuss, R., Entwisle, B., Walsh, S. J., Prasartkul, P., Sawangdee, Y., Crawford, T. W.and Reade, T. 2002. Continuous and discrete: where they have met in Nang Rong,Thailand. In: Walsh, S. J. and Crews-Meyer, K. (eds.). Linking people, place and policy: A GIS science approach, Kluwer Academic Press, Boston.
URL: http://dx.doi.org/10.14738/aivp.55.4150
46
Advances in Image and Video Processing; Volume 5, No. 5, October 2017
[11]
Sabins, Floyd F. 1996. Remote Sensing Principles and Interpretation. 3rd Ed. W. H. Freeman and company New York
[12]
Tottrup, C. and Rasmussen, M. S. 2004. Mapping long-term changes in savannah cropproductivity in Senegal through trend analysis of time series of remote sensing data.Agriculture. Ecosystems and Environment, 103(3): 545-560.
[13]
Wilson, J. P. and Fotheringham S. A. 2008. The hand book of geographic informationscience. Blackwell publishing, Victoria, Australia.
[14]
Zhiliang, C., Xulong, L., Xiaochun, P., Zhencheng, X. and Zhifeng, W. 2008. Land use/cover changes between 1990 and 2000 based on remote sensing and GIS in Pearl River Delta, China. Proceedings of SPIE - The International Society for Optical Engineering, 7144.
Copyright © Society for Science and Education United Kingdom
47