Nov 8, 2017 - of co-authorship networks and how the stability of the blockmodels .... as features indicating lower core stability (for more details, see [8]) (see ...
arXiv:1711.00770v1 [stat.AP] 2 Nov 2017
ADVANCES IN NETWORK CLUSTERING AND BLOCKMODELING
Patrick Doreian University of Pittsburgh
Vladimir Batagelj University of Ljubljana
ˇ Anuska Ferligoj University of Ljubljana
A JOHN WILEY & SONS, INC., PUBLICATION
CHAPTER 14
SCIENTIFIC CO-AUTHORSHIP NETWORKS Marjan Cugmas, Anuska Ferligoj, and Luka Kronegger FDV, University of Ljubljana
14.1
Introduction
Network studies of science offer researchers a great insight into the dynamics of knowledge creation and the social structure of scientific society. The flow of ideas and overall cognitive structure of the scientific community is observed through citations between scientific contributions, usually manifested as patents or papers published in scientific journals. The social structure of this society consists of relationships among scientists. De Haan [10] suggests six operationalized indicators of collaborative relations between scientists: coauthorship; shared editorship of publications; shared supervision of PhD projects; writing a research proposal together; participation in formal research programs; and shared organization of scientific conferences. Due to accessibility and the ease of acquiring data through bibliographic databases, most scientific collaboration analyses are performed on co-authorship data, which play a particularly important role in research into the collaborative social structure of science. Coauthorship networks are personal networks in which the vertices represent authors, and two authors are connected by a tie if they co-authored one or more publications. These ties are necessarily symmetric. The study of community structures through scientific co-authorship is especially important because scientific (sub)disciplines can often display local properties that differ greatly from the properties of the scientific network as a whole. Co-authorship Advances in Network Clustering and Blockmodeling, November 8, 2017 23 : 50. c 2017 John Wiley & Sons, Inc. By P. Doreian, V. Batagelj, A. Ferligoj Copyright
251
252
SCIENTIFIC CO-AUTHORSHIP NETWORKS
data have some flaws. The wide pallet of relationships among scientists do not result in common publications [23; 33; 28]. Laudel [28] reports that about half of scientific collaborations are invisible in formal communication channels because they do not lead to either co-authored publications or formal acknowledgments in scientific texts. On the other hand, we also know that co-authorship sometimes represents false positive relations arising from resource-related issues [35]. Despite this, co-authorship data compromise between quality and cost for an indicator of scientific collaboration. The study of co-authorship networks has been influenced by the development of quantitative methodological approaches [30]. The choice of relatively simple descriptive statistics, deterministic modeling, stochastic agent-based modeling of network dynamics, or any other method is based on a particular study’s objective. In general, which of the many approaches to studying co-authorship networks is chosen depends on the objective of the study under consideration. The most fundamental approaches to studying co-authorship networks relate to co-authorship networks’ basic descriptive statistics, such as measuring the number and size of components in the network along with the degree and different measures of closeness and centrality. Some researchers used an Exponential Random Graph Modeling to test a small world structure [25] in co-authorship networks while some other also proposed studying transformed co-authorship networks where the nodes are articles (instead of researchers) and links between two articles exist if they have one or several of the same authors [17]. In the current chapter, we focus on blockmodeling co-authorship networks as a deterministic approach to network analysis. There are relatively few applications of blockmodeling to co-authorship networks. This may be due to the method’s limitations regarding the size of analyzed networks. One of the earliest applications can be found in [14], who compared the results of blockmodeling (clustering of relational data) of a co-authorship network of Slovenian sociologists and the results of clustering with a relational constraint (clustering of attribute and relational data) on the same network according to researchers’ publication performance. As expected, the methods produced different results, indicating their use should depend on the research problem under study. The unexpected result of their presented analysis was a core-periphery structure, with seven cores and a periphery, obtained when blockmodeling the co-authorship network. Further investigation of the multicore-periphery structure was presented in [24] where the authors analyzed the development of a network structure over time. In their analysis of the co-authorship networks of four scientific disciplines (physics, mathematics, biotechnology and sociology) measured in four consecutive 5-year time spans, they observed a multicore-periphery structure was present from early on in the development of each scientific discipline. They also found that, although the number of cores increases with the growth of a discipline, the cores’ sizes did not change. The structure’s description as constituting multiple cores and a periphery was extended with two elements: a weakly connected semi-periphery, a completely empty periphery and bridging cores, describing clusters of authors connecting two or more cores from the central part of the network. The authors described four levels of network complexity in the network structure’s evolution through time: 1. Simple core-periphery form: Simple cores, semi-periphery, periphery 2. Weakly consolidated core-periphery form: Simple cores, bridging individuals, semiperiphery, periphery
METHODS
253
3. Consolidated core-periphery form: Simple cores, bridging cores, semi-periphery, periphery 4. Strongly consolidated core-periphery form: Simple cores, bridging cores, bridging individuals, semi-periphery, periphery The multi-core–semi-periphery–periphery structure was also confirmed in a relatively small co-authorship network constructed from the curricula vitae (CVs) and bibliographies of teaching staff at the Faculty of Humanities and Education Science’s Department of Library Science (DHUBI) at the National University of La Plata, Argentina [7]. Besides describing the overall structure, [24] attempted the first (visual) attempts to follow individual units in blockmodels’ transition between timespans in order to pinpoint differences in the network dynamics between analyzed disciplines. 14.2
Methods
A lot of attention has been paid to studying the relationship between collaboration on one side and the quality of research and speed of diffusion of scientific knowledge on the other [19; 16; 1; 29]. While much research has considered the structure of co-authorship blockmodels [15; 34; 2], not so much has examined the stability of long-term collaborations. Here, it will be illustrated how blockmodeling can be used to reveal the global structure of co-authorship networks and how the stability of the blockmodels obtained can be operationalized and measured. This is especially important when seeking to explain the stability of research teams using common statistical methods such as linear regression. 14.2.1
Blockmodeling
The goal of blockmodeling is to reduce a large, complex network to a smaller, comprehensible, and interpretable structure [13]. It can not only be used to find groups of highly linked units in a network, but also the relationships between the groups. While it can reveal a lot of information about the global co-authorship structure, obtaining the solution (especially in the case of direct blockmodeling) can be very computationally expensive where networks with a higher number of units are involved. The blockmodeling can be either direct or indirect. Indirect blockmodeling is based on a dissimilarity matrix among units. The calculated dissimilarity measure has to be consistent with a chosen equivalence between units. In the studies by Kronegger et al. [24] and Cugmas et al. [9], the corrected Euclidean distance, which is consistent with structural equivalence [5], was used. The process of hierarchical clustering of units can be visualized in a dendrogram in which the units (or groups) and the dissimilarity between the units (or groups) are represented. Kronegger et al. [24] and Cugmas et al. [9] defined the number of positions based on such visualization. On the other hand, unlike indirect blockmodeling direct blockmodeling can be achieved through a local optimization procedure [6], e.g. using an iterative method where for each displacement of a unit from one group into another, the value of the criterion function is calculated, defined as the difference between the ideal and empirical clustering where the ideal clustering has to express a blockmodel’s assumed structure. It turns out that this procedure can be very time-consuming if a higher number of units in the network is analyzed. Cugmas et al. [9] also report that the algorithm implemented in Pajek has some difficulties detecting very small, structurally equivalent cores, particularly in the case of
254
SCIENTIFIC CO-AUTHORSHIP NETWORKS
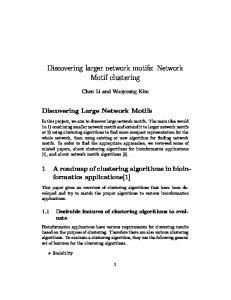
Figure 14.1: The features that can be used as indicators of less stable clusterings
scientific disciplines with a very large number of researchers. To mitigate these characteristics, they removed the periphery and the structurally equivalent cliques from the network before applying the procedure. They later merged them to obtain the final result.
14.2.2
Measuring the stability of the obtained blockmodels
The main result of blockmodeling is a partition which assigns a researcher to a certain core, semi-periphery, or periphery. In the case of temporal co-authorship networks (where time is seen as a discrete variable), blockmodeling can be applied for each time period separately such that one partition for each time period is obtained1 . A very important characteristic of temporal co-authorship networks is that some researchers (called newcomers) join the network at a later time period and others (called departures) leave the network at the later time period. Besides the presence of newcomers and departures, also the splitting of cores and merging of cores can be seen as separate features that indicate the lower stability of the obtained blockmodels or cores. Nevertheless, a combination of different features usually appears simultaneously; a visualization of each feature is presented in Figure 14.1. Each visualization is divided into two parts: the white rectangles at the top visualize the clusters (which are cores obtained by blockmodeling in the case of co-authorship blockmodels) from the partition U = {u1 , ..., ur } obtained on the set of units from the first time period while the black rectangles on the bottom visualize the clusters from the partition V = {v1 , ..., vc } obtained on the set of units from the second time period. Gray rectangles are added to the clusters and visualize the out-comers and newcomers. The links between the rectangles visualize the clusters’ stability. Adjusted Rand Index On the two assumptions that the merging and splitting of clusters are indicators of a lower level of cluster stability in time and that there are no newcomers or no departures present (or, at least, that they are neglected), one of the most widely and popular indexes for comparing partitions, the Adjusted Rand Index [21; 37], can be used. Here, the adjective ”adjusted” refers to the necessary correction for chance since the expected value is usually not 0 in the case of two random and independent partitions. This 1 Along
with the methods for generalised blockmodeling of multilevel networks [41], which can also be used for blockmodeling of temporal networks, different versions of stochastic blockmodeling exist for temporal networks [31; 40; 39; 3].
METHODS
255
correction allows the values of the index obtained from different partitions to be compared. Let us focus on the Rand Index [36], which is defined as RI =
a+d a+b+c+d
where a stands for the number of pairs of researchers classified in the same cluster in both time periods, b stands for the number of pairs of researchers classified in the same clusters in the first period but in different clusters in the second period, c stands for the number of researchers classified in different clusters in the first, but in the same cluster in the second period and, finally, d stands for the number of pairs of researchers classified in different clusters in both the first and second time periods. Following this definition, the Rand Index can be interpreted in the co-authorship network context as the proportion of all possible pairs of researchers classified in the same or in different clusters in both time periods out of all possible pairs of researchers. Wallace indices There are situations when the merging and splitting of clusters has to be considered differently. Therefore, one of two Wallace Indices can be used: in the case of the Wallace Index’ (WI’), only the splitting of clusters is considered a feature indicating lower cluster stability while with the Wallace Index” (WI”) only the merging of cores is considered a feature indicating the lower stability of clusters. Formally, WI’ is defined as W I0 =
a a+b
where a and b are defined the same as in the case of RI. WI’ can be interpreted as the proportion of all researcher pairs placed in the same core in the first period out of the number of all possible researcher pairs placed in the same core in both time periods. Similarly, WI” is defined as W I 00 =
a a+c
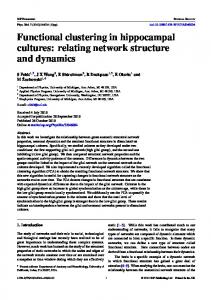
and interpreted as the ratio between the number of all possible researcher pairs classified in the same cluster in both periods and the number of all possible researcher pairs classified in the same cluster in the second period (the probability that a pair of researchers will be placed in the same cluster in the second period if they were placed in the same cluster in the first period). Modified Rand Index and Wallace indices As mentioned, it is common in temporal co-authorship networks that some researchers join the network and some leave the network in later time periods. When this happens, one can either simply ignore those researchers when calculating the Rand or Wallace indices, or treat the newcomers and departures as features indicating a lower level of stability of the cores. When the latter is assumed, one has to form new partitions U 0 = {u1 , u2 , ..., ur+1 } and V 0 = {v1 , v2 , ..., vc+1 } with the new clusters of newcomers ur+1 and departures vc+1 added to the partitions U and V . Then, the Modified Adjusted Rand Index (MARI), the Modified WI’, and the Modified WI” are calculated in the same way as RI, WI’, and WI” where the values in the numerator consider the partitions U 0 and V 0 . The modified Rand Index and the modified Wallace indices can be further modified in such a way that only newcomers or only departures are considered as features indicating lower core stability (for more details, see [8]) (see Figure 14.2). Along with the modified Rand Index and the modified Wallace indices, Cugmas and Ferligoj [8] proposed a correction for chance (based on Monte Carlo simulations) that allows one to compare the values of indices obtained in different scientific disciplines.
256
SCIENTIFIC CO-AUTHORSHIP NETWORKS
Figure 14.2: The indices for measuring the stability of cores in time (in brackets the features that lower the stability are given)
With non-adjusted indices, the number of clusters (cores, newcomers, and departures) and the number of researchers also influence the expected value of an index in the case of two random and independent partitions. The expected value of two random and independent partitions in the case of adjusted indices equals 0, and the maximum value of an index is 1. It should be highlighted that higher values of the presented indices indicate a higher level of cluster stability, while lower values indicate a lower level of stability. 14.3
The data
The data for this research were obtained from the Co-operative Online Bibliographic System and Services (COBISS) and the Slovenian Current Research Information System (SICRIS) maintained by the Institute of Information Science (IZUM) and the Slovenian Research Agency (SRA). SICRIS provides data about all researchers which have an ID assigned by the SRA, including their educational background and field of research according to the SRA’s classification scheme. There are 7 scientific fields and 72 scientific disciplines defined in this classification scheme. The 7th scientific field is Interdisciplinary Studies and is not included in the analysis since it has never gained full recognition as a separate research field in Slovenia [15]. The analyzed data are based on complete personal bibliographies of each researcher (constructed based on SICRIS and COBISS). The network boundaries are therefore defined only by those researchers registered as a researcher at the SRA. Among such researchers, those who published at least one scientific bibliographic unit between 1990 and 2010 are analyzed. The bibliographic units considered as a scientific publication by the SRA are listed in Table 14.1. There were 73,132 scientific bibliographic units published between 1991 and 2000 and 121,286 scientific units between 2001 and 2010. The most common are published scientific conference contributions and original scientific articles. The distribution of different types of bibliographic units varies among scientific disciplines. For example, published scientific conference contributions are very common to scientific disciplines from the tech-
THE DATA
257
Table 14.1: The number of published scientific bibliographic units by type for two time periods Type of scientific bibliographic unit Original scientific article Review article Short scientific article Published scientific conference contribution (invited lecture) Published scientific conference contribution
1991 - 2000
2001 - 2010
(independance)
(joining to the EU)
26531
47905
4895
5738
969
2530
3427
5279
28670
41138
Independent scientific component part in monograph
6417
14759
Scientific monograph
1725
2912
44
133
Scientific or documentary films, sound or video recording Complete scientific database or corpus Patent Total
73
182
381
710
73132
121286
nical sciences while original scientific articles are frequent among scientific disciplines within the social sciences and humanities. There are differences at the level of scientific disciplines according to the distribution of types of scientific bibliographic units which can be published by one or several researchers. Kronegger et al. [26] who studied the differences between scientific disciplines according to collaboration patterns in time confirmed the scientific discipline geography is more similar to scientific disciplines in the scientific fields natural sciences and mathematics than the scientific field of the humanities where it belongs according to the SRA’s classification scheme. Even within a number of scientific disciplines one can expect some differences in types of co-authorships. In the case of sociology, [34] concluded that quantitative work is more likely to be co-authored than non-quantitative work. Compared to the analysis conducted by Kronegger et al. [24] who studied four selected scientific disciplines in four time periods, the current analysis is performed on data for two consecutive 10-year periods between 1991 and 2010. The difference in the length of the periods mainly affects the size and density of the generated co-authorship networks and, in terms of the stability of research teams, result in a lower level of stability. However, the two periods selected reflect a time of major changes to scientific research and development policies in Slovenia. The first period is marked by the independence of Slovenia, meaning that Slovenia had started adopting and implementing its own science policies, while the second period is marked by the country joining the European Union and adopting European Union standards. By the end of this period, Slovenia had already partly integrated its national science system into the European one. Although many co-authorship networks are analyzed in this study, we present sociology co-authorship networks as an example. The units represent researchers and a link between two researchers exists if they published at least one scientific bibliographic unit in co-authorship. Therefore, only symmetric links are possible in the case of co-authorship networks. There are also some researchers without any link which are later classified in the so-called periphery, explained in detail in the next section. However, it should be pointed out that the absence of links is not necessarily the consequence of only single-
258
SCIENTIFIC CO-AUTHORSHIP NETWORKS
authored scientific bibliographic units by a certain researcher, but can also be the outcome of co-authoring only with researchers who do not have a researcher ID, for example with researchers from abroad. Isolated researchers are present in both time periods. The next important network characteristic which is common to almost all scientific disciplines is that the co-authorship networks grow in time.
14.4
The structure of obtained blockmodels
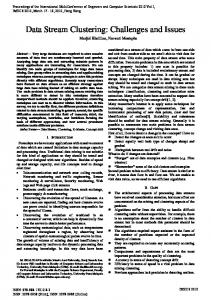
Based on four scientific disciplines, Kronegger et al. [24] showed that the structure of coauthorship networks consists of the multi-core, semi-periphery, and periphery. To confirm that this structure is also present in other scientific disciplines, Cugmas et al. [9] used indirect blockmodeling to detect the approximate number of cores and direct blockmodeling to obtain the final solution as described in Section 14.2.1. The assumed blockmodel structure was confirmed in all scientific disciplines included in the analysis. Most disciplines that were excluded (in Figure 14.3 indicated by asterisks) were removed due to a small number of researchers in the first or second time period or absence of co-authorship in the current period. One such discipline is theology that did not have a single co-authored scientific bibliographic item published in the first period. It can also be seen in Figure 14.3 that the number of researchers who published at least one scientific bibliographic item is increasing over time in almost all scientific disciplines. The average growth in the number of researchers publishing at least one scientific bibliographic item in the second period is 34 %. Only in the disciplines veterinary medicine, stomatology and mining and geotechnology is a decrease in the number of researchers from the first to the second period observed. Figure 14.4 visualizes two empirical blockmodels of the scientific discipline sociology. The first blockmodel corresponds to the first period while the second blockmodel corresponds to the second period. The rows and columns of each blockmodel contain the IDs of the researchers, where the black dots in the cells denote co-authorships between two given researchers. A clear multi-core-semi-periphery-periphery structure can be seen in the case of sociology in both time periods. Along with the already described multi-core, semi-periphery, and periphery, in the blockmodel in the first period a so-called bridging core is seen (as a full off-diagonal block) (Figure 14.4a). The bridging core is a group of researchers who collaborate between each other very systematically and also with researchers from at least two other cores. They are called “bridging” since they connect two or more cores. They are relatively common in Slovenian scientific disciplines. There was a minimum of one bridging core in at least one time period in 20 of all analyzed scientific disciplines. The visualization in Figure 14.5 emphasizes the transitions of researchers between the obtained cores (including the semi-periphery and periphery) for the two periods: the upper part visualizes the classification of researchers for the first period and the bottom part visualizes the classification of researchers for the second period. It is shown on Figure 14.4 that the share of researchers classified in the periphery is decreasing in sociology, which cannot be seen in the visualization of researchers’ transitions in time in Figure 14.5a. This is caused by the newcomers and departures. Figure 14.5a reveals a high share of researchers who were not classified in the cores in both time periods (e.g. many researchers were classified in the periphery in the first and second periods). Further, many newcomers were classified in the semi-periphery or periphery in the second period. Similar pattern of many new researchers which were not connected to any previously existing authors was also found in other studies [2].
THE STRUCTURE OF OBTAINED BLOCKMODELS
259
Figure 14.3: List of scientific disciplines with number of researchers in the first and second periods (an asterisk indicates scientific disciplines which were not considered in the analysis due to a small number of researchers in the first or second time period or absence of co-authorship in the current period)
chemistry computer science and informatics economics physics educational studies neurobiology biology materials science and technology plant production civil engineering systems and cybernetics oncology pharmacy cardiovascular system manufacturing technologies and systems geology energy engineering microbiology and immunology linguistics public health (occupational safety) historiography biochemistry and molecular biology veterinarian medicine human reproduction law mathematics chemical engineering forestry, wood and paper technology telecommunications sociology mechanical design animal production electronic components and technologies biotechnology literary sciences * textile and leather political science administrative and organisational sciences psychology process engineering geography philosophy * anthropology * metabolic and hormonal disorders metrology electric devices stomatology * mechanics * ethnology * archaeology * culturology * architecture and design * traffic systems * control and care of the environment * art history * criminology and social work * urbanism * hydrology * mining and geotechnology * geodesy * computer intensive methods and applications * psychiatry * information science and librarianship * landscape design * musicology * sport *
600
500
400
300
200
100
0
1st time period 2nd time period
260
SCIENTIFIC CO-AUTHORSHIP NETWORKS
203
202
201
200
199
198
197
196
195
194
193
192
191
190
189
188
187
186
185
184
183
182
181
180
179
178
177
176
175
174
173
172
171
170
169
168
167
166
165
164
163
162
161
160
159
158
157
156
155
154
153
152
151
150
149
148
147
146
145
144
143
142
141
140
139
138
137
136
135
134
133
132
131
130
129
128
127
126
125
124
123
122
121
120
119
118
117
116
115
114
113
112
111
110
109
108
107
106
105
104
103
102
101
100
99
98
97
96
95
94
93
92
91
90
89
88
87
86
85
84
83
82
81
80
79
78
77
76
75
74
73
72
71
70
69
68
67
66
65
64
63
62
61
60
59
58
57
56
55
54
53
52
51
50
49
48
47
46
45
44
43
42
41
40
39
38
37
36
35
34
33
32
31
30
29
28
27
26
25
24
23
22
21
20
19
18
17
16
15
14
13
12
11
10
9
8
7
6
5
4
3
2
1
Figure 14.4: Structure of sociology co-authorship blockmodel for the first and second time periods 1
1
2
2
3 4
3
5
4
6 7
5
8
6
9
7
10
8
12
11 13
9
14
10
15 16
11
17
12
18 19
13
20
14
21 22
15
23
16
24 25
17
26
18
27 28
19
29
20
30 31
21
32
22
33 34
23
35
24
36 37
25
38
26
39 40
27
41
28
42 43
29
44
30
45 46
31
47
32
48 49
33
50
34
51
35
52
36
54
37
55
38
57
39
58
40
60
41
61
42
63
43
64
44
66
45
67
46
69
47
70
48
72
49
73
50
75
53
56
59
62
65
68
71
74 76
51
77
52
78 79
53
80
54
81 82
55
83
56
84 85
57
86
58
87 88
59
89
60
90 91
61
92
62
93 94
63
95
64
96 97
65
98
66
99 100
67
101
68
102 103
69
104
70
105 106
71
107
72
108 109
73
110
74
111 112
75
113
76
114 115
77
116
78
117 118
79
119
80
120 121
81
122
82
123 124
83
125
84
126 127
85
128
86
129 130
87
131
88
132 133
89
134
90
135 136
91
137
92
138 139
93
140
94
141 142
95
143
96
144 145
97
146
98
147 148
99
149
100
150 151
101
152
102
153 154
103
155
104
156 157
105
158
106
159 160
107
161
108
162 163
109
164 165
110
166
111
167 168
112
169
113
170 171
114
172
115
173 174
116
175
117
176 177
118
178
119
179 180
120
181
121
182 183
122
184
123
185 186
124
187
125
188 189
126
190
127
191
128
192
129
194
193
130
195
131
197
196
132
198
133
200
199
134
201
135
203
202
(a) 1991 to 2000
(b) 2001 to 2010
Figure 14.5: Visualization of researchers’ transitions in two time periods for sociology
(a) Transitions between the cores, semiperiphery and periphery
(b) Transitionss between the cores, into cores and out of cores
Since the main interest of study is the stability of the cores of the obtained blockmodels, researchers not classified in the cores in at least one period can be removed from the visualization. Therefore, a new visualization can be presented in Figure 14.5b consisting of two parts (one for each period) without the semi-periphery, periphery, newcomers, and departures. Instead, researchers classified in the cores in the first but not in the second period are now called “out-of-cores” researchers and, similarly, researchers not classified in the cores in the first period but were classified in the core in the second period are now called “into-cores” researchers. Focusing on the core part of the sociology example, it can be observed that cores 1 and 2 merged in the second period, while core 3 splits into three cores in the second period. There are also many cores which disappear in the second period (out-of-cores researchers) and a lot of researchers not classified in the cores in the first but are classified in the cores in the second period. These into cores researchers usually join already the existing cores in the second period. Visualizations of researchers’ transitions between the core, into cores and out of cores in the two periods are made for all analyzed scientific disciplines (Figure 14.6). A relatively high share of into-cores and out-of-cores researchers in all analyzed scientific disciplines and some merging and splitting of cores in the core part of the visualized transitions can
THE STRUCTURE OF OBTAINED BLOCKMODELS
261
be seen. Here, the into-cores and out-of-cores researchers are seen as the primary source of instability of the core part of scientific disciplines. Although the share of into-cores researchers is higher than the share of out-of-cores researchers in almost all analyzed scientific disciplines, some scientific disciplines reveal the share of out-of-cores prevails over the share of into-cores researchers. The number and the size of the cores, the size of the semi-periphery and the size of the periphery vary across scientific disciplines (see Figure 14.7 and Table 14.2 and 14.3). For example, the discipline administrative and organizational sciences consist of 6 cores in the first period and 16 cores in the second. As it is shown in the latter sections, most of the existing cores in the second time period emerged from the non-core part of the network. The newly emerged cores are of smaller size (in average 2.64 researchers) than the cores in the first time period. These observations indicate that the scientific collaboration might become seen as more beneficial by the researchers from the field administrative and organizational sciences. Keep in mind that this is a scientific discipline with a relatively low number of researchers (96 researchers in the first and 155 researchers - with at least one published scientific bibliographic unit - in the second time period). There are usually higher number of cores in the disciplines with a higher number of researchers which is expected since the personal limits of each researcher to cooperate with a limited number of coauthors and produce a limited number of publications [24; 12]. One such example is physics with 307 researches (with at least one published scientific bibliographic unit) in the first and 451 researchers in the second period. There are 15 cores revealed in both the first and second period. As this is the case for almost all scientific disciplines, the average core size is higher in the second period than in the first. The decrease in the average core size is usually the consequence of many cores of size two emerged (e.q., biochemistry and molecular biology, chemistry, law). These can consist of any kind of researches, for example, a core of size three can consist of a student and his mentor. However, it is assumed that any kind of scientific collaboration of which the output is scientific bibliographic unit, requires very intensive collaboration - exchange of knowledge and ideas. The pairs of scientists, collaborating as researchers are also very common in the field of social network analysis. One example could be Borgatti and Everett. However, some studies found that type (e.g., natural vs. social or office vs. lab or theoretical vs. empirical) of a scientific discipline affect the size of a research teams [32; 27; 20]. Here, the highest average core size in the first period is observed in oncology (8.3 researchers) and human reproduction (8.0 researchers), while the lowest average core size in the first period is observed in linguistics (2.6 researchers) and psychology (2.9 researchers). In general, the overall average number of cores is similar in both periods (around 11 cores), while the overall average size of the cores is increasing in time (from 4.4 to 5.6 researchers, p < 0.01), as confirmed by Amat and Perruchas [4]. Following the distinction between the natural and technical sciences on one side, and the social sciences and humanities on the other, it can be concluded that the average size of the cores is increasing, especially in the natural and technical sciences (form 4.6 to 6.1 researchers, p < 0.01), while in the social sciences and humanities, the growth of the average size of cores (from 3.8 to 4.2 researchers, p = 0.30) is not statistically significant. In general, the average core size is lower in the social sciences and humanities in both periods (for 0.95 researchers in the first and 1.85 researchers in the second time period; p < 0.05 and p < 0.01 susbequently) (Figure 14.7). Solo authors or authors who published only in co-authorship with authors from outside the discipline are classified in the periphery. The average share of these authors among analyzed scientific disciplines is decreasing in time (from 29 % to 23 % average share
262
SCIENTIFIC CO-AUTHORSHIP NETWORKS
Figure 14.6: Visualization of researchers’ transitions between the cores in the two periods for all analyzed scientific disciplines (the black rectangles on the top and on the bottom correspond to the cores, the gray rectangles on the top correspond to the group of into cores while the gray rectangles on the bottom correspond to the group of out of cores) administrative and organisational sciences 2
4
1
2
3
3
1
4
5
6
incomer
7
10
13
8
9
6
11
14
12
3
4
9
1
2
2
6
6
7
5
8
1
3
5
4
4
6
8
3
2
12
9
10
15
16
16
18
12
14
13
1
17
7
5
20
14
4
5
2
6
8
18
10
9
8
8
7
6
17
9
5
2
10
5
6
incomer
1
15
19
11
13
1
6
5
11
6
2
3
4
1
3
7
8
3
1
9
1
10
4
9
7
2
5
6
7
1
3
9
outgoing
2
6
9
10
13
incomer
2
2
9
1
9
5
8
4
8
6
3
6
14
4
2
15
outgoing
incomer
2
5
6
7
16
9
11
8
2
12
3
4
5
7
5
8
9
13
10
11
12
1
13
outgoing
3
1
2
4
7
10
11
7
10
1
5
5
6
3
6
8
4
8
6
7
outgoing
8
6
12
7
8
3
23
11
6
3
outgoing
incomer
2
5
4
15
4
4
4
3
7
12
16
9
17
5
13
7
8
1
9
10
9
8
5
1
2
3
6
2
8
9
11
1
2
2
1
2
3
2
4
3
11
6
8
12
4
1
21
22
4
8
13
14
10
incomer
19
18
1
1
2
outgoing
outgoing
8
6
5
2
1
6
5
4
3
4
21
13
24
7
14
8
8
9
10
15
12
11
20
12
9
16
7
23
15
4
biology
incomer
14
2
1
6
12
3
4
5
6
7
8
9
2
1
20
26
2
13
14
18
11
25
5
17
outgoing
4
19
5
2
8
10
4
5
13
incomer
18
5
1
27
22
2
1
outgoing
6
1
16
7
biotechnology 10
11
9
14
8
15
incomer
10
2
12
3
4
5
6
7
8
3
9
1
4
5
2
6
12
11
1
14
8
9
8
3
9
10
15
7
1
3
12
4
6
7
13
incomer
3
1
outgoing
7
1
2
6
3
4
6
5
5
11
7
8
2
8
3
9
4
16
10
9
11
11
10
outgoing
12
12
incomer
13
11
3
12
6
2
7
3
8
5
6
7
incomer
2
outgoing
6
2
4
5
6
7
8
9
1
7
3
5
outgoing
1
10
3
9
9
5
1
7
6
4
12
7
11
8
10
2
6
12
4
8
3
incomer
11
3
5
outgoing
5
6
6
9
7
3
10
1
7
2
4
9
11
13
incomer
3
7
outgoing
11
5
2
9
6
10
10
8
1
8
4
2
2
3
4
5
4
1
outgoing
7
3
1
2
7
10
4
12
5
12
7
1
2
9
2
13
3
3
10
outgoing
5
1
6
8
4
5
1
4
11
6
5
3
1
3
10
6
13
5
4
outgoing
1
13
6
8
7
11
3
8
4
1
11
12
1
6
11
incomer
9
1
2
7
7
1
6
2
8
12
9
3
outgoing
2
5
9
6
7
8
14
15
1
5
incomer
outgoing
7
4
8
4
2
2
6
2
2
outgoing
3
4
8
3
3
5
8
2
6
9
8
1
2
3
4
4
5
incomer
6
7
1
4
outgoing
2
20
23
14
8
11
4
13
7
6
1
3
1
11
13
4
22
15
14
15
17
16
16
17
18
9
3
5
5
9
18
19
12
12
incomer
7
outgoing
1
7
4
2
2
3
5
6
8
10
8
10
9
11
11
12
13
3
12
6
incomer
7
9
5
outgoing
9
5
4
4
7
1
7
1
3
incomer
2
5
outgoing
5
2
10
3
9
4
1
3
incomer
4
5
6
8
2
11
outgoing
neurobiology 4
outgoing
6
3
mathematics
3
2
14
6
9
3
12
9
5
15
1
8
6
10
17
19
7
2
4
7
11
20
10
13
16
18
5
1
8
incomer
outgoing
political science incomer
1
4
energy engineering
outgoing
5
4
21
1
incomer
7
7
10
6
4
4
6
2
outgoing
5
5
8
outgoing
sociology
5
incomer
1
8
incomer
6
6
2
2
2
9
9
3
5
veterinarian medicine incomer
7
13
8
10
incomer
public health (occupational safety) incomer
5
19
incomer
plant production
8
1
4
10
1
microbiology and immunology
metrology 3
2
1
human reproduction
3
8
6
4
historiography
9
7
3
incomer
5
2
computer science and informatics
13
10
5
outgoing
electronic components and technologies
2
1
4
3
civil engineering 19
6
5
outgoing
textile and leather 9
3
1
incomer
7
6
2
1
2
20
4
7
6
4
outgoing
5
3
5
4
physics
10
4
10
4
4
7
6
6
16
3
incomer
9
9
5
8
incomer
8
5
3
outgoing
9
9
1
17
3
psychology
incomer
3
7
11
8
manufacturing materials science and technologies and systems technology
12
4
6
geology
6
7
6
5
electric devices
5
10
11
3
13
outgoing
2
3
4
7
chemistry
4
pharmacy
5
2
5
1
15
incomer
14
1
2
2
10
7
10
4
1
6
3
incomer
8
1
7
4
7
3
metabolic and hormonal disorders
telecommunications 3
2
10
6
5
2
process engineering
1
4
6
incomer
4
1
6
9
1
1
outgoing
7
5
5
3
5
8
geography
4
8
2
8
6
3
3
15
oncology 2
6
5
incomer
2
4
12
5
8
3
17
outgoing
mechanical design 1
7
linguistics
2
13
1
4
law 3
7
9
chemical engineering
outgoing
forestry, wood and paper technology 7
5
educational studies
11
7
4
3
incomer
economics 3
1
outgoing
cardiovascular system
biochemistry and molecular biology
animal production
9
2
6
1
4
6
4
1
7
10
3
7
3
incomer
2
5
outgoing
systems and cybernetics 1
7
2
6
5
3
incomer
7
outgoing
8
2
6
12
1
2
4
9
7
10
10
11
8
5
7
1
3
6
4
incomer
9
5
3
outgoing
1. Natural sciences and mathematics biochemistry and molecular biology biology chemistry geology mathematics pharmacy physics 2. Engineering sciences and technologies chemical engineering civil engineering computer science and informatics electric devices electronic components and technologies energy engineering manufacturing technologies and systems materials science and technology mechanical design metrology process engineering systems and cybernetics telecommunications textile and leather 3. Medical sciences cardiovascular system human reproduction metabolic and hormonal disorders microbiology and immunology neurobiology oncology public health (occupational safety)
Scientific discipline and scientific field
11 12 22 14 9 15 15 8 15 25 8 14 15 14 13 11 12 11 12 15 11 11 7 12 10 22 10 17
153 242 401 70 116 210 217 253 135 74 92 240 142 100 224 164 74 208 296 233 195
number of cores
171 279 443 211 155 228 307
N
54.91 53.66 13.51 54.81 51.01 54.08 34.87
60.13 65.29 51.87 31.43 36.21 57.14 45.62 60.08 55.56 39.19 52.17 54.17 39.44 55.00
45.61 46.59 64.79 44.55 34.19 51.75 61.89
semi-per. (%)
1991 - 2000
16.52 21.95 45.95 14.90 25.68 17.60 41.54
24.18 15.70 27.43 25.71 23.28 16.67 28.57 17.39 21.48 20.27 11.96 21.67 32.39 12.00
30.41 37.63 12.87 34.12 51.61 25.00 15.96
per. (%)
7.11 8.00 3.00 7.88 3.45 8.25 3.07
4.00 3.54 3.61 5.00 3.92 4.23 4.67 5.18 3.44 3.00 3.67 5.80 3.08 3.67
4.56 4.40 4.95 3.75 3.14 4.08 5.23
average core size
268 187 97 270 366 277 264
197 289 565 97 135 283 276 332 210 100 93 291 195 131
301 427 553 294 257 285 451
N
8 7 11 8 12 11 12
10 18 21 6 15 14 14 15 13 11 11 14 13 9
17 18 29 10 13 8 15
number of cores
67.54 55.61 38.14 67.78 69.67 56.32 56.06
66.50 61.94 63.36 38.14 40.74 60.07 52.90 62.05 56.19 35.00 48.39 58.42 45.13 61.07
45.85 55.04 67.09 43.54 51.36 71.58 65.63
semi-per. (%)
2001 - 2010
12.69 11.76 28.87 8.89 16.67 13.36 29.55
18.78 13.49 21.24 26.80 25.93 15.90 23.55 13.86 17.62 30.00 17.20 17.53 21.03 11.45
33.55 27.40 11.93 42.86 32.30 14.04 12.42
per. (%)
8.83 12.20 3.56 10.50 5.00 9.33 3.80
3.62 4.44 4.58 8.50 3.46 5.67 5.42 6.15 5.00 3.89 3.56 5.83 6.00 5.14
4.13 4.69 4.30 5.00 3.82 6.83 7.62
average core size
Table 14.2: The considered scientific disciplines and their characteristics in the two periods – part 1
57.81 42.50 66.67 47.62 81.16 45.45 80.43
62.50 69.57 62.65 56.67 61.70 70.91 50.00 61.40 64.52 56.67 66.67 48.28 50.00 63.64
68.29 70.45 68.69 64.44 59.09 77.36 52.94
% of researchers that left the cores
THE STRUCTURE OF OBTAINED BLOCKMODELS
263
SCIENTIFIC CO-AUTHORSHIP NETWORKS
264
Table 14.3: The considered scientific disciplines and their characteristics in the two periods – part 2
96 338 303 157 98 92 135
127 111 149 247 171
N
8 11 15
6 20 19 10 12 9 11
11 9 12 10 10
number of cores
33.33 9.14 10.71
17.71 49.11 38.28 24.20 23.47 29.35 28.15
64.57 49.55 62.42 68.83 60.23
semi-per. (%)
35.63 74.73 71.94
64.58 32.84 39.60 47.13 48.98 48.91 42.22
6.30 18.92 11.41 12.96 8.19
per. (%)
4.50 3.33 2.62
4.25 3.39 3.94 5.62 2.70 2.86 4.44
4.11 5.00 3.90 5.62 6.75
average core size
117 251 296
155 477 404 204 142 131 203
158 196 153 312 168
N
8 11 25
16 22 17 15 9 10 9
12 9 10 11 8
number of cores
53.85 23.11 22.64
34.19 61.01 51.24 31.37 45.77 38.17 48.77
48.73 58.16 53.59 66.35 61.31
semi-per. (%)
24.79 60.56 55.07
41.94 21.17 33.91 35.78 31.69 36.64 31.03
7.59 13.78 11.76 8.33 5.36
per. (%)
4.17 4.56 2.87
2.64 4.25 4.00 5.15 4.57 4.12 5.86
6.90 7.86 6.62 8.78 9.33
average core size
40.74 43.33 61.76
58.82 73.77 76.12 40.00 74.07 65.00 45.00
35.14 60.00 43.59 35.56 51.85
% of researchers that left the cores
2001 - 2010
Scientific discipline and scientific field
87 186 196
1991 - 2000
4. Biotechnical sciences animal production biotechnology forestry, wood and paper technology plant production veterinarian medicine 5. Social sciences administrative and organisational sciences economics educational studies law political science psychology sociology 6. Humanities geography historiography linguistics
STABILITY OF THE OBTAINED BLOCKMODEL STRUCTURES
265
40
60
80
Natural and technical sciences Social sciences and humanities
0
20
Average share of periphery
8 6 4 0
2
Average core size
10
12
100
Figure 14.7: The average core size and the average size of the periphery by field and time period
1991 − 2000
2001 − 2010
1991 − 2000
2001 − 2010
of the periphery, p = 0.06). The biggest reduction in the percentage of the periphery in the second period is observed in criminology and social work (a 65 % decrease). In some scientific disciplines, the percentage of the periphery increased in the second period. These are mainly disciplines from the natural and technical fields. However, the size of the periphery is greater in fields of the social sciences and humanities (the average size is 44 %) than in scientific disciplines classified in the natural and technical sciences (the average size is 21 %)(p < 0.01). In addition, the average share of the periphery decreases from the first to the second period espcially in the natural and technical sciences (from 51 to 37 %, p < 0.05) while the difference in the average share of periphery is not statistically significant (p = 0.11) in the social sciences and humanities (the share of the periphery decreased from 23 to 19 %) (Figure 14.7).
14.5
Stability of the obtained blockmodel structures
In this section, the stability of cores is studied according to different operationalisations of core stability. Although the presented visualizations of researchers’ transitions between two time periods (Figure 14.6) are a very efficient tool for studying the stability of the cores obtained but whose interpretation is complex, the values of the indices proposed in Section 14.2 are calculated. These indices are more objective operationalizations of core stability and allow us to compare the values calculated for different scientific disciplines. The scientific disciplines are then clustered according to the calculated indices. The groups of scientific disciplines thus obtained are further analyzed. In the second part, the operationalization of the stability of cores is restricted to one of the described indices for measuring core stability, namely, as applied in Cugmas et al. [9] only the splitting of cores and the out-of-cores researchers are seen as features indicating lower stability of the cores. The differences in the mean stability of cores among different scientific fields are studied using linear regression. Some further controlling explanatory variables are also included in the model. First, the values of each presented index for each analyzed scientific discipline are shown in Table 14.4 and provide the basis for all further analyses. In this table, one sees that the values of the Adjusted Rand Index and the adjusted Wallace indices are relatively
266
SCIENTIFIC CO-AUTHORSHIP NETWORKS
large, while the others are relatively small. This is due to the high share of into-cores and out-of-cores researchers which are not considered when calculating the values of the Adjusted Rand Index and the adjusted Wallace indices for each scientific discipline. The high values of the first three indices and the low values of the others confirm that the intocores researchers and out-of-cores researchers are the biggest source of the obtained cores’ instability. 14.5.1
Clustering of scientific disciplines according to different operationalisations of the stability of cores
Based on the calculated standardzied indices (see Table 14.4 for non-standardized values of the indices), the analyzed scientific disciplines are clustered using Ward’s agglomerative clustering method and squared Euclidean distance. Using the GAP Statistics [38] and the obtained dendrogram three clusters were chosen. By observing the means of the calculated indices for each cluster (see Table 14.4), the obtained clusters can be ordered from the least stable (Cluster 1) to the most stable cluster (Cluster 3). Cluster 2 is named average since the values of all the indices are closest to the global means, compared to the other groups. Table 14.5 summarizes some descriptive statistics of other blockmodels’ characteristics: The percentage of the into-cores (% into-cores) and out-of-cores (% out-of-cores) researchers. The percentage of into-cores researchers is defined as the ratio between the number of researchers not in the cores in the first period and the number of researchers classified in the cores in the first period. On the other hand, the percentage of out-of-cores researchers is defined as the ratio between the number of researchers who joined the cores in the second period and the number of researchers classified in cores in the second period. Since Slovenian scientific disciplines are generally growing, the average share of into-cores researchers is lower than the share of out-of-cores researchers. However, a higher percentage of into-cores than out-of-cores researchers is typical for the unstable cluster of scientific disciplines. The overall average core size (core size) and the overall number of researchers across clusters of scientific disciplines (# of res.). The average size of the cores is relatively small, the smallest is in the case of an unstable cluster (3.9 researchers) and the highest in the case of the most stable cluster (5.8 researchers). While a higher average core size is typical for more stable scientific disciplines, a higher number of researchers per discipline is related to less stable scientific disciplines. The number of scientific disciplines. The average cluster, according to the values of the stability measures, has the highest number of scientific disciplines, followed by the unstable and the stable cluster. In the Slovenian Research Agency’s classification scheme, the scientific fields are further divided into several scientific disciplines and then into scientific sub-disciplines. Based on this, most scientific disciplines from the fields of engineering sciences and technologies (9 out of 14), biotechnological sciences (4 out of 5) and social sciences (4 out of 7) were classified in the unstable cluster. Most (5 out of 7) scientific disciplines from the natural sciences and mathematics were classified in the average cluster and three out of seven scientific disciplines from the field of medical sciences were classified in the most stable cluster. We can say the most stable scientific disciplines are from medical sciences and the most unstable from the technical field and social sciences. Similarly, Melin [32] concluded
STABILITY OF THE OBTAINED BLOCKMODEL STRUCTURES
267
ARI
AWI’
AWI”
MARI1
MAWIS1
MAWIM1
MARI2
MAWIS2
MAWIM2
Table 14.4: The values of different indices for measuring the stability of cores for all analyzed scientific disciplines by obtained clusters
Cluster 1 (unstable) biochemistry and molecular biology geology psychology pharmacy physics neurobiology materials science and technology public health (occupational safety) biology educational studies linguistics electric devices metrology
-0.16 0.09 0.04 0.50 0.40 0.43 0.33 0.37 0.38 0.32 0.43 0.50 0.42
-0.11 0.11 0.07 0.69 0.67 0.68 0.26 0.32 0.48 0.34 0.29 0.46 0.44
-0.27 0.07 0.03 0.39 0.28 0.32 0.45 0.42 0.31 0.31 0.82 0.56 0.40
-0.02 0.00 0.00 0.01 0.03 0.00 0.01 0.00 0.01 0.00 0.00 0.03 0.01
0.00 0.02 0.02 0.03 0.15 0.08 0.06 0.03 0.09 0.04 0.16 0.11 0.16
0.00 0.00 0.00 0.01 0.04 0.01 0.02 0.00 0.02 0.01 0.03 0.06 0.04
-0.03 0.00 -0.09 0.09 0.03 0.03 0.02 0.00 -0.02 -0.02 0.03 0.04 0.00
0.00 0.01 0.00 0.01 0.02 0.01 0.01 0.00 0.00 0.01 0.00 0.03 0.02
0.00 0.03 0.01 0.03 0.08 0.09 0.04 0.02 0.04 0.07 0.08 0.07 0.09
Standardized means
0.31
0.36
0.31
0.01
0.07
0.07
0.01
0.01
0.05
Cluster 2 (average) mathematics civil engineering energy engineering systems and cybernetics computer science and informatics telecommunications electronic components and technologies mechanical design process engineering textile and leather human reproduction metabolic and hormonal disorders chemistry forestry, wood and paper technology animal production veterinarian medicine biotechnology economics administrative and organisational sciences law political science historiography
1.00 0.86 0.81 0.70 0.63 0.69 0.62 1.00 0.84 0.80 0.40 0.73 0.60 0.64 0.49 0.52 0.73 0.71 0.80 0.58 0.86 0.57
1.00 0.76 0.75 0.57 0.57 0.89 0.47 1.00 0.72 0.80 0.93 1.00 0.46 0.69 0.51 0.68 1.00 0.64 0.67 0.80 1.00 0.68
1.00 1.00 0.88 0.92 0.71 0.56 0.91 1.00 1.00 0.80 0.26 0.57 0.89 0.60 0.47 0.43 0.57 0.80 1.00 0.45 0.75 0.49
0.05 0.01 0.01 0.04 0.01 0.04 0.01 0.04 0.02 0.03 0.08 0.02 0.01 0.06 0.06 0.04 0.04 0.01 0.06 0.09 0.01 0.08
0.27 0.14 0.15 0.19 0.19 0.35 0.13 0.23 0.14 0.18 0.28 0.07 0.17 0.34 0.19 0.15 0.14 0.14 0.11 0.29 0.13 0.39
0.08 0.02 0.02 0.09 0.03 0.08 0.03 0.06 0.04 0.04 0.14 0.01 0.02 0.14 0.13 0.05 0.05 0.01 0.09 0.17 0.02 0.20
0.01 0.01 0.05 0.12 0.04 0.06 0.11 0.04 0.1 0.00 0.12 -0.02 0.04 0.10 0.06 0.13 -0.01 0.01 0.05 -0.14 -0.03 0.05
0.01 0.01 0.01 0.04 0.02 0.02 0.03 0.01 0.04 0.03 0.06 0.01 0.01 0.05 0.01 0.05 0.01 0.01 0.01 0.06 0.01 0.07
0.09 0.06 0.09 0.15 0.14 0.09 0.19 0.09 0.17 0.10 0.14 0.06 0.17 0.15 0.06 0.09 0.04 0.07 0.19 0.22 0.05 0.09
Standardized means
0.71
0.75
0.73
0.04
0.20
0.17
0.04
0.03
0.12
Cluster 3 (stable) plant production oncology chemical engineering manufacturing technologies and systems microbiology and immunology cardiovascular system sociology geography
0.90 0.89 1.00 0.95 0.88 1.00 0.52 0.36
0.84 0.85 1.00 0.90 0.86 1.00 0.55 0.29
0.97 0.93 1.00 1.00 0.91 1.00 0.50 0.49
0.15 0.11 0.08 0.06 0.09 0.06 0.06 0.03
0.45 0.42 0.33 0.43 0.32 0.30 0.36 0.15
0.34 0.23 0.14 0.12 0.16 0.10 0.16 0.12
0.11 0.12 0.09 0.11 0.25 0.32 0.25 0.22
0.05 0.11 0.08 0.07 0.16 0.18 0.14 0.12
0.19 0.35 0.30 0.25 0.26 0.30 0.23 0.21
Standardized means
0.81
0.79
0.85
0.08
0.35
0.02
0.18
0.11
0.26
Discipline
268
SCIENTIFIC CO-AUTHORSHIP NETWORKS
Table 14.5: Basic descriptive statistics of the obtained clusters (averages on the level of clusters are reported) Cluster
% into cores
% out of cores
core size
# of res.
72 69 53
67 58 48
3.9 4.2 5.8
322 274 272
Cluster 1 (N = 13) (unstable) Cluster 2 (N = 22) (average) Cluster 3 (N = 8) (stable)
Figure 14.8: The distribution of standardized values of the first canonical discriminant function by clusters
Cluster 1 Cluster 2 Cluster 3
cluster 1 (centroid)
cluster 2 (centroid)
higher mean core size
higher mean % into−cores and out−of−cores cluster 3 (centroid)
lower mean % into−cores and out−of−cores
lower mean core size
that researchers from the medical sciences field almost always work in teams and from time to time collaborate with other teams. Kyvik [27] reports that the greatest number of multi-authored papers in Norway is in medicine. Since a scientific discipline’s affiliation with a certain cluster is a categorical variable, one can check if the basic characteristics presented in Table 14.5 can be used to predict the cluster in which a given scientific discipline belongs. To do this, discriminant analysis can be used. Since there are three clusters of scientific disciplines, two discriminant functions can be calculated based on the four explanatory variables presented in Table 14.5. Only the first discriminant function is statistically significant (p < 0.01), meaning that based on the four explanatory variables one can separate well between the stable cluster (cluster 3) on one side and average and unstable clusters (clusters 1 and 2) on the other. The discriminant functions are defined as linear combinations of explanatory variables. In Figure 14.8, the first discriminant function is visualized. Here, the highest values of the first discriminant function are characterized by higher mean percentage of into-cores (0.74) and percentage out-of-cores researchers (0.20) and a lower average number of researchers in the cores (-0.31). The value of the standardized canonical coefficient of the explanatory variable ’number of researchers’ is relatively low (-0.09) and is therefore not shown in Figure 14.8. The centroids for each cluster are also marked along with the distribution of the standardized discriminant function for the disciplines by clusters. From each cluster of the scientific disciplines one was chosen to represent the cluster (the closest one to the centroid). The representative of the unstable cluster is the scientific discipline educational studies. Here, many into-cores and out-of-cores researchers can be seen. Most pairs of researchers classified in the same core at the first time point were not classified in the same core in the second period. The representative of the average cluster is the scientific discipline of textile and leather. Here, the share of out-of-cores and into-
STABILITY OF THE OBTAINED BLOCKMODEL STRUCTURES
269
cores researchers is lower. Some relatively large cores which remain relatively stable in the second period can also be observed. This is more typical for the representative of the stable cluster, namely microbiology and immunology. Figure 14.9: Visualizations of researchers’ transitions between the cores into cores and out of cores for the two periods for the scientific discipline closest to the centroid in each cluster (the black rectangles on the top and on the bottom correspond to the cores, the gray rectangles on the top correspond to the group of into cores while the gray rectangles on the bottom correspond to the group of out of cores) 4
15
14
14
17
15
10
13
6
16
12
1
5
3
7
2
2 12 10 13 9
7
8
11
9
8
5
3
6
1 11
4
(a) educational studies (N=379)
14.5.2
into cores
out of cores
5
9
3
6
6
4
8
5
3
7
7
4
2
1
2
into cores
1
(b) textile and leather (N=123)
out of cores
7
3
4
5
5
3
6
6
1
1
2
8
2
4
into cores
out of cores
(c) microbiology and immunology (N=226)
Explaining the stability of cores
To analyse the differences in the stability of cores among scientific fields, Cugmas et al. [9] classified the fields into two categories: fields natural sciences and mathematics, engineering sciences and technologies, medical sciences, biotechnical sciences into the category ”the natural and technical sciences” and social sciences and humanities into the category the ”social sciences and humanitites”. The selected features lowering the stability of cores were the splitting of clusters and out-of-cores researchers and therefore, the stability of clusters were measured by the MAWS2. They shows that there is no statistically significant difference in average core stability. Given the high level of variability in the characteristics of the co-authorship networks and the blockmodel structures across scientific disciplines, the stability of the cores must be controlled by some additional network and blockmodel characteristics. Therefore, to explain the differences in the stability of cores across scientific fields, as controlling explanatory variables Cugmas et al. [9] also included in the linear model2 the characteristics of the networks (number of researchers, growth from the first period to the second period in the number of researchers and the growth of the density) and the obtained blockmodels (average core size, percentage of cores, presence of a bridging core in the first time point, percentage of departures). The main results are presented in Table 14.6. Here the humanities is used as the reference field since many studies suggest the social sciences are becoming more similar to the natural and technical sciences regarding publishing behavior [27; 26]. In Table 14.6 (Model 1), one can see there are no statistically significant differences between the humanities and other scientific fields when the percentage of departures is not included in the model. However, when the percentage of departures is included in the model, the differ2 The
Least Squares Method was used to estimate the parameters’ values. The correlations among independent variables were observed before the parameters were estimated. After that, the Variance Inflation Factor was checked to further investigate the potential problems of multicolinearity. The distribution of the residuals was also examined to identify the potential problems of heteroscedasticity or other un-satisfied assumptions.
270
SCIENTIFIC CO-AUTHORSHIP NETWORKS
Table 14.6: The impact of the characteristics of the network, blockmodel and disciplines on the stability of the cores Model 1 intercept number of researchers (first time period) growth of number of researchers (1st and 2nd time period) growth of density (1st and 2nd time period) average core size (1st time period) percentage of cores (1st and 2nd time period) presence of the bridge (1st time period) percentage of out-of-cores
Model 2
b
SE(b)
p
b
SE(b)
p
0.0906
0.2027
0.66
0.8349
0.1840
0.00
-0.0002
0.0003
0.58
0.0001
0.0002
0.77
0.0010
0.0015
0.53
0.0004
0.0010
0.72
0.0015
0.0010
0.04
0.0091
0.0005
0.07
0.0625
0.0177
0.00
0.0053
0.0152
0.73
-0.0054
0.0049
0.28
-0.0069
0.0033
0.05
0.0404
0.0450
0.38
-0.0005
0.0313
0.99
-1.0160
0.1667
0.00
not included
humanities (reference category) natural science and math.
-0.1511
0.0892
0.10
0.0378
0.0680
0.58
engineering sciences and tech.
-0.0120
0.0834
0.89
0.1339
0.0615
0.04
medical sciences
-0.0850
0.0954
0.38
0.1421
0.0748
0.07
biotechnical sciences
-0.0353
0.1008
0.72
0.0338
0.0694
0.63
social sciences
-0.0707
0.0844
0.41
0.0847
0.0626
0.19
Number of obs. (disciplines): Adjusted R2 : F Statistics: Method of estimation:
43
43
0.23
0.65
2.151 (11; 31) (p < 0.05)
7.375 (12; 30) (p < 0.01)
Least Squares Method
Least Squares Method
ences in the mean stability of cores between the humanities and the engineering sciences and technologies and the humanities and the medical sciences become statistically significant (p < 0.10). Here, the scientific disciplines of both fields are seen as more stable than the humanities. Since the percentage of out-of-cores researchers forms part of the core stability index, the statistically significant differences between the mentioned scientific fields are mainly the consequence of the splitting of cores. The effects of some controlling explanatory variables are statistically significant at (p < 0.10) as well. When the variable percentage of out-of-cores researchers is included in the model (see Model 1 in Table 14.6), the growth of the density and the average core size in the first time period is statistically significant. The density is defined as the share of all realized ties from all possible ties. The value is typically greater in the case of smaller networks with a low percentage of researchers in the periphery and many cores with a lot of researchers included. Therefore, together with the variable average core size, it can be argued that in the case of greater density there are more researchers who co-authored
CONCLUSIONS
271
only occasionally (semi-periphery) and more complete cores with a higher number of researchers. The probability of creating ties with new researchers is therefore lower and the stability of the cores is higher. Similarly, De Haan et al. [11] mentioned that the size of a research group affects the persistence of collaboration. When the percentage of out-of-cores researchers is included in the model, the growth of density and the percentage of core are statistically significant (p < 0.10) along with the controlling explanatory variable percentage of out-of-cores researchers, which is highly statistically significant (p < 0.01). Since the latter is part of the definition of response variable, the percentage of explained variance of stability of cores is much higher in the model that includes percentage of out-of-cores researchers (Adjusted R2 = 0.65) compared to the model where this variable is not included (Adjusted R2 = 0.23).
14.6
Conclusions
It is crucial to understand how modern science works to ensure appropriate research and development policies are adopted that lead to improved scientific output. Modern information databases containing information about scientific bibliographic units can help in understanding the formation and maintenance of co-authorships among researchers. Although the borderline of scientific collaboration is unclear and there is no accurate way to measure it [22], co-authorships can be seen as a rough operationalization of scientific collaboration, which is one of the primary results of scientific collaboration and represents one of the most formal manifestations of scientific communication [18]. The co-authorship patterns were studied through co-authorship networks. These are networks where the vertices present authors (or researchers) and a link between them exists if they co-authored at least one scientific bibliographic unit. Kronegger et al. [24] analyzed the co-authorship networks of four Slovenian scientific disciplines (physics, mathematics, biotechnology and sociology) in four periods (from 1990 to 2010). Only by observing the number of links among different scientific disciplines could they confirm that different co-authorship cultures exist between ”lab” and ”office” scientific disciplines. Publishing in co-authorship is more common in ”lab” sciences while solo-authored scientific units are more common in ”office” scientific disciplines where teamwork is not so crucial for the research. Hu et al. [20] classified four scientific disciplines in two groups: theoretical disciplines and experimental disciplines. They observed a stronger correlation between collaboration and productivity in experimental disciplines compared to theoretical ones. However, one of the chief interests of the study by Kronegger et al. [24] was on the global network structure. To analyze this, they used generalized blockmodeling on network slices in four 5-year consecutive periods. They confirmed the network structure of multi-cores, semi-periphery, and periphery being present in all scientific disciplines. It can happen that the mentioned structure is not so outstanding at the earliest time points in some scientific disciplines. They defined the core as a group of researchers who very systematically co-author with each other, but who usually do not collaborate with researchers from the other cores. The semi-periphery consists of authors who collaborate with others inside the network, but in a less systematic way. It is not possible to cluster researchers from the semi-periphery into several well-separated clusters. The last part, the periphery, is the biggest part of the analyzed networks. These are authors who publish at least one bibliographic unit but as a single author or with researchers from abroad (with researchers not registered at the Slovenian Research Agency). Besides the main three types of mentioned
272
SCIENTIFIC CO-AUTHORSHIP NETWORKS
positions, they observed so-called bridging cores. These are groups of researchers who collaborate with at least two other cores, which are not connected. Cugmas et al. [9] extended the analysis at the level of all Slovenian scientific disciplines. Like Kronegger et al. [24], they analyzed data for the period between 1991 and 2010, but only analyzed the data in two 10-year long periods. The wider time span has an effect on the network density. Despite this, there are some scientific disciplines without any links in the first or second period, e.g. theology. These kinds of scientific disciplines were removed from the analysis, leaving 43 out of 72 scientific disciplines for further analysis. The assumed multi-core-semi-periphery-periphery structure was confirmed as being present in all analyzed scientific disciplines. In many of them, bridging cores are also found. On average, the number of researchers is increasing in time, also reflected in the higher average core size which is higher in the second period in both scientific disciplines from the fields of the natural and technical sciences and scientific disciplines from the social sciences and humanities. Here, the average size of cores is smaller in the social sciences and humanities in both time periods. The differences may be affected by the fact that authors from abroad are not included in the analysis since the rate of coauthored publications with researchers from abroad is higher in fields of the natural and technical sciences than in the social sciences and humanities. As reported by Kronegger et al. [24], the main part of co-authorship networks is represented by authors from the periphery, which is generally decreasing over time. Another important property of co-authorship networks is that the cores can emerge in time, disappear, split, or merge. To measure the stability of cores, operationalized with these four rules in different ways, several indices were proposed. The value of each was calculated for each scientific discipline and, based on this, the scientific disciplines were clustered in three clusters. The observation of these clusters reveals that, according to the values of the proposed indices, they are mainly characterized by different levels of stability of the clusters and can therefore be ordered from least to most stable. The majority of scientific disciplines were classified in the stable-unstable cluster (22 scientific disciplines) while only a few were classified in the most stable cluster (8 scientific disciplines). It turns out that the average percentage of researchers classified in the cores in both periods is increasing along with the stability of the clusters. On the other hand, the percentage of researchers leaving the cores in the first time period and the percentage of researchers joining the cores in the second period is decreasing with the average stability of cores by the obtained clusters. The average core size is higher in the most stable cluster of scientific disciplines, indicating the existence of well-established scientific research teams in these scientific disciplines. De Haan et al. [11] mentioned that the size of a research group affects the persistence of collaboration. A higher average number of researchers is associated with a lower level of stability of the cores. There are several explanations for this phenomenon, including the fact there are many opportunities to collaborate with different researchers in bigger scientific disciplines. The others are chiefly related to national research and development policies (e.g., the Young Researchers Program) and the nature of the work in such scientific disciplines (e.g., lab vs. office scientific disciplines or natural and technical sciences vs. social sciences and humanities). To explain the differences between the natural and technical sciences and the social sciences and humanities, Cugmas et al. [9] performed a linear regression in which several network- and blockmodel-related variables (number of researchers in the scientific discipline, growth in number of researchers, growth in density, average core size, average percentage of cores, presence of a bridge) were included in the model as explanatory vari-
BIBLIOGRAPHY
273
ables, while the stability of cores (response variable) was operationalized by the MAWS2, where the splitting of cores and out-of-cores researchers reduces the value of an index and thus indicates lower core stability. There were no statistically significant differences in the mean stability of cores between the natural and technical sciences on one hand and the social sciences and humanities on the other. This could be caused by many differences in the publication culture within these two groups of scientific disciplines (which is also a consequence of the characteristics of the particular national classification scheme of scientific fields, disciplines and sub-disciplines). In fact, even within some scientific disciplines the publication cultures vary widely. Moody [34] found that quantitative work is more likely to be co-authored than non-quantitative work in sociology. However, when the analysis is performed on the level of scientific disciplines, the scientific discipline natural sciences and mathematics is statistically significantly (p < 0.10) less stable than the field of the humanities. The growth of density and the average size of cores are also statistically significant (p < 0.05) and positively correlated with the stability of the cores. When the additional variable percentage of out-of-cores researchers is included in the model, the difference in the average stability of cores between the humanities and medical sciences becomes statistically significant (p < 0.10). Here, it must be highlighted that when the variable percentage out-of-cores researchers is included in the model, only the splitting of cores is seen as a features indicating lower core stability.
Bibliography 1. A. Abbasi, J. Altmann, and L. Hossain. Identifying the effects of co-authorship networks on the performance of scholars: A correlation and regression analysis of performance measures and social network analysis measures. Journal of Informetrics, 5 (4):594–607, 2011. 2. A. Abbasi, L. Hossain, and L. Leydesdorff. Betweenness centrality as a driver of preferential attachment in the evolution of research collaboration networks. Journal of Informetrics, 6(3):403–412, 2012. 3. E. M. Airoldi, D. M. Blei, S. E. Fienberg, and E. P. Xing. Combining stochastic block models and mixed membership for statistical network analysis. In Statistical Network Analysis: Models, Issues, and New Directions, pages 57–74. Springer, 2007. 4. C. B. Amat and F. Perruchas. Evolving cohesion metrics of a research network on rare diseases: a longitudinal study over 14 years. Scientometrics, pages 1–16, 2015. 5. V. Batagelj, A. Ferligoj, and P. Doreian. Direct and indirect methods for structural equivalence. Social Networks, 14:63–90, 1992. 6. V. Batagelj, A. Ferligoj, and P. Doreian. Direct and indirect methods for structural equivalence. Social networks, 14(1):63–90, 1992. 7. Z. Chinchilla-Rodr´ıguez, A. Ferligoj, S. Miguel, L. Kronegger, and F. de MoyaAneg´on. Blockmodeling of co-authorship networks in library and information science in Argentina: a case study. Scientometrics, 93(3):699–717, 2012. 8. M. Cugmas and A. Ferligoj. Comparing two partitions of non-equal sets of units. Journal of Classification, 0(0):0–0, 2017.
274
SCIENTIFIC CO-AUTHORSHIP NETWORKS
9. M. Cugmas, A. Ferligoj, and L. Kronegger. The stability of co-authorship structures. Scientometrics, 106(1):163–186, 2016. 10. J. De Haan. Authorship patterns in dutch sociology. Scientometrics, 39(2):197–208, 1997. 11. J. De Haan, F. Leeuw, and C. Remery. Accumulation of advantage and disadvantage in research groups. Scientometrics, 29(2):239–251, 1994. 12. D. de Solla Price. Little science, big science... and beyond. Columbia University Press New York, 1986. 13. P. Doreian, V. Batagelj, and A. Ferligoj. Generalized blockmodeling, volume 25. Cambridge university press, 2005. 14. A. Ferligoj and L. Kronegger. Clustering of Attribute and/or Relational Data. Metodoloˇski Zvezki (Advances in Methodology and Statistics), 6(2):135–153, 2009. 15. A. Ferligoj, L. Kronegger, F. Mali, T. A. Snijders, and P. Doreian. Scientific collaboration dynamics in a national scientific system. Scientometrics, 104(3):985–1012, 2015. 16. K. Frenken, W. H¨olzl, and F. de Vor. The citation impact of research collaborations: the case of european biotechnology and applied microbiology (1988–2002). Journal of Engineering and technology Management, 22(1):9–30, 2005. 17. N. Gask´o, R. I. Lung, and M. A. Suciu. A new network model for the study of scientific collaborations: Romanian computer science and mathematics co-authorship networks. Scientometrics, 108(2):613–632, 2016. 18. B. Groboljsek, A. Ferligoj, F. Mali, L. Kronegger, and H. Iglic. The role and significance of scientific collaboration for the new emerging sciences: The case of slovenia. Teorija in praksa, 51(5):866, 2014. 19. A. Hollis. Co-authorship and the output of academic economists. Labour Economics, 8(4):503–530, 2001. 20. Z. Hu, C. Chen, and Z. Liu. How are collaboration and productivity correlated at various career stages of scientists? Scientometrics, 101(2):1553–1564, 2014. 21. L. Hubert and P. Arabie. Comparing partitions. Journal of classification, 2(1):193– 218, 1985. 22. J. S. Katz and B. R. Martin. What is research collaboration? Research policy, 26(1): 1–18, 1997. 23. J. S. Katz and B. R. Martin. What is research collaboration? Research policy, 26: 1–18, 1997. 24. L. Kronegger, A. Ferligoj, and P. Doreian. On the dynamics of national scientific systems. Quality & Quantity, 45(5):989–1015, 2011. 25. L. Kronegger, F. Mali, A. Ferligoj, and P. Doreian. Collaboration structures in slovenian scientific communities. Scientometrics, 90(2):631–647, 2012.
BIBLIOGRAPHY
275
26. L. Kronegger, F. Mali, A. Ferligoj, and P. Doreian. Classifying scientific disciplines in slovenia: A study of the evolution of collaboration structures. Journal of the Association for Information Science and Technology, 66(2):321–339, 2015. 27. S. Kyvik. Changing trends in publishing behaviour among university faculty, 19802000. Scientometrics, 58(1):35–48, 2003. 28. G. Laudel. What do we measure by co-authorship? Research Evaluation, 11(1):3–15, 2002. 29. S. Lee and B. Bozeman. The impact of research collaboration on scientific productivity. Social studies of science, 35(5):673–702, 2005. 30. F. Mali, L. Kronegger, and A. Ferligoj. Co-authorship trends and collaboration patterns in the Slovenian sociological community. Corvinus Journal of Sociology and Social Policy (CJSSP), 1(2), 2010. 31. C. Matias and V. Miele. Statistical clustering of temporal networks through a dynamic stochastic block model. arXiv preprint arXiv:1506.07464, 2015. 32. G. Melin. Pragmatism and self-organization: Research collaboration on the individual level. Research policy, 29(1):31–40, 2000. 33. G. Melin and O. Persson. Studying research collaboration using co-authorship. Scientometrics, 36(3):363–377, 1996. 34. J. Moody. The structure of a social science collaboration network: Disciplinary cohesion from 1963 to 1999. American sociological review, 69(2):213–238, 2004. 35. B. Ponomariov and C. Boardman. What is co-authorship? Scientometrics, pages 1– 25, 2016. ISSN 1588-2861. doi: 10.1007/s11192-016-2127-7. URL http://dx. doi.org/10.1007/s11192-016-2127-7. 36. W. M. Rand. Objective criteria for the evaluation of clustering methods. Journal of the American Statistical association, 66(336):846–850, 1971. 37. G. Saporta and G. Youness. Comparing two partitions: Some proposals and experiments. In Compstat, pages 243–248. Springer, 2002. 38. R. Tibshirani, G. Walther, and T. Hastie. Estimating the number of clusters in a data set via the gap statistic. Journal of the Royal Statistical Society: Series B (Statistical Methodology), 63(2):411–423, 2001. 39. E. P. Xing, W. Fu, L. Song, et al. A state-space mixed membership blockmodel for dynamic network tomography. The Annals of Applied Statistics, 4(2):535–566, 2010. 40. K. S. Xu and A. O. Hero III. Dynamic stochastic blockmodels: Statistical models for time-evolving networks. In International Conference on Social Computing, Behavioral-Cultural Modeling, and Prediction, pages 201–210. Springer, 2013. ˇ 41. A. Ziberna. Blockmodeling of multilevel networks. Social Networks, 39:46–61, 2014.