in the big data analytics space, make machine learning approaches more ..... The literature review followed the framework proposed by Vom Brocke et al. (2009) ...
Adversarial Deep Learning Against Intrusion Detection Classifiers
Maria Rigaki
Information Security, master's level (120 credits) 2017 Luleå University of Technology Department of Computer Science, Electrical and Space Engineering
“It is a capital mistake to theorize before one has data. Insensibly one begins to twist facts to suit theories, instead of theories to suit facts.”
Sherlock Holmes, A Scandal in Bohemia
Abstract Traditional approaches in network intrusion detection follow a signature-based approach, however the use of anomaly detection approaches based on machine learning techniques have been studied heavily for the past twenty years. The continuous change in the way attacks are appearing, the volume of attacks, as well as the improvements in the big data analytics space, make machine learning approaches more alluring than ever. The intention of this thesis is to show that using machine learning in the intrusion detection domain should be accompanied with an evaluation of its robustness against adversaries. Several adversarial techniques have emerged lately from the deep learning research, largely in the area of image classification. These techniques are based on the idea of introducing small changes in the original input data in order to make a machine learning model to misclassify it. This thesis follows a big data Analytics methodology and explores adversarial machine learning techniques that have emerged from the deep learning domain, against machine learning classifiers used for network intrusion detection. The study looks at several well known classifiers and studies their performance under attack over several metrics, such as accuracy, F1-score and receiver operating characteristic. The approach used assumes no knowledge of the original classifier and examines both general and targeted misclassification. The results show that using relatively simple methods for generating adversarial samples it is possible to lower the detection accuracy of intrusion detection classifiers from 5% to 28%. Performance degradation is achieved using a methodology that is simpler than previous approaches and it requires only 6.25% change between the original and the adversarial sample, making it a candidate for a practical adversarial approach.
Acknowledgements I would like to thank my thesis supervisor, Dr. Ahmed Elragal for his guidance and helpful directions throughout the duration of this study. Furthermore, I would like to thank my colleagues and friends for their continuous support and immense tolerance for the past two years, without which it would not have been possible to finalize my studies and this work.
iii
Contents Abstract
ii
Acknowledgements
iii
List of Figures
vi
List of Tables
vii
Abbreviations
viii
Symbols
x
1 Introduction 1.1 Intrusion Detection . . . . . . . . . . . . . . . . . . . . . . . . . . . . . 1.2 Big Data Analytics . . . . . . . . . . . . . . . . . . . . . . . . . . . . . 1.3 Overview . . . . . . . . . . . . . . . . . . . . . . . . . . . . . . . . . . .
1 2 2 3
2 Literature Review 2.1 Intrusion Detection . . . . . . . . . . . . 2.1.1 IDS Datasets . . . . . . . . . . . 2.2 Adversarial Machine Learning . . . . . . 2.2.1 Threat Models . . . . . . . . . . 2.2.2 Attack Types . . . . . . . . . . . 2.2.3 Adversarial Deep Learning . . . . 2.2.4 Mitigations . . . . . . . . . . . . 2.2.5 Information Security Applications 2.3 Research Questions . . . . . . . . . . . . 3 Methodology 3.1 Guidelines . . . . . . . . . . . . . . . . 3.1.1 Research Question Guidelines . 3.1.2 Data Collection Guidelines . . . 3.1.3 Data Analysis Guidelines . . . . 3.1.4 Result Interpretation Guidelines 3.2 Activities . . . . . . . . . . . . . . . . iv
. . . . . .
. . . . . . . . .
. . . . . .
. . . . . . . . .
. . . . . .
. . . . . . . . .
. . . . . .
. . . . . . . . .
. . . . . .
. . . . . . . . .
. . . . . .
. . . . . . . . .
. . . . . .
. . . . . . . . .
. . . . . .
. . . . . . . . .
. . . . . .
. . . . . . . . .
. . . . . .
. . . . . . . . .
. . . . . .
. . . . . . . . .
. . . . . .
. . . . . . . . .
. . . . . .
. . . . . . . . .
. . . . . .
. . . . . . . . .
. . . . . .
. . . . . . . . .
. . . . . .
. . . . . . . . .
. . . . . .
. . . . . . . . .
4 4 6 7 7 9 9 12 13 13
. . . . . .
15 15 15 16 17 17 17
Contents
v . . . . . .
18 19 19 20 21 21
4 Data Collection and Analysis 4.1 KDD’99 and NSL-KDD . . . . . . . . . . . . . . . . . . . . . . . . . . 4.2 Data Preprocessing . . . . . . . . . . . . . . . . . . . . . . . . . . . . .
22 22 24
5 Results 5.1 Baseline Models . . . . . . . . . . . . . 5.2 Adversarial Test Set Generation . . . . 5.3 Model Evaluation on Adversarial Data 5.4 Feature Evaluation . . . . . . . . . . .
. . . .
. . . .
. . . .
. . . .
. . . .
. . . .
. . . .
. . . .
. . . .
. . . .
. . . .
. . . .
. . . .
. . . .
. . . .
. . . .
. . . .
. . . .
25 25 25 26 27
6 Discussion 6.1 Data Modeling . . . . . . . . . . . . . 6.2 Adversarial Test Set Generation . . . . 6.3 Model Evaluation on Adversarial Data 6.4 Feature Evaluation . . . . . . . . . . . 6.5 Contributions . . . . . . . . . . . . . .
. . . . .
. . . . .
. . . . .
. . . . .
. . . . .
. . . . .
. . . . .
. . . . .
. . . . .
. . . . .
. . . . .
. . . . .
. . . . .
. . . . .
. . . . .
. . . . .
. . . . .
. . . . .
29 29 29 29 30 31
7 Conclusion 7.1 Future Work . . . . . . . . . . . . . . . . . . . . . . . . . . . . . . . . .
32 33
A Source Code
34
References
42
3.3
3.2.1 Step 1: Gap Analysis . . . . . . . . . 3.2.2 Step 2: Data Collection and Analysis 3.2.3 Step 3: Data Modeling . . . . . . . . 3.2.4 Step 4: Evaluation . . . . . . . . . . 3.2.5 Step 5: Reporting . . . . . . . . . . . Assumptions and Delimitation . . . . . . . .
. . . . . .
. . . . . .
. . . . . .
. . . . . .
. . . . . .
. . . . . .
. . . . . .
. . . . . .
. . . . . .
. . . . . .
. . . . . .
. . . . . .
. . . . . .
. . . . . .
List of Figures 2.1 2.2 2.3 2.4 2.5 2.6
Adversarial Machine Learning . . . . . . . . . . . . . Threat Model Taxonomy . . . . . . . . . . . . . . . . Adversarial example produced by image perturbation Images generated using evolutionary algorithms . . . Generating adversarial samples with FGSM . . . . . Generating adversarial samples with JSMA . . . . . .
. . . . . .
. . . . . .
. . . . . .
. . . . . .
. . . . . .
. . . . . .
. . . . . .
. . . . . .
. . . . . .
. . . . . .
7 8 10 10 11 12
3.1 3.2 3.3 3.4
Process steps . . . . . . . . . . . . . . . Baseline model training . . . . . . . . . . Adversarial sample generation . . . . . . Testing baseline models using adversarial
. . . .
. . . .
. . . .
. . . .
. . . .
. . . .
. . . .
. . . .
. . . .
. . . .
18 20 20 21
5.1 5.2 5.3 5.4 5.5
Decision Tree ROC curves . . . . . . . . . . . . . . SVM ROC curves . . . . . . . . . . . . . . . . . . . Random Forest ROC curves . . . . . . . . . . . . . Voting Ensemble ROC curves . . . . . . . . . . . . Most used features in adversarial sample generation
. . . . .
. . . . .
. . . . .
. . . . .
. . . . .
. . . . .
. . . . .
. . . . .
. . . . .
. . . . .
26 26 27 27 28
vi
. . . . . . . . . . . . . . . . . . . . . test samples . . . . .
List of Tables 2.1 2.2
Security related datasets . . . . . . . . . . . . . . . . . . . . . . . . . . Security applications of adversarial ML . . . . . . . . . . . . . . . . . .
7 13
3.1
Confusion matrix . . . . . . . . . . . . . . . . . . . . . . . . . . . . . .
18
4.1
KDD’99 and NSL-KDD features . . . . . . . . . . . . . . . . . . . . . .
23
5.1 5.2 5.3 5.4 5.5 5.6
Test set results for 5-class classification . . . . . . . Adversarial feature statistics . . . . . . . . . . . . . Data point x(17) in original test set . . . . . . . . . (17) Transformation of data point xadv using JSMA . . Adversarial test set results for 5-class classification . Top 10 adversarial features using JSMA . . . . . .
25 25 26 26 26 28
vii
. . . . . .
. . . . . .
. . . . . .
. . . . . .
. . . . . .
. . . . . .
. . . . . .
. . . . . .
. . . . . .
. . . . . .
. . . . . .
Abbreviations AD
Anomaly Detection
ANN
Artificial Neural Network
AUC
Area Under Curve
BDA
Big Data Analytics
CMU
Carnegie Mellon University
CART
Classification And Regression Tree
DT
Decision Tree
DL
Deep Learning
DoS
Denial of Service
FN
False Negative
FP
False Positive
FPR
False Positive Rate
FGSM
Fast Gradient Sign Method
HMM
Hidden Markov Model
HTTP
Hyper Text Transfer Protocol
IDS
Intrusion Detection System
IRC
Internet Relay Chat
IS
Information Security
JSMA
Jacobian-based Saliency Map Attack
KDD
Knowledge Discovery in Databases
LANL
Los Alamos National Lab
LTU
Lule˚ a Tekniska Universitet
ML
Machine Learning
MLP
Multi Layer Perceptron viii
Abbreviations
ix NPV
Negative Predictive Value
NIDS
Network Intrusion Detection System
OvR
One vs Rest
PPV
Positive Predictive Value
ROC
Receiver Operating Characteristic
R2L
Remote to Local
SSH
Secure SHell
SVM
Support Vector Machine
TN
True Negative
TP
True Positive
TPR
True Positive Rate
UNB
University of New Brunswick
U2R
User to Root
Symbols Datasets x(i)
The i-th example (input) from a dataset
y(i)
The target associated with x(i) in supervised learning
X
The m × n matrix with input example x(i) in row Xi,:
δ (i)
The calculated perturbation for the i-th input example from the test set
Calculus f : A → B Function f with domain A and range B ∇x y
Gradient of y in respect to x
x
Chapter 1 Introduction Despite the security measures deployed in enterprise networks, security breaches are still a source of major concern. Malicious activities within a network can be categorized based on the origin of the attacker as: • Activities that originate from external users that have the intention or manage to get access to the internal network. This could happen via a breach in the network perimeter via malware, phishing attacks, social engineering and so on. Once malicious users have breached the perimeter, they can be difficult to distinguish from normal users since most often they use normal user or administrator credentials. This category includes also intruders that manage to install and operate malicious software that acts autonomously or semi-autonomously in the network such as bots. • Activities that originate from insiders that have motive and opportunity to misuse, attack or steal information. This is the so called insider threat. Regardless of the origin of malicious activities or the way the attackers manage to infiltrate a network, there are certain behavioral patterns that most attackers exhibit within the cyber-attack life cycle (Stallings and Brown, 2015): • Information gathering • Initial compromise • Privilege escalation • Further information gathering • System exploit or lateral movement • Maintaining access and covering tracks
1
Chapter 1 Introduction
2
Similar variants of the above list exist in many parts of vendor literature and the main source of reference is the intrusion detection kill-chain introduced by Hutchins et al. (2011). Although the initial compromise stage can be accomplished in numerous ways and the different types of attacks and malware change very often, the lateral movement and privilege escalation stages are most likely present in the majority of compromises and origins, mainly because external and internal attackers tend to seek access to valuable information that requires specific privileges. This type of behavior might be less representative of the bot behavior, though. Of course, the behaviors exhibited in the latter stages of an attack are not always easy to separate from normal user behavior. The discussion often revolves around the questions of how often is malicious behavior anomalous? and vice versa; how often is anomalous behavior malicious? (Claycomb et al., 2014). The answers to these questions depend both on the capabilities and methods used to discern the two behavioral patterns as well as on the data we gather and the patterns that exist within the data.
1.1
Intrusion Detection
Intrusion detection is dealing with unwanted access to systems and information by any type of user or software. If the Intrusion Detection System (IDS) is placed in such a way that has the ability to stop attacks it is called an Intrusion Prevention System (IPS). There are two major categories of IDS: • Network IDS, which monitor network segments and analyze network traffic at different layers in order to detect intruders. • Host based IDS, which are installed in host machines and they try to determine malicious activities based on different indicators such as processes, log files, unexpected changes in the host and so on. In large enterprise networks the amount of network traffic that is generated on a daily basis, requires consideration about gathering, storing and processing of said traffic. While one approach is to discard parts of the data or log less information, the emergence of Big Data Analytics (BDA) as well as the improvement in computing power, memory and the decrease in storage costs, transforms the situation into a big data problem.
1.2
Big Data Analytics
Big Data are characterized by the presence of the four V’s: • Volume The amount data at rest.
Chapter 1 Introduction
3
• Velocity The amount of data in motion and the speed of response necessary. • Variety The different forms of data types and sources. • Veracity The uncertainty in the data. When it comes to information security, it is apparent that especially in the large enterprise domain the first three of the four V’s, namely Volume, Velocity and Variety are present. The amount of data produced on a daily basis by various security components as well server and other host machines is not only quite large but it is generated in high speeds. When it comes to variety, network traffic data, exhibit variety at many different levels and they are highly unstructured. Regardless of the specific data set used for Intrusion detection analysis, the nature of the data associated with this class of problems exhibits certain general characteristics: • Data are generated constantly and there is a time series nature (continuous or discrete based on the data set and the processing approach. • There are connections between entities that appear in the data or generate the data such computers and users. • Lack of labels or very few positive labels (class imbalance). • Novel types or variations of attacks appear all the time. • Variety in the type of data: packets, flows, numerical, unstructured text (URLs) and so on. Traditional approaches in the area of intrusion detection mainly revolve around signature and rule based approaches, which have the limitation that they work only with known attack patterns and that they require extensive domain knowledge (Chuvakin et al., 2012). Anomaly detection techniques based on statistical or machine learning approaches promise more flexibility and less dependency in domain knowledge and are more scalable when it comes to big data. Using BDA methods seems like a very likely approach as the amount and speed of data generated is expected to increase further in the future. However, one has to question not only the performance of the BDA methods proposed, but also their stability and robustness against adversaries that will most certainly try to attack them
1.3
Overview
The rest of the document presents an in-depth review of previous research work in the area of adversarial machine learning and its application in information security and the research methodology followed, including the detailed process and activities and the results of the study. The document closes with the critical review of the results and the final conclusions and proposed future work.
Chapter 2 Literature Review The literature review followed the framework proposed by Vom Brocke et al. (2009), which includes a definition of the scope and a conceptualization phase, followed by literature search and subsequent analysis and synthesis of the material in order to fulfill the research agenda. In this study, the purpose of the review was to identify research gaps that allowed the formulation of the research questions that the study attempted to answer. The literature review was conducted using exhaustive search over the following terms: ”machine learning AND cyber/information security”, ”machine learning AND IDS”, ”anomaly detection AND cyber/information security” and ”adversarial machine learning”. Apart from keyword search and relevance, other selection criteria were chronological (the majority of papers were written after 2010) and the quality of sources (peer reviewed journals and conferences). The search engines utilized for this search were mainly the LTU library search and Google scholar search engines which aggregate results over a number of databases. The majority of the references comes from well known databases such as ACM, IEEE, Springer and Elsevier. A number of existing surveys were used as a basis especially in the domain of intrusion detection. These surveys were augmented by articles that were either missing or were published more recently. Forward search was performed for highly cited papers. Backward search was conducted to review articles or papers that were of high relevance to the subject of the current study.
2.1
Intrusion Detection
When it comes to categorization of techniques and methodologies used in NIDS the vast majority of the literature agrees in the following categorizations: • Misuse-based or signature based are the systems that use signatures or indicators extracted from previously known attacks. These signatures are manually 4
Chapter 2 Literature Review
5
generated every time a new attack appears and their maintenance especially with the increased rate of attacks we see today, is becoming a concern. • Anomaly based systems are the ones that try to model normal behavior in a network in contrast to what is anomalous and potentially malicious. While these systems promise the ability to adapt to new attacks, one of the major concerns is the definition of what constitutes anomalous behavior and whether or not malicious behavior is in fact anomalous and vice versa. • Hybrid systems is the combination of the above approaches. One of the most recent surveys on NIDS and BDA is the one from Buczak and Guven (2016). The survey is quite comprehensive and examines a big number of Data Mining (DM) and Machine Learning (ML) methodologies such as: Artificial Neural Networks (ANN), association rule mining, Bayesian networks, clustering, Decision Trees (DT), ensemble learning, evolutionary computation, Hidden Markov Models (HMM), Naive Bayes and Support Vector Machines (SVM). Unfortunately, the decision of the authors to include only papers with a high number of citations, led them to ignore work that has been performed in recent years. A notable example is that all papers in the area of Artificial Neural Networks are from the years 1998-2002, while there is some work that has been done in the recent years especially in the area of Deep Learning (DL) such as Fiore et al. (2013), Gao et al. (2014). While in most literature the terms Anomaly Detection and Machine Learning are used interchangeably, Bhuyan et al. (2014) make a broader presentation that includes not only classifiers such as the ones used in ML and DM but also pure anomaly detection techniques such as statistical methods, clustering and outlier based methods, soft computing, knowledge based and combination learners. AD based systems promise to solve the issue of adaptation to new attacks, however, it is difficult to prove that they can generalize well enough to be widely used in practice. The challenges presented by Sommer and Paxson (2010) are still relevant today. These challenges include: • the data used to train the models are unsuitable for supervised classification methods because they are very imbalanced, • high cost of errors in the sense that someone is required to look into each alarm generated by a NIDS, therefore, time and fatigue can be a problem if the False Positive Rate (FPR) of the system is high, • interpretation of the results and taking action is not always possible with some ML techniques, • network traffic diversity within an organization or between organizations, • difficulty of evaluation of different approaches due to the lack of high quality representative datasets.
Chapter 2 Literature Review
6
When it comes to evaluation metrics used in the majority of studies, Milenkoski et al. (2015) identified four major categories: 1. Attack detection accuracy with most common metrics the False Positive, False Negative, True Positive and True Negative rates, the Positive Predictive Value (PPV) or precision and the Negative Predictive Value (NPV). The False Positive Rate (FPR) and the True Positive Rate (TPR) are used in the construction of Receiver Operating Characteristic (ROC) curves and the calculation of the Area Under the Curve (AUC). 2. Attack coverage, which is the detection accuracy of the IDS without benign traffic. 3. Performance overhead which the IDS is adding to the overall network environment. 4. Workload processing, which is the amount of traffic that can be processed by an IDS vs. the amount of network traffic the IDS discards.
2.1.1
IDS Datasets
Another point where most surveys agree upon is the sparsity of good quality datasets (Sommer and Paxson, 2010, Ahmed et al., 2016, Buczak and Guven, 2016). One of the most used dataset is KDD’99 (KDD Cup 1999 Data, 1999) which was derived from the DARPA’98 dataset. The dataset was used in a competition that was held during the Fifth International Conference on Knowledge Discovery and Data Mining and the main competition task was to create a predictive model that can be used in network intrusion detection. Further analysis by various researchers such as McHugh (2000), Sommer and Paxson (2010), Brugger and Chow (2007) and Tavallaee et al. (2009) revealed that KDD’99 suffers from several shortcomings. Tavallaee et al. (2009) focused on two major issues: a) that there were a lot of duplicate records both on the training and the test set and b) that some categories of attacks were too easy to detect due to dataset imbalance. In order to overcome these two issues they created an improved version of the KDD99 data set which was called NSL-KDD (Tavallaee et al., 2009). This change did not address all issues with KDD’99 and more importantly it did not erase the fact that it is quite outdated. In table 2.1 there is a list of security datasets that have been used in different studies. Other datasets that are mentioned in the literature but have not been examined in this study are the CAIDA and DEFCON datasets, but it was not possible to evaluate, because they we restricted or publicly unavailable.
Chapter 2 Literature Review Source Type KDD’99 NIDS NSL-KDD NIDS UNB NIDS (flows) CTU-13 Botnet LANL Multi-source CMU CERT Insider threat Uni of Victoria Botnet Kyoto 2006 NIDS
7 Labeled Yes Yes Yes Yes Yes Yes Yes No
Reference KDD Cup 1999 Data (1999) NSL-KDD dataset (2009) Intrusion detection evaluation dataset (2012) CTU-13 dataset (2014) Kent (2016) Glasser and Lindauer (2013) Saad et al. (2011) Song et al. (2011)
Table 2.1: Security related datasets
2.2
Adversarial Machine Learning
Adversarial Machine Learning (AML) is the study of machine learning in the presence of an adversary that works against the ML system in an effort to reduce its effectiveness or extract information from it.
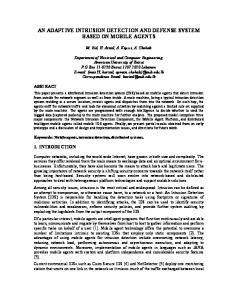
Figure 2.1: Adversarial Machine Learning
All aspects and phases of the machine learning process can be attacked by an adversary as can be seen in Figure 2.1.
2.2.1
Threat Models
Barreno et al. (2006) introduced a qualitative taxonomy for the threat models against machine learning systems which placed the attacks in three axes: • Influence can be either causative or exploratory. A causative influence can affect the learning process, while an exploratory attack only deals with a trained classifier. Attacks that affect the learning process have also been categorized as poisoning and attacks that are used only at test time have also been described as evasion attacks.
Chapter 2 Literature Review
8
• Security violations can be integrity related when the adversary can cause misclassifications of attacks to appear as normal and availability related when the misclassifications are so many that the system becomes unusable. • Specificity can be targeted when it focuses on specific misclassifications or indiscriminate where it does not matter which classes are being misclassified. The same taxonomy was used by Huang et al. (2011) which extended it further to include privacy as a security violation when the adversary is able to extract information from the classifier. Huang et al. (2011) also introduced a few interesting considerations in regards to the constraints of the attackers when it comes to data manipulation, as well as the importance of application specific constraints, a consideration which is very relevant to the study of ML classifiers in the NIDS domain. Another taxonomy which was introduced by Papernot, McDaniel, Jha, Fredrikson, Celik and Swami (2016) is depicted in Figure 2.2 and focuses on two axes: • Complexity of the attack which ranges from simple confidence reduction to complete source / target misclassification. • Knowledge of the attacker which ranges from knowledge about architecture, training tools and data to just knowledge of a few samples.
Figure 2.2: Threat Model Taxonomy.1 1
From Papernot, McDaniel, Jha, Fredrikson, Celik and Swami (2016)
Chapter 2 Literature Review
9
If the attacker knows anything regarding the architecture, the training data or the features used, the attack is considered a white-box attack. If the adversary’s knowledge is limited to Oracle attacks or she has only access to limited number of samples, the attack is considered a black-box attack.
2.2.2
Attack Types
Viewing the problem from the attacker perspective we categorized the attacks as poisoning ar evasion ones. Different poisoning attacks have been described in Biggio et al. (2012) and Xiao et al. (2015). Both studies try to poison the training data in different ways. Xiao et al. (2015) devised attacks against linear classifiers such as Lasso and Ridge by maximizing the classification error with regards to the training points, while Biggio et al. (2012) attacked Support Vector Machines (SVM) by injecting samples to the training set in order to find the attack point that will maximize the classification error. Evasion attacks have been studied in Biggio et al. (2013), Biggio, Fumera and Roli (2014) and Ateniese et al. (2015). The latter proposed a methodology which requires the generation of multiple training sets and subsequently the creation of several classifiers which are combined to create a meta-classifier. This meta-classifier is used in order to extract statistical properties from the data but not the features themselves, which makes it an attack against privacy.
2.2.3
Adversarial Deep Learning
Deep Learning (DL) methods have been wildly successful in recent years especially in areas such as computer vision and speech recognition. As part of this development, Adversarial Deep Learning (ADL) have also surfaced, mostly centered around the computer vision domain. Recently, it was shown that making very small variations on an image, one could fool a Deep Learning model to misclassify it (Szegedy et al., 2013). The variations can be small enough that can be imperceptible to humans. Examples of such images can be seen in Figure 2.3. On another direction, it was also shown that it is possible to generate images that look like noise or have various non-descript patterns which can fool a model to classify them in a certain class with a very high confidence (Nguyen et al., 2015). Examples of this type of adversarial images can be seen in Figure 2.4. Although different explanations have been provided to why is this happening, the consensus, contrary to the intuition of many people, is that it is the high degree of linearity of modern Deep Learning model components that is the main cause (Goodfellow et al., 2014). Neural Networks are purposefully devised to display linear properties or use piece wise linear activations such as Rectified Linear Units (ReLUs) in order to achieve 2 3
From Szegedy et al. (2013). From Nguyen et al. (2015).
Chapter 2 Literature Review
Figure 2.3: Adversarial example produced by image perturbation. The neural network believes the images on the right are ostriches.2
10
Figure 2.4: Images generated using evolutionary algorithms.3
faster optimization. This linearity also seems to create decision boundaries that define much larger areas than the training data. Hence, when new data appear that display certain properties they can get misclassified (Goodfellow et al., 2014, Nguyen et al., 2015). Furthermore, images that display adversarial properties in one neural network, have shown to transfer these properties to other neural networks trained separately (Szegedy et al., 2013, Goodfellow et al., 2014, Nguyen et al., 2015). It is not only Deep Learning models that are vulnerable to adversarial samples. Shallow linear models are also plagued by the same problem and so are model ensembles. The only models that have shown some resistance to adversarial samples are Radial Basis Function (RBF) networks, however, they cannot generalize very well (Goodfellow et al., 2014). The method to produce adversarial samples is also a studied subject. Several methods have been proposed so far which trade on complexity, speed of production and performance: • Evolutionary algorithms were proposed in (Nguyen et al., 2015) but the method is relatively slow compared to the two other alternatives. • Fast Gradient Sign method Method (FGSM) proposed by Goodfellow et al. (2014). • Jacobian-based Saliency Map Attack (JSMA) (Papernot, McDaniel, Jha, Fredrikson, Celik and Swami, 2016) is more computationally expensive than the fast gradient sign method but it has the ability to create adversarial samples with less degree of distortion. Both the FGSM and JSMA methods try to generate a small perturbation in the original sample so that it will exhibit adversarial characteristics. In FGSM a perturbation δ is
Chapter 2 Literature Review
11
generated by computing the gradient of the cost function J in respect to the input x: δ = �sign(∇x J(θ, x, y)) where θ are model parameters, x is the input to the model, y the labels associated with x, � a very small value and J(θ, x, y) is the cost function used when training the neural network. The gradient component can be computed very fast from the neural network using backpropagation, which is what makes this method very fast. The perturbation is then added to the initial sample and the final result produces a misclassification. An illustrative example is shown in Figure 2.5.
Figure 2.5: Generating adversarial samples with FGSM.4
JSMA is generating adversarial sample perturbations based on the concept of saliency maps. A saliency map is used in order to calculate the direction sensitivity of the sample in regards to the target class. In other words the method tries to find which input dimensions or features will be most likely to create a targeted class change. Using this sensitivity map one ore more features are chosen as the possible perturbations and the model is checked to establish whether or not this change resulted to a misclassification. If not, the next most sensitive feature is selected and a new iteration occurs until an adversarial sample that can fool the network is generated (Papernot, McDaniel, Jha, Fredrikson, Celik and Swami, 2016). The process is illustrated in Figure 2.6. Since the method usually takes a number of iterations, it is not as fast as JSMA. Both FGSM and JSMA operate under the threat model of a strong attacker, e.g. an attacker that has knowledge of at least the underlying model. However, a more relaxed threat model does not preclude the possibility of success. A weaker attacker which has only access to the model output and has some knowledge of the expected input, can use the network model as an Oracle. Generating a limited number of outputs is enough to create an approximation of the Oracle. Due to the transferability property it is possible for the attacker to craft adversarial samples on the approximated model which can later be used as attack vectors against the original model (Papernot, McDaniel, Goodfellow, Jha, Celik and Swami, 2016). 4 5
From Goodfellow et al. (2014). From Papernot, McDaniel, Jha, Fredrikson, Celik and Swami (2016).
Chapter 2 Literature Review
12
Figure 2.6: Generating adversarial samples with JSMA.5
An even weaker threat model is that in which the attacker has no access to the underlying model. Examples of these types of situations come from the physical domain, for example face or voice recognition systems. An attacker that can craft adversarial samples without access or knowledge of the underlying model or system could potentially fool these systems. A successful attempt of such a type of attack was demonstrated by Kurakin et al. (2016). The concept of transferability was thoroughly tested by Papernot, McDaniel and Goodfellow (2016). The authors tested several classifiers both as source for adversarial sample generation as well as target models. However, the testing was confined to image classifiers.
2.2.4
Mitigations
In the Deep Learning front there have been proposed a number of mitigations against adversarial samples, with the most promising one being the use of a technique called distillation (Papernot, McDaniel, Wu, Jha and Swami, 2016). Distillation is a methodology that was introduced in order to decrease the size of the networks in parameters and computational complexity, but still retain most of its performance. Using distillation for defensive purposes shows promising results but this comes to the expense of total network performance. A few other approaches were proposed by Goodfellow et al. (2014): the first was to use the adversarial samples in order to train the initial model as an attempt to reduce the effect. This method had the positive effect that drove the model to generalize better than before, but unfortunately the robustness against adversarial samples did not improve as dramatically. The second approach was to incorporate an adversarial component on the loss function used during training. All, the above mitigations as well as simple feature reduction were used in the malware domain (Grosse et al., 2016). The results reported by the authors showed that contrary to the computer vision domain, distillation did not perform as strongly, while re-training the model with adversarial samples showed better results. This shows that at the moment there is no generally applicable defense against adversarial attacks.
Chapter 2 Literature Review
13
As different mitigations proposed have not been proven widely successful, another area of research focused on detection as a way to defend against adversarial attacks. However, as shone by Carlini and Wagner (2017), this might not be an easy task, either.
2.2.5
Information Security Applications
When it comes to Adversarial Deep Learning, the domain of the different attacks and adversarial sample generation has mainly revolved around the area of image classification and computer vision. Recent work has shown that it is also possible to create adversarial samples against neural network malware classifiers (Grosse et al., 2016). In general, it is still quite unclear whether or not there will be wide applicability in the phenomenon of Adversarial Deep Learning given that some domains including NIDS require a more specialized approach in sample generation and have very specific constraints. Other applications of general AML in security involve spam classifiers, malware analysis, biometrics and network traffic identification. Table 2.2 summarizes the application domains that has been studied in the past. As it can be seen, there are only two studies related to Intrusion detection and they both assume a causative influence model. Application Malware analysis Spam bayes classifier Biometrics Intrusion detection Traffic identification
References Biggio, Rieck, Ariu, Wressnegger, Corona, Giacinto and Roli (2014), Grosse et al. (2016) Nelson et al. (2008), Zhou et al. (2012), Huang et al. (2011) Biggio, Fumera and Roli (2014) Biggio, Fumera and Roli (2014), Huang et al. (2011) Ateniese et al. (2015)
Table 2.2: Security applications of adversarial ML
2.3
Research Questions
A number of gaps have been identified as part of the literature review: • ML classifiers are used widely in NIDS literature but there does not seem to be a lot of studies in terms of attacks against them. • A lot of the research that has been done regarding adversarial methods assumes an attacker with knowledge of the models used or access to the training data and ability to perform poisoning attacks. • Deep Learning approaches have not been tested in the NIDS domain so far.
Chapter 2 Literature Review
14
The gaps lead us to the following research questions: • How robust are machine learning classifiers used in NIDS against adversarial attacks? More specifically: – How effective are adversarial attacks based on deep learning derived methods? – Which of the attack methods is most applicable to NIDS? – How can the transferability concept be used in the NIDS domain under a weak attacker model? In other words, how can we generate adversarial attack samples without having knowledge of the exact classifier used and potentially no access to training data?
Chapter 3 Methodology The methodology chosen for this study is based on Big Data Analytics (BDA) which is chosen mainly because the data in dynamic networks and intrusion detection settings satisfy at least the three V’s (Volume, Velocity and Variety) of Big Data. The second reason for this choice is the fact that traditional approaches in NIDS (misuse approaches) require manual intervention and they will have a difficulty to keep up with the daily barrage of new attacks that we observe every day. This chapter provides the theoretical background for the chosen methodological approach by explaining how the study adheres to guidelines proposed in previous Information Systems (IS) research. It also contains details about the activities performed based on the chosen methodology.
3.1
Guidelines
M¨ uller et al. (2016) proposed a number of guidelines relevant to BDA research for use in IS research. The most applicable guidelines to this study are presented and analyzed in the following sections.
3.1.1
Research Question Guidelines
• Research can start with data instead of theory: Although there have been several attempts to theorize about the way an intrusion is detected based on attacker behavior, Intrusion Detection is still an area where data-driven approaches dominate in the field. Misuse based approaches are highly empirical in nature and are based on extracting information from data in order to distinguish attacks from normal traffic. Similarly, anomaly detection approaches are largely based on ML or AD methods which are data driven as well. This work is focused on ML based detectors and are purely data-driven.
15
Chapter 3 Methodology
16
• Theoretical triangulation: The research questions were formulated after a thorough Literature Review (see chapter 2) and are based on research gaps that were discovered during said review. • Explanatory versus predictive research: The nature of the underlying ML models which are examined for their robustness against adversarial ML attacks is clearly predictive. Their main purpose is to produce classifiers that can predict anomalous (attack) traffic for previously unknown data and not to explain the data and generate hypotheses. Similarly, the examination of their robustness revolves around their capability to predict. However, the problem of generating adversarial samples is a generative problem which is closer to exploratory research in the sense that one has to address the fundamental question about whether the problem actually exists, e.g. can the adversarial methods used in DL be used against against ML classifiers employed by a NIDS. Since this thesis is not concerned in creating a new adversarial test set generation methodology, but focuses mostly on robustness of predictive algorithms, we treat the work as mostly predictive research. • Iterative process: The methodology followed involved several steps as outlined in 3.2. Several of these steps are iterative in nature, for example the data modeling step. The whole process is also iterative in the sense that some steps might circle back to a previous step. During this study, several iterations occurred, especially after the result evaluation which led back to data analysis and modeling and so on. • Theoretical contribution: The research performed aimed in addressing the research gaps identified in the literature and present some novel contributions in the field. Detailed discussion on the contributions can be found in section 6.5.
3.1.2
Data Collection Guidelines
• Justify the selection of big data as the primary data source: The selection of big data as primary source is justified due to the existence of big data characteristics and due to limitations of the existing signature-based methods. • Discuss the nature of data in terms of its variability and reliability: Network traffic data is the primary source used for this study. In terms of variability, the dataset covers a lot of different attack scenarios as well as background traffic, however as discussed earlier, it might not be representative of newer attacks and therefore not as reliable. However, since the dataset is not used in order to develop novel classifiers and given the lack for better options, it was considered as reliable enough for the purpose of the study. • Document the data collection in detail: The data collection has been described in detail in Tavallaee et al. (2009), McHugh (2000) • Provide access to the data used: The dataset used is a publicly available dataset which can be requested from the authors (Tavallaee et al., 2009).
Chapter 3 Methodology
3.1.3
17
Data Analysis Guidelines
• Document the data pre-processing steps in detail: The data preprocessing steps are documented in full detail in chapter 4.2. • Algorithms evolve, ensure their validity based on disciplines such as computer science and machine learning: All machine learning algorithms used are based in well known Python libraries which are widely used in Machine Learning research. All data pre-processing was performed in pandas (McKinney, 2011), the base classifiers were based on scikit-learn (Pedregosa et al., 2011), the deep learning adversarial methods were based on cleverhans (Papernot, Goodfellow, Sheatsley, Feinman and McDaniel, 2016) which in turn is based on tensorflow (Abadi et al., 2015) and keras (Chollet, 2015). • Provide access to the algorithms: The source code used to obtain the results presented in the thesis is provided in Appendix A.
3.1.4
Result Interpretation Guidelines
• Add explanatory phase in order to make black box algorithms ”transparent”: An effort was made in this study to try and analyze the results, especially when it comes to the features more commonly affected by the generation of the adversarial test set and how they can be abused by an adversary (see discussion in 6.4) • Theoretical triangulation of the results: The results were analyzed and connected to previous studies, especially regarding the methodology of generating adversarial test sets (see discussion in chapter 6.2) and the robustness of the different classifiers against adversarial test sets (see discussion in chapter 6.3)
3.2
Activities
The research was conducted in a series of steps as listed below. • Step 1 Gap analysis and objectives definition • Step 2 Data analysis and preprocessing • Step 3 Data modeling • Step 4 Evaluation of results • Step 5 Reporting As depicted in Figure 3.1, the process followed was iterative especially when it comes to steps 1 to 4. The activities performed in each step are detailed in the following sections.
Chapter 3 Methodology
18
Figure 3.1: Process steps
3.2.1
Step 1: Gap Analysis
The first in the study was the literature review as presented in chapter 2. The review of past research identified gaps which were used in order to formulate the research questions that the study tried to address. In order to answer the research questions, the following objectives were set: Objective 1: Analysis of the latest methods in adversarial samples generation and their suitability in NIDS applications. Objective 2: Analysis of the robustness of various classifiers against adversarial test sets in terms of classification accuracy, F1 -score and Area Under the Curve (AUC). Accuracy was chosen because it gives a simple oversight of the performance of the classifier, while F1 score gives the harmonic mean between precision and recall. AUC on the other hand gives us some insight of the False Positive Rate which is an important metric when it comes to the intrusion detection problem. In a binary classification setting the confusion matrix is a representation of the true label versus the predicted label. Positive prediction Negative prediction Positive condition True Positive (TP) False Negative (FN) Negative condition False Positive (FP) True Negative (TN) Table 3.1: Confusion matrix
Based on the confusion matrix definitions, one can define a number of metrics: TP + TN TP + TN + FP + FN TP TPR = TP + FN FP FPR = FP + TN TP P recision = TP + FP TP Recall = TP + FN
Accuracy =
Chapter 3 Methodology
19 F1 = 2 ∗
precision ∗ recall precision + recall
AUC is the area under the Receiver Operating Characteristic (ROC) curve which is drawn using the FPR and TPR metrics. In a multi-class classification setting there are multiple ways to calculate the chosen metrics. In this study we are using a micro-average of all classes for Accuracy and F1 and present the AUC only for the normal class. This way Accuracy and F1 can give an indication of the overall robustness of the classifiers, while the AUC can give us insight on how well the targeted misclassification attack worked against the ”normal” class. Objective 3: Examine potential applicability of the attack.
3.2.2
Step 2: Data Collection and Analysis
A number of candidate datasets were initially selected and analyzed based on the literature review and the research questions. The study was performed using the NSLKDD data set which was selected because it fulfilled a number of key criteria such as the existence of labels, the fact that it has been widely used by previous researchers and it is more robust than previous versions of the same data (KDD’99). After selecting the dataset the next step was to analyze it and perform any preprocessing steps. The process of analysis and pre-processing is fully documented in chapter 4.
3.2.3
Step 3: Data Modeling
During data modeling the following activities were performed: 1. Selection and training of the baseline classifiers using the training set. The classifiers selected were a Decision Tree based on the CART algorithm, a Support Vector Machine (SVM) with a linear kernel, a Random Forest classifier and a Majority Voting ensemble method that combined the previous three classifiers. The reason for selecting the first three was that they are very popular and very different approaches and the selection of Voting ensemble method was done in order to examine the robustness of classifier ensembles. The classification problem was a 5-class problem and it required the usage of the ”One-vs-the-rest (OvR) multiclass/multilabel strategy” for some of the classifiers which do not support multi-class problems out of the box. 2. A Multi-Layer Perceptron (MLP) was trained using the training dataset and was used to generate the adversarial test set using both FGSM and JSMA methods. The MLP was used as the source of the adversarial sample generation and the models baselined during the previous stage were the targets of the attack.
Chapter 3 Methodology
20
Figure 3.2: Baseline model training
Using a common training dataset places this study into the white-box attack category. Another alternative would have been to assume no knowledge of the training dataset and use a small subset of it for training the MLP, which could be discarded later on. This would have placed the study into the black-box category.
Figure 3.3: Adversarial sample generation
3.2.4
Step 4: Evaluation
The study evaluated the two methods used for adversarial test set generation (JSMA and FGSM) mainly in terms of their suitability for usage in a NIDS environment. It is well known that in terms of speed FGSM is faster, but the results produced by this method cannot be used for intrusion detection problems. The next activity during evaluation was to test the robustness of the baselined classifiers. Since JSMA was deemed the more suitable of the two methods, only the test set generated by JSMA was considered for the evaluation of the classifiers.
Chapter 3 Methodology
21
Figure 3.4: Testing baseline models using adversarial test samples
The third part of the evaluation was to look into the differences between the adversarial data and the original test data. During this activity, the main purpose was to examine the nature of the features that are frequently altered and identify the ones that are altered more frequently.
3.2.5
Step 5: Reporting
This step can be considered as a number of activities that ran in parallel with all other activities. Several interim presentations were produced for status reporting during the thesis work. The outcome of the study is expected to be this final thesis report.
3.3
Assumptions and Delimitation
This study was conducted under the assumption of both knowledge of the feature extraction method and also of the training data. Both of these assumptions were dictated by the chosen dataset. Knowledge of the training data could be avoided by using a limited subset of the data for the training of the generator model, but this option was not followed due to the fact that the dataset is not very large. These assumptions place the attack described in the study into the ”white-box” category. In terms of adversarial goals, the study is placed in the category of targeted misclassification when the JSMA method is used. JSMA allows the creation of targeted attacks and in this study the focus was to generate adversarial samples that target the normal class. The assumption was that an attacker would be mostly interested in masquerading her attacks in order for them to appear as normal traffic. The usage of the neural network as a source for the adversarial sample generation was mainly for historical purposes and also for the examination of the transferability concept between totally different machine learning models. However, other choices could have been possible as it was shown by Papernot, McDaniel and Goodfellow (2016).
Chapter 4 Data Collection and Analysis During the literature review there were a number of security datasets identified. Among the datasets presented in 2.1, a subset is directly relevant to the Intrusion Detection problem. The botnet datasets only present part of the attack space and the same applies to the insider threat ones. Among the remaining datasets, the only ones that are labeled, include a variety of attacks and they have been widely used, are the KDD’99 and NSL-KDD ones. Despite the fact that they are severely outdated, they have been chosen as a basis for this study mainly due to lack of better alternatives and secondly because the purpose of the study is the robustness of classifiers and not to make claims about prediction capabilities and generalization.
4.1
KDD’99 and NSL-KDD
As mentioned previously KDD’99 is the most widely used in the literature. The attacks that are present in the dataset belong to four major families: Denial of Service (DoS), User to Root (U2R), Remote to Local (R2L) and Probing attacks. DoS attacks are attacks against availability. In the KDD’99 dataset, this category contains attacks such as neptune, smurf, mailbomb, udpstorm, etc. U2R attacks represent attempts for privilege escalation. Some representative attacks of this type that are present in the dataset are buffer overflow, loadmodule, rootkit and sqlattack. R2L attacks attempts to exploit a vulnerability and gain remote access to a machine. Examples of this type of attack are guesspasswd, multihop, httptunnel and xsnoop. Probe attacks are mainly information gathering attempts by scanning or probing parts of the networks. While not strictly an attack they are usually the first step that an intruder will perform before launching an attack. Some examples of probing in the dataset are nmap, ipsweep, portsweep and mscan.
22
Chapter 4 Data Collection and Analysis
23
The detailed list of features is presented in 4.1. The original paper uses the term ”symbolic” for categorical variables and the term ”continuous” for numerical ones. The features that are present in the dataset fall into three main categories according to Tavallaee et al. (2009): Basic, Traffic and Content related ones. Basic features are the ones related to connection information such as hosts, ports, services used and protocols. Traffic features are the ones that are calculated as an aggregate during a window interval. These are further categorized as aggregates based on the same host and aggregates over the same service. A notable difference between KDD’99 and NSLKDD is that in the latter, the time window was substituted with a connection window of the last 100 connections. Content features are extracted from the packet data or payload and they are related to the content of specific applications or the protocols used. The NSL-KDD datset (NSL-KDD dataset, 2009) improved a number of shortcomings in the KDD’99 while keeping the number of features unchanged. The changes introduced by Tavallaee et al. (2009) were related to the removal of redundant records in the training and test sets and also in adjusting the level of difficulty of classification for certain attacks. Feature Type Feature Type duration cont. is guest login sym. protocol type sym. count cont. service sym. srv count cont. flag sym. serror rate cont. src bytes cont. rerror rate cont. dest bytes cont. srv rerror rate cont. land sym. diff srv rate cont. wrong fragment cont. srv diff host rate cont. urgent cont. dst host count cont. hot cont. dst host srv count cont. num failed logins cont. dst host same srv rate cont. logged in sym. dst host diff srv rate cont. num compromised cont. dst host same src port rate cont. root shell cont. dst host srv diff host rate cont. su attempted cont. dst host serror rate cont. num root cont. dst host srv serror rate cont. num file creations cont. dst host rerror rate cont. num access files cont. dst host srv rerrorv rate cont. num outbound cmds cont. is host login sym. Table 4.1: KDD’99 and NSL-KDD features
Chapter 4 Data Collection and Analysis
4.2
24
Data Preprocessing
The data pre-processing phase included the following steps: 1. All categorical (symbolic) variables were transformed to numerical using One-hot encoding. 2. Normalization of all features using Min-Max Scaler was performed in order to avoid having features with very large values dominating the dataset, which could be problematic in some classifiers such as the linear SVM and the MLP. 3. The problem was transformed to a 5-class classification one by changing the attack label from 39 distinct attack categories to four (”DoS”, ”U2R”, ”R2L”, ”Probe”) and ”normal”. The final result after preprocessing was that the training and test datasets had 122 features. The number of data points in the training set was 125973 and in the test set 22544.
Chapter 5 Results 5.1
Baseline Models
A number of different classifiers were trained and tested using the NSL-KDD train and test sets respectively, in order to be used as a baseline. The results on the test set are presented in table 5.1. Method Accuracy F1-score AUC (normal) Decision Tree 0.73 0.76 0.80 Random Forest 0.74 0.76 0.81 Linear SVM 0.73 0.75 0.77 Voting 0.75 0.75 0.70 MLP 0.75 Table 5.1: Test set results for 5-class classification
5.2
Adversarial Test Set Generation
Both the FGSM and JSMA methods were used in order to generate adversarial test sets from the original test set. A pre-trained MLP was used as the underlying model for the generation. Table 5.2 below, shows the difference between the two methods in terms of changed features on average as well as the unique features changed for all data points in the test set. Method FGSM JSMA
Num of unique altered features 122 66
Avg. features per data point 122 7.5
Percentage of altered features 100 6.25
Table 5.2: Adversarial feature statistics
25
Chapter 5 Results
26
Tables 5.3 and 5.4 show the transformation required for selected features using the JSMA method in order to for the specific data point to become ”normal”. Only the altered features are shown. ... ...
F26 . . . 0.07 . . .
F29 F30 . . . 0.07 0.07 . . .
F41 . . . 0.06 . . .
label dos
Table 5.3: Data point x(17) in original test set
... ...
F26 . . . 1.0 . . .
F29 F30 . . . 1.0 1.0 . . .
F41 . . . 1.0 . . .
label normal
(17)
Table 5.4: Transformation of data point xadv using JSMA
5.3
Model Evaluation on Adversarial Data
This section presents the results of the baseline models using the adversarial test set generated by the JSMA method in terms of Accuracy, F1-score and AUC (table 5.5. It should be noted that both the AUC results as well as the ROC curves in the figures below, are only presented for the the ”normal” class, while the F1-score is an average score over all classes. Method Accuracy F1-score AUC (normal) Decision Tree 0.56 0.67 0.76 Random Forest 0.69 0.73 0.79 Linear SVM 0.45 0.48 0.49 Voting 0.64 0.64 0.48 MLP 0.43 Table 5.5: Adversarial test set results for 5-class classification
Figure 5.1:
Decision Tree ROC curves
Figure 5.2: SVM ROC curves
Chapter 5 Results
Figure 5.3:
5.4
27
Random Forest ROC curves
Figure 5.4: Voting Ensemble ROC curves
Feature Evaluation
After generating the adversarial test set using JSMA, the features were ranked in terms of frequency with which they appear in the adversarial test set as changed. This was calculated by subtracting the original test set from the adversarial test set δ = X ? − Xtest where X ? is the adversarial test set and Xtest is the original test set. In order to find which features were altered for each data point δ (i) we need to find the feature indexes (i) j where feature δj 6= 0. The top ten features and their description are presented in table 5.6. Figure 5.5 shows the top 20 features and their percentages.
Chapter 5 Results
28
Feature Description dst host same srv rate % of connections to the same service and destination host dst host srv count number of connections to the same service and destination host as the current connection in the past 100 connections service http HTTP destination service flag same srv rate % of connections to the same service count number of connections to the same host as the current connection in the past 100 connections srv count number of connections to the same service as the current connection in the past 100 connections dst host count number of connections to the same destination host as the current connection in the past 100 connections flag SF TCP connection flag src bytes number of data bytes from source to destination dst bytes number of data bytes from destination to source Table 5.6: Top 10 adversarial features using JSMA
Figure 5.5: Most used features in adversarial sample generation
Chapter 6 Discussion 6.1
Data Modeling
A quick look at table 5.1 shows that all models have an overall accuracy and F1-score around 75%. The major differences are observed in the AUC score where the Decision Tree and the Random Forest classifier outperform the SVM and the Majority Voting ensemble. This essentially means that the first two methods are performing slightly better in classifying the ”normal” test samples exhibiting a lower FPR. This can also be observed in the Figures 5.1 to 5.4.
6.2
Adversarial Test Set Generation
As it was expected the FGSM method changes each feature very little while JSMA searches through the features of each data point and changes one at each iteration in order to produce an adversarial sample. This means that FGSM is not suitable for a domain such as NIDS since the features are generated from network traffic and it would not be possible for an adversary to control them in such a fine grained manner. In contrast, JSMA only changes a few features at a time and while it is iterative and takes more time to generate the adversarial test set, the low number of features that need to be changed on average might mean there is a basis for a practical attack. The above is totally inline with the observations in Huang et al. (2011) where the importance of domain applicability is highlighted as a potential problem for an attacker.
6.3
Model Evaluation on Adversarial Data
In terms of overall classification accuracy all classifiers were affected. The most severely affected is the Linear SVM with a drop of 28% and the Decision Tree whose accuracy
29
Chapter 6 Discussion
30
dropped by 17%. Only the Random Forest classifier showed some robustness with an accuracy drop of 5%. When it comes to F1-score, the Linear SVM was affected the most and its score was reduced by 27%. The other three classifiers did not suffer as much and again the Random Forest showed the highest robustness by dropping only 3%. The AUC over the normal class is an indicator of how robust were the classifiers against targeted misclassification towards the normal class. It provides a measure on how much was the increase on the FPR compared to the TPR, in other words, how many attacks were misclassified as normal traffic. The best performing classifier was again the Random Forest, which only dropped 2%, while the Decision Tree performed reasonably well. Both the Linear SVM and the Voting classifier were severely affected, losing 28 and 22 percentage points respectively. Based on the results, it seems that the only method that was robust across all metrics was the Random Forest. The Decision Tree was also quite robust especially in terms of AUC, which does not coincide with the results by Papernot, McDaniel and Goodfellow (2016). In the latter study, Decision Tree was one of the worst performing methods. This is also an indication that robustness of classifiers against adversarial methods is affected by the different datasets and potentially the application domain. The worst performing classifier was the Linear SVM, which is not surprising as linearity was one of the reasons given by Goodfellow et al. (2014) as a potential explanation of the phenomenon. Another interesting result from Papernot, McDaniel and Goodfellow (2016) was that a Linear model when used as a source of adversarial sample generation was actually one of the most successful ones, which is a finding worth exploring in the NIDS domain as well.
6.4
Feature Evaluation
Looking at the top ten features in Table 5.6 one can get an idea of which ones contribute most during the generation of adversarial samples. Among those features, the top two are about the rate and the count of the connections to the same host and port. This feature is particularly telling and one way an attacker could get around it would be to lessen the number of requests they generate. This is especially relevant to traffic generated by bots that generate connections to external command and control servers and can hide their traffic under normal traffic that a user creates. A similar type of thinking can be applied to other count and rate types of features. This type of discussion is also relevant to DoS type of attacks and while this dataset is quite old, we have seen attacks historically that followed the ”low and slow” approach in order to appear as close to legitimate traffic as possible. When it comes to features related to service types, one strategy would be to use protocols such as HTTP or HTTPS in order to hide into other normal traffic, instead of using protocols that might be easier to get discovered.
Chapter 6 Discussion
6.5
31
Contributions
Based on the results presented in this chapter, the study made a number of novel contributions. Firstly, we performed adversarial attacks against machine learning classifiers used in NIDS, by adapting techniques that have not been used before in this application domain. Following the method proposed by Papernot, McDaniel, Jha, Fredrikson, Celik and Swami (2016) we showed that it is possible to generate adversarial samples successfully, even without having knowledge of the targeted classifier. This method proved to be very suitable for the NIDS domain because it required very small modifications (circa 6% of the features) of the input data. Furthermore, the study showed that the effects of the adversarial attacks had significant impacts on the general detection accuracy of the models in question, where the percentage drops ranged from 5% to 28% and the percentage drops in F1-scores ranged from 3% to 27%. The targeted misclassification was also measured between 2% and 28% reduction. A second contribution was a comparative study of the robustness of the different classifiers against adversarial attacks, where random forest and decision tree classifiers appeared to be the most robust, especially against targeted attacks. This was contrary to some results reported in the image classification domain and it emphasizes the importance of studying different application domains and addressing their specific requirements. From a practical perspective the use of adversarial generation techniques showed potential in regards to feature selection that could be used from an adversary that wishes to adapt her attacks in order to fool an intrusion detection classifier. An adversary with some knowledge of the feature generation process, could use adversarial generation techniques based on different source classifiers and examine which features are the most prominent and potentially more useful to adapt.
Chapter 7 Conclusion The following research questions were posed at the beginning of the study: How robust are machine learning classifiers used in NIDS against adversarial attacks? More specifically: • How effective are adversarial attacks based on DL derived methods? • Which of the attack methods is most applicable to NIDS? • How can the transferability concept be used in the NIDS domain under a weak attacker model? In other words, how can we generate adversarial attack samples without having knowledge of the exact classifier used and potentially no access to training data? Judging from the results and discussion presented previously we can say that when it comes to applicability of attacks, the JSMA method could be applied to the intrusion detection problem while FGSM cannot be used in a practical manner. When it comes to robustness of the different classifiers, some exhibited more robustness than others as it was also shown in (Papernot, McDaniel and Goodfellow, 2016). However, the results in this study differ on which methods exhibit more robustness. In our case the Random Forest and the Decision Tree were more robust against a neural network, while in (Papernot, McDaniel and Goodfellow, 2016) the decision tree was the weakest classifier. While the results of the different studies do not always coincide, it is clear that using a substitute model to generate adversarial samples can be successful and it is worth looking at adversarial security when deploying machine learning classifiers. This finding implies that even when attackers do not have access to the training data, adversarial samples can transfer to different models under certain circumstances. This means that when machine learning is used, it should be accompanied with relevant adversarial testing and strengthening if possible. Despite the results in the study, it should be noted that a practical attack would require some idea on how the raw network data are processed and the types of features that are 32
Chapter 7 Conclusion
33
generated. In our case we had a pre-processed dataset and not raw data which made it easier to attack. In other words, one does not need access to the exact model or to the training dataset but some knowledge about how the data is preprocessed and how features are generated, is required. However, knowledge about feature generation should not be considered untenable as it could come from reverse engineering techniques. Finally, even if we know the features used, it would still require work to adjust the traffic profiles of the specific attack. Contrary to the image classification problem, where each bit in the image can be considered a feature which can be easily altered, not all traffic related characteristics can be changed, even when an adversary has the ability to craft specific network packets and payloads. Application related considerations are a potential hindrance for adversaries in NIDS classification based systems, but this would require from NIDS classifiers to use features that are not easily manipulated by an attacker.
7.1
Future Work
This study presented a first try in transferring adversarial methods from the Deep Learning image classification domain to the NIDS domain. While several studies have proposed defenses against these methods, these defenses do not generalize very well. A future study would be to examine some of these defenses and establish whether they improve the situation or not. Another extension of this study would be to try out different models as source for the adversarial sample generation instead of using neural networks. The problem of the existence of reliable data in the NIDS domain is well known and it was the driving factor for the selection of the specific dataset used in the study. Future work would benefit from evaluating other data and potentially the implementation of a proof of concept in an environment with live traffic or a better traffic mix that is more representative of modern enterprise networks. Finally, the examination of the effects of the adversarial methods in different attack classes would potentially yield a better overview of which features are more important for each attack type when it comes to adversarial sample generation. This might eventually be used as a way for an adversary to select a strategy that would allow them to hide their malicious traffic depending on the chosen attack.
Appendix A Source Code 1 2 3
import numpy as np import pandas as pd from sklearn . preprocessing import LabelEncoder , MinMaxScaler
4 5 6 7
from keras . models import Sequential from keras . layers import Dense , Dropout from keras . optimizers import RMSprop , adam
8 9 10 11 12
from from from from
cleverhans . attacks import fgsm , jsma cleverhans . utils_tf import model_train , model_eval , batch_eval cleverhans . attacks_tf import j acobian_ graph cleverhans . utils import other_classes
13 14 15
import tensorflow as tf from tensorflow . python . platform import flags
16 17 18 19 20
from from from from
sklearn . multiclass import O n e V s R e s t C l a s s i f i e r sklearn . tree import D e c i s i o n T r e e C l a s s i f i e r sklearn . ensemble import RandomForestClassifier , V o ti n g C l a s s i f i e r sklearn . linear_model import L o g i s t i c R e g r e s s i o n
21 22 23 24
from sklearn . metrics import accuracy_score , roc_curve , auc , f1_score from sklearn . preprocessing import LabelEncoder , MinMaxScaler from sklearn . svm import SVC , LinearSVC
25 26 27
import matplotlib . pyplot as plt plt . style . use ( ’ bmh ’)
28 29
FLAGS = flags . FLAGS
30 31 32 33 34 35
flags . DEFIN E_integ er ( ’ nb_epochs ’ , 20 , ’ Number of epochs to train model ’) flags . DEFIN E_integ er ( ’ batch_size ’ , 128 , ’ Size of training batches ’) flags . DEFINE_float ( ’ learning_rate ’ , 0.1 , ’ Learning rate for training ’) flags . DEFIN E_integ er ( ’ nb_classes ’ , 5 , ’ Number of c lassific ation classes ’) flags . DEFIN E_integ er ( ’ s ource_sa mples ’ , 10 , ’ Nb of test set examples to attack ’)
36 37 38 39
print () print () print ( " - - - - - - - - - - - - - - Start of preprocessing stage - - - - - - - - - - - - - - " )
40 41 42 43 44 45
names = [ ’ duration ’ , ’ protocol ’ , ’ service ’ , ’ flag ’ , ’ src_bytes ’ , ’ dst_bytes ’ , ’ land ’ , ’ wrong_f ragment ’ , ’ urgent ’ , ’ hot ’ , ’ n u m _ f a i l e d _ l o g i n s ’ , ’ logged_in ’ , ’ n um _c o mp ro mi s ed ’ , ’ root_shell ’ , ’ su_attempted ’ , ’ num_root ’ , ’ n u m _ f i l e _ c r e a t i o n s ’ , ’ num_shells ’ , ’ n um _ a c c e s s _ f i l e s ’ , ’ num_outbound_cmds ’, ’ is_host_login ’ , ’ i s_guest _login ’ , ’ count ’ , ’ srv_count ’ , ’ serror_rate ’ , ’ s rv _ser r or _r at e ’ ,
34
Appendix A Source Code 46 47 48 49
’ rerror_rate ’ , ’ s r v_ re rr o r_ ra t e ’ , ’ same_srv_rate ’ , ’ diff_srv_rate ’ , ’ srv_diff_host_rate ’, ’ dst_host _count ’ , ’ d s t _ ho s t _ s r v _ c o u n t ’ , ’ d s t _ h o s t _ s a m e _ s r v _ r a t e ’ , ’ dst_host_diff_srv_rate ’, ’ dst_host_same_src_port_rate ’, ’ dst_host_srv_diff_host_rate ’, ’ dst_host_serror_rate ’, ’ dst_host_srv_serror_rate ’, ’ dst_host_rerror_rate ’, ’ d s t _ h o s t _ s r v _ r e r r o r _ r a t e ’ , ’ attack_type ’ , ’ other ’]
50 51 52 53
df = pd . read_csv ( ’ KDDTrain +. txt ’ , names = names , header = None ) dft = pd . read_csv ( ’ KDDTest +. txt ’ , names = names , header = None ) print ( " Initial test and training data shapes : " , df . shape , dft . shape )
54 55 56
full = pd . concat ([ df , dft ]) assert full . shape [0] == df . shape [0] + dft . shape [0]
57 58
full [ ’ label ’] = full [ ’ attack_type ’]
59 60 61 62 63 64 65 66 67 68 69 70 71
# DoS attacks full . loc [ full . label full . loc [ full . label full . loc [ full . label full . loc [ full . label full . loc [ full . label full . loc [ full . label full . loc [ full . label full . loc [ full . label full . loc [ full . label full . loc [ full . label full . loc [ full . label
== == == == == == == == == == ==
’ neptune ’ , ’ label ’] = ’ dos ’ ’ back ’ , ’ label ’] = ’ dos ’ ’ land ’ , ’ label ’] = ’ dos ’ ’ pod ’ , ’ label ’] = ’ dos ’ ’ smurf ’ , ’ label ’] = ’ dos ’ ’ teardrop ’ , ’ label ’] = ’ dos ’ ’ mailbomb ’ , ’ label ’] = ’ dos ’ ’ processtable ’ , ’ label ’] = ’ dos ’ ’ udpstorm ’ , ’ label ’] = ’ dos ’ ’ apache2 ’ , ’ label ’] = ’ dos ’ ’ worm ’ , ’ label ’] = ’ dos ’
72 73 74 75 76 77 78 79 80
# User - to - Root ( U2R ) full . loc [ full . label == full . loc [ full . label == full . loc [ full . label == full . loc [ full . label == full . loc [ full . label == full . loc [ full . label == full . loc [ full . label ==
’ b u ff er _o v er fl ow ’ , ’ label ’] = ’ u2r ’ ’ loadmodule ’ , ’ label ’] = ’ u2r ’ ’ perl ’ , ’ label ’] = ’ u2r ’ ’ rootkit ’ , ’ label ’] = ’ u2r ’ ’ sqlattack ’ , ’ label ’] = ’ u2r ’ ’ xterm ’ , ’ label ’] = ’ u2r ’ ’ ps ’ , ’ label ’] = ’ u2r ’
81 82 83 84 85 86 87 88 89 90 91 92 93 94 95 96 97
# Remote - to - Local ( R2L ) full . loc [ full . label == ’ ftp_write ’ , ’ label ’] = ’ r2l ’ full . loc [ full . label == ’ guess_passwd ’ , ’ label ’] = ’ r2l ’ full . loc [ full . label == ’ imap ’ , ’ label ’] = ’ r2l ’ full . loc [ full . label == ’ multihop ’ , ’ label ’] = ’ r2l ’ full . loc [ full . label == ’ phf ’ , ’ label ’] = ’ r2l ’ full . loc [ full . label == ’ spy ’ , ’ label ’] = ’ r2l ’ full . loc [ full . label == ’ warezclient ’ , ’ label ’] = ’ r2l ’ full . loc [ full . label == ’ warezmaster ’ , ’ label ’] = ’ r2l ’ full . loc [ full . label == ’ xlock ’ , ’ label ’] = ’ r2l ’ full . loc [ full . label == ’ xsnoop ’ , ’ label ’] = ’ r2l ’ full . loc [ full . label == ’ snmpgetattack ’ , ’ label ’] = ’ r2l ’ full . loc [ full . label == ’ httptunnel ’ , ’ label ’] = ’ r2l ’ full . loc [ full . label == ’ snmpguess ’ , ’ label ’] = ’ r2l ’ full . loc [ full . label == ’ sendmail ’ , ’ label ’] = ’ r2l ’ full . loc [ full . label == ’ named ’ , ’ label ’] = ’ r2l ’
98 99 100 101 102 103 104 105
# Probe attacls full . loc [ full . label full . loc [ full . label full . loc [ full . label full . loc [ full . label full . loc [ full . label full . loc [ full . label
== == == == == ==
’ satan ’ , ’ label ’] = ’ probe ’ ’ ipsweep ’ , ’ label ’] = ’ probe ’ ’ nmap ’ , ’ label ’] = ’ probe ’ ’ portsweep ’ , ’ label ’] = ’ probe ’ ’ saint ’ , ’ label ’] = ’ probe ’ ’ mscan ’ , ’ label ’] = ’ probe ’
106 107 108
full = full . drop ([ ’ other ’ , ’ attack_type ’] , axis =1) print ( " Unique labels " , full . label . unique () )
109 110 111 112
# Generate One - Hot encoding full2 = pd . get_dummies ( full , drop_first = False )
35
Appendix A Source Code 113 114 115 116 117 118
# Separate training and test sets again features = list ( full2 . columns [: -5]) y_train = np . array ( full2 [0: df . shape [0]][[ ’ label_normal ’ , ’ label_dos ’ , ’ label_probe ’ , ’ label_r2l ’ , ’ label_u2r ’ ]]) X_train = full2 [0: df . shape [0]][ features ] y_test = np . array ( full2 [ df . shape [0]:][[ ’ label_normal ’ , ’ label_dos ’ , ’ label_probe ’ , ’ label_r2l ’ , ’ label_u2r ’ ]]) X_test = full2 [ df . shape [0]:][ features ]
119 120 121 122 123
# Scale data scaler = MinMaxScaler () . fit ( X_train ) X_tr ain_scal ed = np . array ( scaler . transform ( X_train ) ) X_test_scaled = np . array ( scaler . transform ( X_test ) )
124 125 126 127 128 129 130 131
# Generate label encoding for Logistic regression labels = full . label . unique () le = LabelEncoder () le . fit ( labels ) y_full = le . transform ( full . label ) y_train_l = y_full [0: df . shape [0]] y_test_l = y_full [ df . shape [0]:]
132 133 134 135
print ( " Training dataset shape " , X _train_s caled . shape , y_train . shape ) print ( " Test dataset shape " , X_test_scaled . shape , y_test . shape ) print ( " Label encoder y shape " , y_train_l . shape , y_test_l . shape )
136 137 138 139
print ( " - - - - - - - - - - - - - - End of preprocessing stage - - - - - - - - - - - - - - " ) print () print ()
140 141 142 143 144 145 146 147 148 149 150 151 152 153 154 155
print ( " - - - - - - - - - - - - - - Start of adversarial sample generation - - - - - - - - - - - - - - " ) print () def mlp_model () : """ Generate a MultiLayer Perceptron model """ model = Sequential () model . add ( Dense (256 , activation = ’ relu ’ , input_shape =( X_train _scaled . shape [1] ,) ) ) model . add ( Dropout (0.4) ) model . add ( Dense (256 , activation = ’ relu ’) ) model . add ( Dropout (0.4) ) model . add ( Dense ( FLAGS . nb_classes , activation = ’ softmax ’) ) model . compile ( loss = ’ c a t e g o r i c a l _ c r o s s e n t r o p y ’ , optimizer = ’ adam ’ , metrics =[ ’ accuracy ’ ])
156 157
model . summary ()
158 159
return model
160 161 162 163 164 165 166 167 168
def evaluate () : """ Model evaluation function """ eval_params = { ’ batch_size ’: FLAGS . batch_size } accuracy = model_eval ( sess , x , y , predictions , X_test_scaled , y_test , args = eval_params ) print ( ’ Test accuracy on legitimate test examples : ’ + str ( accuracy ) )
169 170 171 172 173
# Tensorflow placeholder variables x = tf . placeholder ( tf . float32 , shape =( None , X_train _scaled . shape [1]) ) y = tf . placeholder ( tf . float32 , shape =( None , FLAGS . nb_classes ) )
174 175 176 177 178 179 180
36
tf . s e t_ ra nd o m_ se ed (42) model = mlp_model () sess = tf . Session () predictions = model ( x ) init = tf . g l o b a l _ v a r i a b l e s _ i n i t i a l i z e r () sess . run ( init )
Appendix A Source Code
37
181 182 183 184 185 186 187 188 189
# Train the model train_params = { ’ nb_epochs ’: FLAGS . nb_epochs , ’ batch_size ’: FLAGS . batch_size , ’ learning_rate ’: FLAGS . learning_rate , ’ verbose ’: 0 } model_train ( sess , x , y , predictions , X_train_scaled , y_train , evaluate = evaluate , args = train_params )
190 191 192
# Generate adversarial samples for all test datapoints sour ce_sampl es = X_test_scaled . shape [0]
193 194 195 196 197
# Jacobian - based Saliency Map results = np . zeros (( FLAGS . nb_classes , sou rce_sam ples ) , dtype = ’i ’) perturbations = np . zeros (( FLAGS . nb_classes , source _sample s ) , dtype = ’f ’) grads = jacob ian_gra ph ( predictions , x , FLAGS . nb_classes )
198 199
X_adv = np . zeros (( source_samples , X_test_scaled . shape [1]) )
200 201 202 203 204 205
for sample_ind in range (0 , s ource_sa mples ) : # We want to find an adversarial example for each possible target class # ( i . e . all classes that differ from the label given in the dataset ) current_class = int ( np . argmax ( y_test [ sample_ind ]) ) # target _classes = other_classes ( FLAGS . nb_classes , current_class )
206 207 208 209 210 211 212
# Only target the normal class for target in [0]: # print ( ’ - - - - - - - - - - - - - - - - - - - - - - - - - - - - - - - - - - - - - - ’) # print ( ’ Creating adv . example for target class ’ + str ( target ) ) if current_class == 0: break
213 214 215 216 217 218 219
# This call runs the Jacobian - based saliency map approach adv_x , res , pe r ce nt _p e rt ur b = jsma ( sess , x , predictions , grads , X_test_scaled [ sample_ind : ( sample_ind +1) ] , target , theta =1 , gamma =0.1 , increase = True , back = ’ tf ’ , clip_min =0 , clip_max =1)
220 221 222 223
X_adv [ sample_ind ] = adv_x results [ target , sample_ind ] = res perturbations [ target , sample_ind ] = pe rc en t _p er t ur b
224 225
print ( X_adv . shape )
226 227 228 229 230 231 232
print ( " - - - - - - - - - - - - - - Evaluation of MLP performance - - - - - - - - - - - - - - " ) print () eval_params = { ’ batch_size ’: FLAGS . batch_size } accuracy = model_eval ( sess , x , y , predictions , X_test_scaled , y_test , args = eval_params ) print ( ’ Test accuracy on normal examples : ’ + str ( accuracy ) )
233 234 235 236
accuracy_adv = model_eval ( sess , x , y , predictions , X_adv , y_test , args = eval_params ) print ( ’ Test accuracy on adversarial examples : ’ + str ( accuracy_adv ) )
237 238 239 240 241 242
print () print ( " - - - - - - - - - - - - Decision Tree Classifier - - - - - - - - - - - " ) dt = O n e V s R e s t C l a s s i f i e r ( D e c i s i o n T r e e C l a s s i f i e r ( random_state =42) ) dt . fit ( X_train_scaled , y_train ) y_pred = dt . predict ( X_test_scaled )
243 244 245
# Calculate FPR for normal class only fpr_dt , tpr_dt , _ = roc_curve ( y_test [: , 0] , y_pred [: , 0])
246 247 248 249
roc_auc_dt = auc ( fpr_dt , tpr_dt ) print ( " Accuracy score : " , accurac y_score ( y_test , y_pred ) ) print ( " F1 score : " , f1_score ( y_test , y_pred , average = ’ micro ’) )
Appendix A Source Code 250
print ( " AUC score : " , roc_auc_dt )
251 252 253 254 255 256 257 258
# Predict using adversarial test samples y_pred_adv = dt . predict ( X_adv ) fpr_dt_adv , tpr_dt_adv , _ = roc_curve ( y_test [: , 0] , y_pred_adv [: , 0]) roc_ auc_dt_a dv = auc ( fpr_dt_adv , tpr_dt_adv ) print ( " Accuracy score adversarial : " , a ccuracy _score ( y_test , y_pred_adv ) ) print ( " F1 score adversarial : " , f1_score ( y_test , y_pred_adv , average = ’ micro ’) ) print ( " AUC score adversarial : " , r oc_auc_d t_adv )
259 260 261 262 263 264 265 266 267 268 269 270 271 272 273
plt . figure () lw = 2 plt . plot ( fpr_dt , tpr_dt , color = ’ darkorange ’ , lw = lw , label = ’ ROC curve ( area = %0.2 f ) ’ % roc_auc_dt ) plt . plot ( fpr_dt_adv , tpr_dt_adv , color = ’ green ’ , lw = lw , label = ’ ROC curve adv .( area = %0.2 f ) ’ % ro c_auc_dt _adv ) plt . plot ([0 , 1] , [0 , 1] , color = ’ navy ’ , lw = lw , linestyle = ’ -- ’) plt . xlim ([0.0 , 1.0]) plt . ylim ([0.0 , 1.05]) plt . xlabel ( ’ False Positive Rate ’) plt . ylabel ( ’ True Positive Rate ’) plt . title ( ’ ROC Decision Tree ( class = Normal ) ’) plt . legend ( loc = " lower right " ) plt . savefig ( ’ ROC_DT . png ’)
274 275 276 277 278 279 280
print () print () print ( " - - - - - - - - - - - - Random Forest Classifier - - - - - - - - - - - " ) rf = O n e V s R e s t C l a s s i f i e r ( R a n d o m F o r e s t C l a s s i f i e r ( n_estimators =200 , random_state =42) ) rf . fit ( X_train_scaled , y_train ) y_pred = rf . predict ( X_test_scaled )
281 282 283 284 285 286
fpr_rf , tpr_rf , _ = roc_curve ( y_test [: , 0] , y_pred [: , 0]) roc_auc_rf = auc ( fpr_rf , tpr_rf ) print ( " Accuracy score : " , accurac y_score ( y_test , y_pred ) ) print ( " F1 score : " , f1_score ( y_test , y_pred , average = ’ micro ’) ) print ( " AUC score : " , roc_auc_rf )
287 288 289 290 291 292 293 294
# Predict using adversarial test samples y_pred_adv = rf . predict ( X_adv ) fpr_rf_adv , tpr_rf_adv , _ = roc_curve ( y_test [: , 0] , y_pred_adv [: , 0]) roc_ auc_rf_a dv = auc ( fpr_rf_adv , tpr_rf_adv ) print ( " Accuracy score adversarial : " , a ccuracy _score ( y_test , y_pred_adv ) ) print ( " F1 score adversarial : " , f1_score ( y_test , y_pred_adv , average = ’ micro ’) ) print ( " AUC score adversarial : " , r oc_auc_r f_adv )
295 296 297 298 299 300 301 302 303 304 305 306 307 308 309
plt . figure () lw = 2 plt . plot ( fpr_rf , tpr_rf , color = ’ darkorange ’ , lw = lw , label = ’ ROC curve ( area = %0.2 f ) ’ % roc_auc_rf ) plt . plot ( fpr_rf_adv , tpr_rf_adv , color = ’ green ’ , lw = lw , label = ’ ROC curve adv . ( area = %0.2 f ) ’ % roc_au c_rf_adv ) plt . plot ([0 , 1] , [0 , 1] , color = ’ navy ’ , lw = lw , linestyle = ’ -- ’) plt . xlim ([0.0 , 1.0]) plt . ylim ([0.0 , 1.05]) plt . xlabel ( ’ False Positive Rate ’) plt . ylabel ( ’ True Positive Rate ’) plt . title ( ’ ROC Random Forest ( class = Normal ) ’) plt . legend ( loc = " lower right " ) plt . savefig ( ’ ROC_RF . png ’)
310 311 312 313 314 315
print () print () print ( " - - - - - - - - - - - - Linear SVM Classifier - - - - - - - - - - - " ) sv = O n e V s R e s t C l a s s i f i e r ( LinearSVC ( C =1. , random_state =42 , loss = ’ hinge ’) ) sv . fit ( X_train_scaled , y_train )
316 317 318 319 320
y_pred = sv . predict ( X_test_scaled ) fpr_sv , tpr_sv , _ = roc_curve ( y_test [: , 0] , y_pred [: , 0]) roc_auc_sv = auc ( fpr_sv , tpr_sv ) print ( " Accuracy score : " , accurac y_score ( y_test , y_pred ) )
38
Appendix A Source Code 321 322
39
print ( " F1 score : " , f1_score ( y_test , y_pred , average = ’ micro ’) ) print ( " AUC score : " , roc_auc_sv )
323 324 325 326 327 328 329 330
# Predict using adversarial test samples y_pred_adv = sv . predict ( X_adv ) fpr_sv_adv , tpr_sv_adv , _ = roc_curve ( y_test [: , 0] , y_pred_adv [: , 0]) roc_ auc_sv_a dv = auc ( fpr_sv_adv , tpr_sv_adv ) print ( " Accuracy score adversarial " , ac curacy_s core ( y_test , y_pred_adv ) ) print ( " F1 score adversarial : " , f1_score ( y_test , y_pred_adv , average = ’ micro ’) ) print ( " AUC score adversarial : " , r oc_auc_s v_adv )
331 332 333 334 335 336 337 338 339 340 341 342 343 344 345
plt . figure () lw = 2 plt . plot ( fpr_sv , tpr_sv , color = ’ darkorange ’ , lw = lw , label = ’ ROC curve ( area = %0.2 f ) ’ % roc_auc_sv ) plt . plot ( fpr_sv_adv , tpr_sv_adv , color = ’ green ’ , lw = lw , label = ’ ROC curve adv .( area = %0.2 f ) ’ % ro c_auc_sv _adv ) plt . plot ([0 , 1] , [0 , 1] , color = ’ navy ’ , lw = lw , linestyle = ’ -- ’) plt . xlim ([0.0 , 1.0]) plt . ylim ([0.0 , 1.05]) plt . xlabel ( ’ False Positive Rate ’) plt . ylabel ( ’ True Positive Rate ’) plt . title ( ’ ROC SVM ( class = Normal ) ’) plt . legend ( loc = " lower right " ) plt . savefig ( ’ ROC_SVM . png ’)
346 347 348 349 350 351
print () print () print ( " - - - - - - - - - - - - Voting Classifier - - - - - - - - - - - " ) vot = V o t i n g C l a s s i f i e r ( estimators =[( ’ dt ’ , dt ) , ( ’ rf ’ , rf ) , ( ’ sv ’ , sv ) ] , voting = ’ hard ’) vot . fit ( X_train_scaled , y_train_l )
352 353 354 355 356 357 358
y_pred = vot . predict ( X_test_scaled ) fpr_vot , tpr_vot , _ = roc_curve ( y_test_l , y_pred , pos_label =1 , d r o p _ i n t e r m e d i a t e = False ) roc_auc_vot = auc ( fpr_vot , tpr_vot ) print ( " Accuracy score " , a ccuracy_ score ( y_test_l , y_pred ) ) print ( " F1 score : " , f1_score ( y_test_l , y_pred , average = ’ micro ’) ) print ( " AUC score : " , roc_auc_vot )
359 360 361 362 363 364 365 366
# Predict using adversarial test samples y_pred_adv = vot . predict ( X_adv ) fpr_vot_adv , tpr_vot_adv , _ = roc_curve ( y_test_l , y_pred_adv , pos_label =1 , d r o p _ i n t e r m e d i a t e = False ) r oc _a u c_ vo t_ a dv = auc ( fpr_vot_adv , tpr_vot_adv ) print ( " Accuracy score adversarial : " , a ccuracy _score ( y_test_l , y_pred_adv ) ) print ( " F1 score adversarial : " , f1_score ( y_test_l , y_pred_adv , average = ’ micro ’) ) print ( " AUC score adversarial : " , ro c _a uc _v o t_ ad v )
367 368 369 370 371 372 373 374 375 376 377 378 379 380 381
plt . figure () lw = 2 plt . plot ( fpr_vot , tpr_vot , color = ’ darkorange ’ , lw = lw , label = ’ ROC curve ( area = %0.2 f ) ’ % roc_auc_vot ) plt . plot ( fpr_vot_adv , tpr_vot_adv , color = ’ green ’ , lw = lw , label = ’ ROC curve adv . ( area = %0.2 f ) ’ % r oc _ au c_ vo t _a dv ) plt . plot ([0 , 1] , [0 , 1] , color = ’ navy ’ , lw = lw , linestyle = ’ -- ’) plt . xlim ([0.0 , 1.0]) plt . ylim ([0.0 , 1.05]) plt . xlabel ( ’ False Positive Rate ’) plt . ylabel ( ’ True Positive Rate ’) plt . title ( ’ ROC Voting ( class = Normal ) ’) plt . legend ( loc = " lower right " ) plt . savefig ( ’ ROC_Vot . png ’)
382 383 384 385 386 387 388 389
# Print overall ROC curves plt . figure ( figsize =(12 , 6) ) plt . plot ( fpr_dt_adv , tpr_dt_adv , label = ’ DT ( area = %0.2 f ) ’ % roc_auc _dt_adv ) plt . plot ( fpr_rf_adv , tpr_rf_adv , label = ’ RF ( area = %0.2 f ) ’ % roc_auc _rf_adv ) plt . plot ( fpr_sv_adv , tpr_sv_adv , label = ’ SVM ( area = %0.2 f ) ’ % roc_au c_sv_ad v ) plt . plot ( fpr_vot_adv , tpr_vot_adv , label = ’ Vot ( area = %0.2 f ) ’ % ro c_ a uc _v ot _ ad v )
Appendix A Source Code 390
# plt . plot ( fpr_lr_adv , tpr_lr_adv , label = ’ LR ( area = %0.2 f ) ’ % r oc_auc_l r_adv )
391 392 393 394 395 396
plt . xlabel ( ’ False positive rate ’) plt . ylabel ( ’ True positive rate ’) plt . title ( ’ ROC curve ( adversarial samples ) ’) plt . legend ( loc = ’ best ’) plt . savefig ( ’ ROC _curves _adv . png ’)
397 398 399 400 401 402 403
plt . figure ( figsize =(12 , 6) ) plt . plot ( fpr_dt , tpr_dt , label = ’ DT ( area = %0.2 f ) ’ % roc_auc_dt ) plt . plot ( fpr_rf , tpr_rf , label = ’ RF ( area = %0.2 f ) ’ % roc_auc_rf ) plt . plot ( fpr_sv , tpr_sv , label = ’ SVM ( area = %0.2 f ) ’ % roc_auc_sv ) plt . plot ( fpr_vot , tpr_vot , label = ’ Vot ( area = %0.2 f ) ’ % roc_auc_vot )
404 405
# plt . plot ( fpr_lr , tpr_lr , label = ’ LR ( area = %0.2 f ) ’ % roc_auc_lr )
406 407 408 409 410 411
plt . xlabel ( ’ False positive rate ’) plt . ylabel ( ’ True positive rate ’) plt . title ( ’ ROC curve ( normal samples ) ’) plt . legend ( loc = ’ best ’) plt . savefig ( ’ ROC_curves . png ’)
412 413 414 415
print () print () print ( " - - - - - - - - - - - - Adversarial feature statistics - - - - - - - - - - - " )
416 417 418 419 420
feats = dict () total = 0 orig_attack = X_test_scaled - X_adv for i in range (0 , orig_attack . shape [0]) :
421 422 423 424 425 426 427 428
ind = np . where ( orig_attack [i , :] != 0) [0] total += len ( ind ) for j in ind : if j in feats : feats [ j ] += 1 else : feats [ j ] = 1
429 430 431 432
# The number of features that where changed for the adversarial samples print ( " Number of unique features changed : " , len ( feats . keys () ) ) print ( " Number of average features changed per datapoint " , total / len ( orig_attack ) )
433 434 435 436
top_10 = sorted ( feats , key = feats . get , reverse = True ) [:10] top_20 = sorted ( feats , key = feats . get , reverse = True ) [:20] print ( " Top ten features : " , X_test . columns [ top_10 ])
437 438 439
top_10_val = [100* feats [ k ] / y_test . shape [0] for k in top_10 ] top_20_val = [100* feats [ k ] / y_test . shape [0] for k in top_20 ]
440 441 442 443 444 445 446 447
plt . figure ( figsize =(16 , 12) ) plt . bar ( np . arange (20) , top_20_val , align = ’ center ’) plt . xticks ( np . arange (20) , X_test . columns [ top_20 ] , rotation = ’ vertical ’) plt . title ( ’ Feature participation in adversarial examples ’) plt . ylabel ( ’ Percentage (%) ’) plt . xlabel ( ’ Features ’) plt . savefig ( ’ Adv_features . png ’)
448 449 450 451
# Craft adversarial examples using Fast Gradient Sign Method ( FGSM ) adv_x_f = fgsm (x , predictions , eps =0.3) X_test_adv , = batch_eval ( sess , [ x ] , [ adv_x_f ] , [ X_test_scaled ])
452 453 454 455
# Evaluate the accuracy of the MNIST model on adversarial examples accuracy = model_eval ( sess , x , y , predictions , X_test_adv , y_test ) print ( ’ Test accuracy on adversarial examples : ’ + str ( accuracy ) )
456 457 458 459 460
# Comparison of adversarial and original test samples ( attack ) feats = dict () total = 0 orig_attack = X_test_scaled - X_test_adv
40
Appendix A Source Code 461
for i in range (0 , orig_attack . shape [0]) :
462 463 464 465 466 467 468 469
ind = np . where ( orig_attack [i , :] != 0) [0] total += len ( ind ) for j in ind : if j in feats : feats [ j ] += 1 else : feats [ j ] = 1
470 471 472 473
# The number of features that were changed for the adversarial samples print ( " Number of unique features changed with FGSM : " , len ( feats . keys () ) ) print ( " Number of average features changed per datapoint with FGSM : " , total / len ( orig_attack ) )
41
References Abadi, M., Agarwal, A., Barham, P., Brevdo, E., Chen, Z., Citro, C., Corrado, G. S., Davis, A., Dean, J., Devin, M., Ghemawat, S., Goodfellow, I., Harp, A., Irving, G., Isard, M., Jia, Y., Jozefowicz, R., Kaiser, L., Kudlur, M., Levenberg, J., Man´e, D., Monga, R., Moore, S., Murray, D., Olah, C., Schuster, M., Shlens, J., Steiner, B., Sutskever, I., Talwar, K., Tucker, P., Vanhoucke, V., Vasudevan, V., Vi´egas, F., Vinyals, O., Warden, P., Wattenberg, M., Wicke, M., Yu, Y. and Zheng, X. (2015), ‘TensorFlow: Large-scale machine learning on heterogeneous systems’. Software available from tensorflow.org. URL: http://tensorflow.org/ Ahmed, M., Mahmood, A. N. and Hu, J. (2016), ‘A survey of network anomaly detection techniques’, Journal of Network and Computer Applications 60, 19–31. Ateniese, G., Mancini, L. V., Spognardi, A., Villani, A., Vitali, D. and Felici, G. (2015), ‘Hacking smart machines with smarter ones: How to extract meaningful data from machine learning classifiers’, International Journal of Security and Networks 10(3), 137–150. Barreno, M., Nelson, B., Sears, R., Joseph, A. D. and Tygar, J. D. (2006), Can machine learning be secure?, in ‘Proceedings of the 2006 ACM Symposium on Information, computer and communications security’, ACM, pp. 16–25. Bhuyan, M. H., Bhattacharyya, D. K. and Kalita, J. K. (2014), ‘Network anomaly detection: methods, systems and tools’, IEEE communications surveys & tutorials 16(1), 303–336. ˇ Biggio, B., Corona, I., Maiorca, D., Nelson, B., Srndi´ c, N., Laskov, P., Giacinto, G. and Roli, F. (2013), Evasion attacks against machine learning at test time, in ‘Joint European Conference on Machine Learning and Knowledge Discovery in Databases’, Springer, pp. 387–402.
42
REFERENCES
43
Biggio, B., Fumera, G. and Roli, F. (2014), ‘Security evaluation of pattern classifiers under attack’, IEEE Transactions on Knowledge and Data Engineering 26(4), 984– 996. Biggio, B., Nelson, B. and Laskov, P. (2012), ‘Poisoning attacks against support vector machines’, arXiv preprint arXiv:1206.6389 . Biggio, B., Rieck, K., Ariu, D., Wressnegger, C., Corona, I., Giacinto, G. and Roli, F. (2014), Poisoning behavioral malware clustering, in ‘Proceedings of the 2014 Workshop on Artificial Intelligent and Security Workshop’, ACM, pp. 27–36. Brugger, S. T. and Chow, J. (2007), ‘An assessment of the darpa ids evaluation dataset using snort’, UCDAVIS department of Computer Science 1(2007), 22. Buczak, A. L. and Guven, E. (2016), ‘A survey of data mining and machine learning methods for cyber security intrusion detection’, IEEE Communications Surveys & Tutorials 18(2), 1153–1176. Carlini, N. and Wagner, D. (2017), ‘Adversarial examples are not easily detected: Bypassing ten detection methods’, arXiv preprint arXiv:1705.07263 . Chollet, F. (2015), ‘keras’, https://github.com/fchollet/keras. Chuvakin, A., Schmidt, K. and Phillips, C. (2012), Logging and log management: The authoritative guide to understanding the concepts surrounding logging and log management, Newnes. Claycomb, W. R., Legg, P. A. and Gollmann, D. (2014), ‘Guest editorial: Emerging trends in research for insider threat detection.’, JoWUA 5(2), 1–6. CTU-13 dataset (2014). URL: http://mcfp.weebly.com/the-ctu-13-dataset-a-labeled-dataset-with-botnetnormal-and-background-traffic.html Fiore, U., Palmieri, F., Castiglione, A. and De Santis, A. (2013), ‘Network anomaly detection with the restricted boltzmann machine’, Neurocomputing 122, 13–23. Gao, N., Gao, L., Gao, Q. and Wang, H. (2014), An intrusion detection model based on deep belief networks, in ‘Advanced Cloud and Big Data (CBD), 2014 Second International Conference on’, IEEE, pp. 247–252. Glasser, J. and Lindauer, B. (2013), Bridging the gap: A pragmatic approach to generating insider threat data, in ‘Security and Privacy Workshops (SPW), 2013 IEEE’, IEEE, pp. 98–104.
REFERENCES
44
Goodfellow, I. J., Shlens, J. and Szegedy, C. (2014), ‘Explaining and harnessing adversarial examples’, arXiv preprint arXiv:1412.6572 . Grosse, K., Papernot, N., Manoharan, P., Backes, M. and McDaniel, P. (2016), ‘Adversarial perturbations against deep neural networks for malware classification’, arXiv preprint arXiv:1606.04435 . Huang, L., Joseph, A. D., Nelson, B., Rubinstein, B. I. and Tygar, J. (2011), Adversarial machine learning, in ‘Proceedings of the 4th ACM workshop on Security and artificial intelligence’, ACM, pp. 43–58. Hutchins, E. M., Cloppert, M. J. and Amin, R. M. (2011), ‘Intelligence-driven computer network defense informed by analysis of adversary campaigns and intrusion kill chains’, Leading Issues in Information Warfare & Security Research 1, 80. Intrusion detection evaluation dataset (2012). URL: http://www.unb.ca/cic/research/datasets/ids.html KDD Cup 1999 Data (1999). URL: http://kdd.ics.uci.edu/databases/kddcup99/kddcup99.html Kent, A. D. (2016), ‘Cyber security data sources for dynamic network research’, Dynamic Networks and Cyber-Security 1, 37. Kurakin, A., Goodfellow, I. and Bengio, S. (2016), ‘Adversarial examples in the physical world’, arXiv preprint arXiv:1607.02533 . McHugh, J. (2000), ‘Testing intrusion detection systems: a critique of the 1998 and 1999 darpa intrusion detection system evaluations as performed by lincoln laboratory’, ACM Transactions on Information and System Security (TISSEC) 3(4), 262–294. McKinney, W. (2011), ‘pandas: a foundational python library for data analysis and statistics’, Python for High Performance and Scientific Computing pp. 1–9. Milenkoski, A., Vieira, M., Kounev, S., Avritzer, A. and Payne, B. D. (2015), ‘Evaluating computer intrusion detection systems: A survey of common practices’, ACM Computing Surveys (CSUR) 48(1), 12. M¨ uller, O., Junglas, I., vom Brocke, J. and Debortoli, S. (2016), ‘Utilizing big data analytics for information systems research: challenges, promises and guidelines’, European Journal of Information Systems 25(4), 289–302.
REFERENCES
45
Nelson, B., Barreno, M., Chi, F. J., Joseph, A. D., Rubinstein, B. I., Saini, U., Sutton, C. A., Tygar, J. D. and Xia, K. (2008), ‘Exploiting machine learning to subvert your spam filter.’, LEET 8, 1–9. Nguyen, A., Yosinski, J. and Clune, J. (2015), Deep neural networks are easily fooled: High confidence predictions for unrecognizable images, in ‘Proceedings of the IEEE Conference on Computer Vision and Pattern Recognition’, pp. 427–436. NSL-KDD dataset (2009). URL: http://www.unb.ca/cic/research/datasets/nsl.html Papernot, N., Goodfellow, I., Sheatsley, R., Feinman, R. and McDaniel, P. (2016), ‘cleverhans v1.0.0: an adversarial machine learning library’, arXiv preprint arXiv:1610.00768 . Papernot, N., McDaniel, P. and Goodfellow, I. (2016), ‘Transferability in machine learning: from phenomena to black-box attacks using adversarial samples’, arXiv preprint arXiv:1605.07277 . Papernot, N., McDaniel, P., Goodfellow, I., Jha, S., Celik, Z. B. and Swami, A. (2016), ‘Practical black-box attacks against deep learning systems using adversarial examples’, arXiv preprint arXiv:1602.02697 . Papernot, N., McDaniel, P., Jha, S., Fredrikson, M., Celik, Z. B. and Swami, A. (2016), The limitations of deep learning in adversarial settings, in ‘Security and Privacy (EuroS&P), 2016 IEEE European Symposium on’, IEEE, pp. 372–387. Papernot, N., McDaniel, P., Wu, X., Jha, S. and Swami, A. (2016), Distillation as a defense to adversarial perturbations against deep neural networks, in ‘Security and Privacy (SP), 2016 IEEE Symposium on’, IEEE, pp. 582–597. Pedregosa, F., Varoquaux, G., Gramfort, A., Michel, V., Thirion, B., Grisel, O., Blondel, M., Prettenhofer, P., Weiss, R., Dubourg, V., Vanderplas, J., Passos, A., Cournapeau, D., Brucher, M., Perrot, M. and Duchesnay, E. (2011), ‘Scikit-learn: Machine learning in Python’, Journal of Machine Learning Research 12, 2825–2830. Saad, S., Traore, I., Ghorbani, A., Sayed, B., Zhao, D., Lu, W., Felix, J. and Hakimian, P. (2011), Detecting p2p botnets through network behavior analysis and machine learning, in ‘Privacy, Security and Trust (PST), 2011 Ninth Annual International Conference on’, IEEE, pp. 174–180.
REFERENCES
46
Sommer, R. and Paxson, V. (2010), Outside the closed world: On using machine learning for network intrusion detection, in ‘Security and Privacy (SP), 2010 IEEE Symposium on’, IEEE, pp. 305–316. Song, J., Takakura, H., Okabe, Y., Eto, M., Inoue, D. and Nakao, K. (2011), Statistical analysis of honeypot data and building of kyoto 2006+ dataset for nids evaluation, in ‘Proceedings of the First Workshop on Building Analysis Datasets and Gathering Experience Returns for Security’, ACM, pp. 29–36. Stallings, W. and Brown, L. (2015), Computer Security: Principles And Practice, 3rd edn, Pearson. Szegedy, C., Zaremba, W., Sutskever, I., Bruna, J., Erhan, D., Goodfellow, I. and Fergus, R. (2013), ‘Intriguing properties of neural networks’, arXiv preprint arXiv:1312.6199 . Tavallaee, M., Bagheri, E., Lu, W. and Ghorbani, A. A. (2009), A detailed analysis of the kdd cup 99 data set, in ‘Computational Intelligence for Security and Defense Applications, 2009. CISDA 2009. IEEE Symposium on’, IEEE, pp. 1–6. Vom Brocke, J., Simons, A., Niehaves, B., Riemer, K., Plattfaut, R., Cleven, A. et al. (2009), Reconstructing the giant: On the importance of rigour in documenting the literature search process., in ‘ECIS’, Vol. 9, pp. 2206–2217. Xiao, H., Biggio, B., Nelson, B., Xiao, H., Eckert, C. and Roli, F. (2015), ‘Support vector machines under adversarial label contamination’, Neurocomputing 160, 53– 62. Zhou, Y., Kantarcioglu, M., Thuraisingham, B. and Xi, B. (2012), Adversarial support vector machine learning, in ‘Proceedings of the 18th ACM SIGKDD international conference on Knowledge discovery and data mining’, ACM, pp. 1059–1067.