Agent-Controlled Sharing of Distributed Resources in User Networks E. Costa-Montenegro1 , J.C. Burguillo-Rial1 , F. J. Gonzalez-Casta˜ no1 , 2 and J. Vales-Alonso 1
2
Departamento de Ingenier´ıa Telem´ atica, Universidad de Vigo, Spain, kike,jrial,
[email protected] Departamento de Tecnolog´ıa de la Informaci´ on y las Comunicaciones, Universidad Polit´ecnica de Cartagena, Spain,
[email protected]
Abstract In this chapter, we evaluate the feasibility of intelligent and distributed control of shared resources in user-managed networks. The user-managed network paradigm has become possible with the advent of broadband wireless networking technologies such as IEEE 802.11. In those networks, node cooperation can optimize the usage of shared external accesses to the Internet (set of links between the user network and the Internet). First, we provide an extensive introduction and the state of the art in related concepts such as multi-agent systems, user networks, peer to peer file exchanges and game theory. Then we present an evaluation of different agent-oriented distributed control schema, based on the concept of credit limits, on ideal mesh networks subjected to uniform traffic. Each node in the mesh network chooses to behave as a cooperator or a defector. Cooperators may assist in file exchange, whereas defectors try to get advantage of network resources without providing help in return. Finally, we present a realistic model of user network traffic and topology, and evaluate a new advanced agent-based distributed control scheme. The simulation results presented here confirm that it is possible to improve resource sharing in user networks using agents which check that file exchange services offered to neighbor nodes do not surpass appropriate credit limits and which take decisions autonomously from local information. As an external validation of our work, we have observed that popular P2P protocols like eMule, Kazaa and BitTorrent have been evolving towards the same credit-oriented strategies discussed in this chapter.
2
E. Costa-Montenegro et al.
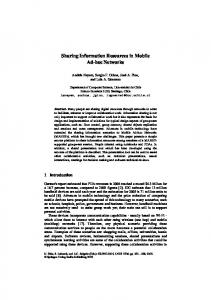
Fig. 1. User network with shared Internet links
1 Introduction User networks are totally controlled by the users, both at application and transport level. This paradigm has become possible with the advent of broadband wireless networking technologies such as IEEE 802.11, which allow for a fast and inexpensive network deployment. Figure 1 shows the concept of user network, built up of several nodes interconnected with high-capacity links. For applications such as peer-to-peer (P2P) file exchange [1], it may be useful to consider the “external” access to the Internet (set of links between the user network and the Internet shown in Figure 1) as a shared resource that can be optimized by node cooperation (i.e., if a node cannot serve its demand with its own external link, it requests help from another node via the high-bandwidth internal user network). Nodes decide if cooperation requests are granted or not, either by analyzing limited information on their neighbors states or only based on their own experience. In this work we aim at analyzing the conditions that enable cooperation in real user networks. In principle, it should trivially hold that cooperation enhances overall network performance. However, a small population of intrinsically non-cooperative users may lead to massive defection, since node agents decide their course of action from local information (as real users do). We could impose several conditions leading to node cooperation that would never hold considering user behavior in peer-to-peer file sharing services. Thus, the local decision algorithm of cooperation-prone nodes is the key issue to optimize the user network. We have developed a framework based on game theory [19] to analyze the node behaviour and to provide results that explain the conditions
Agent-Controlled Sharing of Distributed Resources in User Networks
3
for cooperative nodes to win the game, i.e., to become a majority. This framework helps us to accurately model the cooperation-defection problem, and to test possible agent strategies, yielding to global resource sharing and improving network performance. In order to hide the complexities of bandwidth sharing in the file-sharing application, we have modelled the user network as a game where cells (i.e. user nodes) choose between two different basic strategies: cooperation and defection. Cooperators assist neighbor cells in Internet file exchange (up to a given credit limit), while defectors do not offer help to neighbors (though they request help for their demands). Thus, defectors represent non-cooperating users, a typical problem in P2P networks, also known as “free-riders” [3]. As we will demonstrate, considering the spatial structure of the population, and restricting interaction to the local neighborhood, a stable spatial coexistence of cooperators and defectors becomes possible under certain conditions. Additionally, we will show that network performance strongly depends on the initial credit limit selected. Based on these results, we propose a feasible strategy for network stabilization based on user agents, which dynamically adapts their credit limit. Results show a notable capacity to minimize the impact of the cooperators/defectors rendezvous in the geometrical network scenario. Such strategies can be further adapted to other situations. For instance, the evolution of popular P2P protocols indicates they tend to take advantage of the same technique we proposed to set limits to cooperation, as a safeguard against defectors: each node sets credit limits for its peers. For example, this is the case of eMule [4], Kazaa [5], BitTorrent [6]. Thus, our assumption is realistic. Therefore, our goal is twofold. First, to show that agent-based cooperative nodes may become a majority in user networks, improving resource sharing, and second, that those agent-based nodes can easily learn to avoid free-riders by using adaptive credits. The chapter is organized as follows: section 2 describes user-managed networks. Section 3 describes peer-to-peer models and relate them with usermanaged nets. Section 4 briefly introduces some basic concepts of game theory. Section 5 introduces multi-agent systems. Section 6 proposes different strategies, a node topology, and behaviors that will be used as an approach in solving the problem of sharing distributed resources in user networks. Section 7 shows previous results obtained using a cellular automata approach. Section 8 describes the multi-agent approach to solve the same problem, and section 9 introduces a more realistic user network approach. Finally, section 10 presents the conclusions of this chapter.
2 User-Managed Networks User-managed networks have become possible with the advent of wireless technologies such as IEEE 802.11 [7]. They represent one of the last stages
4
E. Costa-Montenegro et al.
in network control evolution [8]. This evolution started with telephone networks. In them, Telcos controlled both transport and applications. Later, the Internet allowed users to control applications. Although Telcos still control transport in most of the Internet, in some scenarios carrier technology is affordable to end-users, and user-managed “islands” appear in a natural way [9, 10, 11]. For example, this kind of infrastructures is currently being used to provide broadband access in Spanish rural areas, as an expansion of DVB-S or DVB-T gateways. In addition, there exist ideas to turn user WiFi communities into commercial Telcos (for instance, the FON network [65]). FON network participants share resources (up to 40% of their wireless bandwidth) to build the network infrastructure, allowing external customers to connect to the network. As a reward, FON participants receive a share in the benefits and can access any network resource for free. This kind of network solutions may eventually yield to fully user-controlled and operated networks. It can be argued that sharing Internet accesses may be illegal. However, parasitism of operator resources is widespread and deserves academic attention. Consider, for example, the case of web caching [2], a P2P-boosting technique that exploits operator infrastructure by mimicking non-P2P network services at port level. A typical basic node in a wireless user-managed network is composed by a router, an access point (AP) and/or some wireless cards to set links with other basic nodes. Basic nodes may also be linked to a multi-user LAN (covering a building, for example). For the sake of clarity we assume that all basic nodes are “externally connected”. Additionally, we assume that user network capacity is larger than external access capacity (this holds for reasonable internal and external networking technologies, for example IEEE 802.11g and DSL respectively), and so the internal network always has spare capacity. In a user network, basic nodes can easily share contents, due to the large internal bandwidth. The bottleneck is the set of “external” connections to the Internet. By optimizing their usage, overall performance (and, as a consequence, user satisfaction) can be greatly improved. By network stability we refer to the condition such that external demands (e.g., downloads or uploads at the edges of the user network for peer-topeer file exchanges) can be satisfied with external capacity, on average. This certainly holds if: 1. The external demand of each basic node can be satisfied with its own external capacity, on average, or 2. All the basic nodes cooperate via the user network and their combined external demand can be satisfied with their combined external capacity, on average. Even if the first condition holds (and therefore cooperation is not strictly necessary to guarantee network stability), cooperation minimizes demand service time (nodes with temporarily idle external connections can help neigh-
Agent-Controlled Sharing of Distributed Resources in User Networks
5
bors with demand peaks). However, there is no central authority, and selfish nodes will probably try to maximize their performance. This issue has demanded academic attention. For instance, in [46] it is demonstrated that, when users make noncooperative decisions, there is room to improve network performance. The authors analyze the problem of network equilibria and propose solutions to enhance performance during both the provisioning phase of the network and run-time. As in our work, they apply game theory to the study of the network. Another related work is [47], where several selfish share a communication network. Each user seeks to optimize its own performance by controlling the routing of its flow demand, which corresponds to a noncooperative game. The authors investigate the Nash equilibrium of those systems.
3 Peer-to-Peer Models Peer-to-peer architectures scale and self-organize themselves in the presence of a highly variable population of nodes, with network and computer failures, without the need of a central server and the overhead of its administration. The inherit characteristics of such architectures typically are scalability, opposition to censorship and centralized control, as well as increased access to resources. Administration, maintenance, responsibility for the operation, and even the notion of “ownership” of peer-to-peer systems are also distributed among the users, instead of being handled by a single company, institution or person [45]. These characteristics make P2P systems ideal to support diverse distributed applications. Namely, • Distributed Computing. This category includes systems whose aim is to take advantage of the available peer computer processing power (CPU cycles). Computer-intensive tasks are divided into small work units and distributed among the peers. Some examples are Seti@home (presently under Boinc infrastructure) [55, 56], genome@home [53, 54] or Condor [57]. • Direct Communication. P2P has also been employed for direct real-time communication between peer users. Examples include chat and instant messaging applications, such as chat/IRC, instant messaging aplications and discussion boards [13]. • Distributed Databases. They provide the infrastructure and querying capability for peer-to-peer databases. Some examples are [48, 58, 51, 59]. • Content Distribution. Certainly, the killer-app of P2P computing is file sharing. Some well-known examples are eMule [4], Kazaa [5] or BitTorrent [12]. • Internetworking. To this category belong peer-to-peer services like multicast systems [60, 49], overlay routing [14], internet indirection infrastructures [61], and security applications providing protection against denial of service or virus attacks [62, 63, 64].
6
E. Costa-Montenegro et al.
In all the previous examples, the P2P model improve resource sharing. Although cooperation can be a useful strategy, it consumes node resources and degrades performance of user equipment. Since rational selfish peers always try to improve their performance, they can refuse to supply service to others when they do not have clear incentives. Then, the “Tragedy of Commons” [15] may appear leading peers to generalized defection. Its main cause in P2P networks is free-riding [3]. Discover free-riding users in P2P systems is difficult for several reasons [16]: • Large population and high turnover: P2P applications have many users and many of them are short-lived. • Asymmetry of interest: transactions lack reciprocity. • Zero-cost identity: nodes can change their identity at no cost. • Lack of history: a node cannot keep all the identities of all peers with past transactions. • Unawareness of others: peers ignore the transactions by other peers. These conditions are the main cause of free-riding in P2P systems. In order to solve them several incentive mechanisms have been proposed. Previous works can be classified in two categories: token-based schemes [17] and reputation-based schemes [18]. The management of system-specific currencies for the former becomes complex as the network grows and a centralized secure credit authority becomes necessary. This mechanism, based on shared transaction history, is vulnerable to collusion attacks, when several defectors claim to have received service from other defectors. The MaxFlow algorithm in [16] solves this problem but it is quite expensive and requires extra information to construct the graph. On the one hand, considering user networks, we observe that they share a number of problems with general P2P systems: large population, asymmetry of interest and unawareness of others. On the other hand, fixed nodes in user networks do not always deal with high turnover, zero-cost identity and lack of history. These problems may appear if we consider mobile user networks with dynamic connection establishment. We will not consider this issue in this chapter.
4 Game Theory Game theory [19] provides useful mathematical tools to understand the possible strategies that selfish agents may follow when they choose a course of action. The simplest type of game is the single-shot simultaneous-move game. In it, all agents must choose one action and all actions are effectively simultaneous. Each agent receives a utility that is a function of the combined set of actions. In an extended-form game, agents participate in turns and receive a payoff at the end of a sequence of actions. In general, a single-shot game
Agent-Controlled Sharing of Distributed Resources in User Networks
7
is a good model for many distributed systems, with encounters that require coordination. The context of cooperative games and cooperation evolution has been extensively studied in biological, social and ecological contexts [20], seeking general theoretical frameworks like the Prisoner’s Dilemma (PD). In his seminal work, Axelrod has shown that cooperation can emerge in a society of individuals with selfish motivations [21]. For a review of related work in the last twenty years see [22]. Game Theory and the Generalized Prisoner’s Dilemma have been applied to solve incentive problems in P2P systems. Examples can be found in [16] and BitTorrent [12] itself has considered an alternative of the Tit-for-Tat strategy [21]. BitTorrent proposes a Bit-for-Bit incentive mechanism, where peers receive as they contribute. In a simulation environment with many repeated games, persistent identities and no collusion, Axelrod [21] shows that the Tit-for-Tat strategy is dominant. Even regardless of its simplicity, in case of peers with asymmetric network bandwidth this mechanism degrades the performance of the whole system.
5 Multiagent Systems Before introducing multiagent systems (MAS), we need to define what we understand by an agent. Unfortunately, there is no general agreement in the research community. Therefore we introduce here a classical one [23]: ”the term agent is used to denote a hardware or (more usually) software-based computer system that mainly enjoys the following properties”: • Autonomy: agents operate without the direct intervention of humans or others, and have some kind of control over their actions and internal state; • Social ability: agents interact with other agents (and possibly humans) via some kind of agent-communication language; • Reactivity: agents perceive their environment, and respond in a timely fashion to its changes; • Pro-activeness: agents do not simply act in response to their environment, they are able to exhibit goal-directed behavior by taking the initiative. There are some other attributes that can be present, but usually they are not considered as a requisite: mobility, veracity, benevolence, rationality and adaptability (or learning) [23]. To simplify, an agent is any entity that can perceive its environment through sensors and change it with actuators [24]. Agents coexist and interact with other agents in different ways. A system consisting of an interacting group of agents is called a Multiagent System (MAS), and the corresponding subfield of AI that deals with principles and design of MAS is called Distributed AI.
8
E. Costa-Montenegro et al.
In Software Engineering, MAS technology is viewed as a novel and promising paradigm. A complex software system can be treated as a collection of many agents, each one with its own local functionality and properties, achieving total system functionality. Some of the benefits of MAS technology in large scale software systems are [25]: • Speedup and efficiency, due to asynchronous and parallel computation. • Robustness and reliability, in the sense that the whole system can undergo a “graceful degradation” when one or more agents fail. • Scalability and flexibility, since it is easy to add new agents to the system. • Cost, assuming that an agent is cheap compared to the whole system. • Development and reusability, since it is easier to develop and maintain a modular than monolithic software. So far, multiagent systems have been applied in different domains. Some examples are: • Social sciences, where MAS technology is used for simulating interactivity and other social phenomena [21, 26, 27]. • Distributed data mining and information retrieval [28]. • Virtual reality and computer games use agents to implement intelligent behavior [29]. • In robotics, a common application is to manage a group of robots to locate themselves to navigate through their environment [30]. • Internet auctions and e-commerce [31, 32]. But these are just some examples, since MAS have also been applied to control, scheduling and planning of manufacturing, air traffic management, medicine, e-Learning, telecommunication management, etc. The interested reader can find examples of MAS applications in these domains in some recent books [33, 34, 35, 36].
6 Strategies, Node Topology and Behavior In this chapter we define a composite spatial game where actions are effectively simultaneous but agents may interact with several neighbors at a time. Every agent receives a data throughput payoff every turn. The better the strategy in the context, the better the payoff, i.e., the higher the throughput. Note that the payoff of a given agent depends on the choices made by the rest. After a predefined set of turns (24 hours = one day), each agent i chooses a strategy si ∈ S, where S is the set of all strategies. The agent will keep this strategy for 24 hours. We assume that, each hour, if the queue length of a cell exceeds a defined threshold, the agent ruling that cell requests help from its neighbors for every pending file (incoming or outgoing). Neighbor agents may grant their external connections or not, depending on their present state and strategy. We
Agent-Controlled Sharing of Distributed Resources in User Networks
9
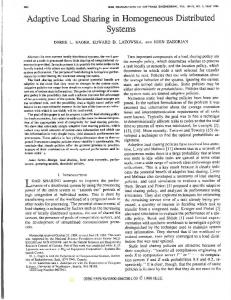
implement help transactions using the Contract Net Protocol: every neighbor answer with an offers or a refusal. The requesting agent selects the offering cell that provided the best average throughput in the past. We model the different strategies of cooperation and defection as follows: • Cooperation: a cooperator always helps its neighbors without limit. Cooperation models altruist users in P2P networks. • Cooperation with Credit Limit: a cooperator helps its neighbors up to a certain fixed credit limit (denoted by CreditLimit). If cell j reaches its credit limit, cell i does not help j again unless j returns its debt by helping i when requested. • Agent-based : a node following this strategy will individually and dynamically adapt its CreditLimit value to optimize the interaction with its neighbors. • Defection: a defector never helps, so it will never grant its external connection. Nevertheless, defectors ask their neighbors for help when they need it. Thus, they use shared resources opportunistically as many users do in P2P networks (free-riders). Concerning cell demand distribution, depending on the model we have used two or three cell types denoted by A, B and C. Different cell types have disjoint busy periods during the day, as we will explain in next sections. For the spatial distribution of the nodes we consider a two-dimensional square lattice consisting of N nodes. Each node will follow one of the basic strategies . Figure 2 shows a cell node i with a strategy si and two possible neighborhoods. In the model discussed in the section 7, every cell (i.e. node) in the square lattice will interact with its neighbors to handle external traffic. Thus, there are both local and spatial interactions between neighbor cells.
Fig. 2. Node Ni and two possible neighborhoods (first with 4 nodes Ni 1 to Ni 4, and second with 12 nodes Ni 1 to Ni 12)
10
E. Costa-Montenegro et al.
If we let every node in the system to interact with the remaining N − 1 nodes, we have a panmictic population. However, in real user networks each node interacts with only a few neighbors. Thus, we consider that each cell i only interacts with the K cells in its immediate neighborhood. Interaction is driven by demand service times of externally inbound or outbound data, i.e., when the external service queue of a node is larger than a particular threshold, the node request help from its neighbors to handle the files involved. In order to introduce a time scale, the time unit to generate new traffic demands and for neighbors to interact is an hour. The total number of interactions per hour can be K × N or less. We decided that, during a 24-hour timeframe (a day), the strategy si of an node does not change, so it plays a series of single shot games. We also decided to consider a day as the minimum time unit for strategy changes, since traffic patterns are similar in the same hours in different days. After a day passes, si can change as described next for two scenarios: • Imitation scenario. This scenario somehow models real situations where people exchange information about decisions with their neighbors and imitate some of them. The main interest of this scenario is to provide insight on what happens if there is information sharing. It is very popular in many prisoners dilemma spatial games [16, 37]. This scenario allows to determine if cooperation is feasible or not. Therefore, it allows us to predict the most popular strategy in a game with shared information. It assumes that every node may know the previous strategy chosen by its K neighbors at the end of the day. Node i mimics the strategy of its “best” neighbor k with the best worst-case hourly throughput during the last day (out of 24 measurements). We decided to compare hourly rather than daily throughput to let user satisfaction be based on a compromise between worst-case and average experience. At the end of every day d, node i calculates x = argmaxx∈K (minh∈d (th(h, x)) where th(h, x) is the throughput of neighbor x during hour h. Then, node i mimics the strategy of node x. Obviously, it keeps its previous behavior if the most successful node followed the same strategy. • Isolated scenario. This scenario models the situation where nodes do not have information about decisions taken by their neighbors and simply use their own experience from the past to choose their future strategy. Each node compares its worst-case throughput during the last day (out of 24 hourly measurements per day) with the average values it obtained in the past with the alternative strategies, and employ a given algorithm to decide the strategy for the next day.
Agent-Controlled Sharing of Distributed Resources in User Networks
11
7 A Simple Cellular Automata Approach In this section, we will summarize diverse interesting characteristics of the spatial game obtained when we used stochastic cellular automata in the simulations [37, 39]. A cellular automata is a discrete model that consists of a regular grid of cells, each one with a finite number of states. Time is also discrete, and the state of a cell at time t is a function of the states of a finite fixed set of cells (called its neighborhood) at time t − 1. These neighbors are a selection of cells relative to the specified cell, and do not change. Every cell follows the same rule for state updating, based on the values in its neighborhood. Each time the rules are applied to the whole grid a new generation of states results. Starting with an initial random distribution of cooperators and defectors, several spatial domains appear, each of them dominated either by cooperators or defectors. Also, we noticed that, in the long run, the percentages of cooperators and defectors become stationary. As previously said, all case studies take place in a completely symmetric user network. Each cell is linked to K neighbors (we have considered two cases K = 4 and K = 8). The relevant settings for our application are: • There are (50 × 50 = 2,500) cells in the user network. • Demand distribution settings are: – Busy period: the cell generates uniformly distributed demand service times with a mean of 8 units during 12 hours a day. – Quiet period: analog to the previous case, with a mean of 1 unit during the remaining 12 hours. • External links have a bandwidth of 5 demand units per hour. Note that this is slightly above the average demand (0.5 × 8 + 0.5 × 1 = 4.5), and therefore external capacity is loaded. • Cell demand files have a maximum size of two demand units. • At time origin, we assign the two node strategies (cooperation with Credit Limit or defection) and the two node traffic patterns (A or B) with equal probability. • Every node (including defectors) asks its neighbors for help if it generates over 5 demand units per hour. • Two scenarios: Imitation scenario (as defined in section 6) and Isolated scenario, where each node is a stochastic automaton with two states corresponding to the two possible strategies. Each node compares its worstcase throughput during the last day (out of 24 hourly measurements per day) with the average values obtained in previous history by the other strategy. If its throughput is better than the average value achieved by the alternative strategy, then the node linearly increases the probability to select the current strategy si for the next game (i.e. day). We use the linear reinforcement scheme for stochastic automata detailed in [38]. At the end of every day d, node i calculates f (i, d)=minh∈d (th(h, i)). Then:
12
E. Costa-Montenegro et al.
–
If f (i, d) is strictly higher than the daily average values of f up to that moment when following the alternative strategy, then: P robsi [d + 1] = P robsi [d] + 0.1(1 − P robsi [d]) P rob−si [d + 1] = 0.9P rob−si [d] (−si denotes the alternative strategy) – The strategy for the next day is selected according to probabilities P robsi (d + 1) and P rob−si [d + 1]. Initially, we ran our simulations with a single cell type (A or B). In this case, defectors became a majority. We expected this result, since all the cells are typically busy at the same time of the day and, as a consequence, cooperation is not rewarding. When we considered two cell types (A and B), we observed the following: • Let perc C and perc D be the percentages of cooperators and defectors at simulation end, respectively. It happens that perc C >> perc D in permanent state if cooperators choose CreditLimit wisely. The larger the value of perc C, the larger the global network throughput. Roughly, this holds for CreditLimit between 10 and 30 in all cases. Figures 3 and 4 show the percentage of cooperating cells after 2400 simulated hours, in the imitation and isolated scenarios respectively. Cooperation success as a function of CreditLimit suggests that, in an agent-based implementation, agents should adjust CreditLimit dynamically, according to their context and internal queue considerations. • Although cooperators and defectors are completely mixed at simulation start, cooperators tend to form confederations. This spatial distribution tends to become stable. Figures 5 and 6 show the evolution of the percentages of cooperators and defectors in the imitation and isolated scenarios. • The choice of CreditLimit is specially critical in the imitation scenario: if cooperators are too conservative (low CreditLimit) or too generous (high CreditLimit), cooperation is less successful than defection. However, in the isolated scenario, this effect is only evident if cooperators are conservative. A possible explanation for the result in the imitation case is that, for CreditLimit with low values around 10, defectors can only fool cooperators at the beginning of the game, since debts have to be promptly returned. If cooperators are too generous, defectors fool them completely. On the other hand, if cooperators are too conservative, their behavior approaches that of defectors. • The peak of cooperation success is lower in the isolated case. This is logical, since nodes do not share information. In any case, we show that even the simple stochastic automata in the isolated scenario gets close to the cooperation peak in the imitation scenario.
Agent-Controlled Sharing of Distributed Resources in User Networks
Fig. 3. Percentage of cooperators after 2400 hours, imitation scenario
Fig. 4. Percentage of cooperators after 2400 hours, isolated scenario
13
14
E. Costa-Montenegro et al.
Fig. 5. Evolution of cooperators (C) and defectors (D) (K = 4, CreditLimit=7.5, 100 days, imitation scenario)
8 A Basic Multi-Agent Approach From the previous section we realize that cooperation can be considered a successful strategy in user networks. In this section we adapt the simulator to explore more complex strategies following a multi-agent approach. 8.1 Strategy types In this approach we model three different strategies as follows: • Defection: a defector never helps but asks their neighbors for help. A defector models a free-rider. • Cooperation: a cooperator always helps its neighbors without limit. Cooperation models altruist users in P2P networks. • Agent-based : a node following this strategy will dynamically and individually adapt its CreditLimit value to optimize the interaction with its neighbors. As previously said in section 6, we implement help transactions using the Contract Net Protocol.
Agent-Controlled Sharing of Distributed Resources in User Networks
15
Fig. 6. Evolution of cooperators (C) and defectors (D) (K = 4, CreditLimit=7.5, 200 days, isolated scenario)
8.2 Network traffic For the purposes of this section, we consider three types of nodes: A, B and C. They generate demand service times (externally inbound or outbound data) during disjoint busy and quiet periods: • A nodes: The busy period lasts from hours 0 to 8 with uniformly distributed demand service times with an average of 8 units. The quiet period has an average of 1 unit during the remaining 16 hours. • B nodes: The busy period lasts from hours 8 to 16 with an average of 8 units. The quiet period has an average of 1 unit during the remaining 16 hours. • C nodes: The busy period lasts from hours 16 to 24 with an average of 8 units. The quiet period has an average of 1 unit during the remaining 16 hours. With these node types we model the three typical behavior of Internet users: (A) for late night users (p.e. students), (B) for daily work users (p.e. commercial nodes); and (C) for leisure-time users (workers at home). We also choose an average of 8 units during the busy period, which exceeds a bit the service time per hour (5 units). The global service demanded per node in a
16
E. Costa-Montenegro et al.
day averages (8x8+1x16 = 80), which is less than (24x5 = 120). So we fulfill the two conditions necessary for network stability, described in section 2. 8.3 Simulation scenarios We consider again two simulation scenarios: • Imitation scenario: this is the same scenario in section 6. The only difference is that agents learn the CreditLimit value as described later. • Isolated scenario: We take a similar approach to the one in [40]. We consider that every agent stores a vector with the number of times N Ti that agent i has employed every possible strategy. We define a strategy efficiency estimator as: EEi (s, d + 1) := α × f (i, d) + (1 − α) × EEi (s, d) Where f (i, d) = minh∈d (th(h, i)) represents, the minimum throughput value (th) obtained by agent i during any hour of that day. We consider the worst throughput, as users try to improve their worst conditions. The α parameter is given by the formula: α=w+
1−w N Ti (s)
Being N Ti (s) the number of times that agent i uses the strategy s and w is a real-valued constant. We set w=0.3 considering the results described in [40]. The term (1 − w)/N Ti (s) is a correcting factor, which has a major effect only when N Ti (s) is low. When N Ti (s) grows this term becomes negligible with respect to w. To select the new strategy for the next day we need a probability distribution. Initially, we force every agent to test every possible strategy at least once. Then we perform: ENi (s) = EEi (s, d + 1)n where n is a positive real-valued parameter. To turn this into a probability, for every strategy s ∈ S: P robi (s) =
ENi (s) ETi
P Being ETi = S ENi (s) the normalization factor. Then clearly ENi (s) bias the selection towards strategies that have performed well in the past. The strength of the bias depends on n; the larger the value of n, the stronger the bias. With high values of n (e.g., n > 20) the agent will always choose the strategy with the best record. But as explained in [16], this option does not allow the agent to explore other strategies when there are changes in the context. Therefore we set n = 10.
Agent-Controlled Sharing of Distributed Resources in User Networks
17
8.4 Learning CreditLimit By using an agent-based strategy we want every node to learn the best CreditLimit it should apply considering its traffic conditions and its context, i.e., the surrounding neighbors and the interaction with them. The agent has a short time to explore the space of values of CreditLimit (CL), since a delay in the convergence to the right value could cause throughput loses. In this framework, we consider that genetic algorithms perform well, and they are simpler than other optimization techniques [41]. An evolutive algorithm considers a population that evolves on three phases: couple selection, crossover and sporadical mutation. We considered the following simple evolutive algorithm: 0. Every agent takes one random sample in every interval: [1,10], [10,20], [20,30], [30,40], [40,50]. 1. The agent chooses the best values of CreditLimit (CL1 , CL2 ) obtained and they become the selected couple. The other CL values are forgotten. 2. The newborn CL3 is a linear combination (crossover) of its parents: CL3 = CL1 + (1 − x)CL2 where x = rand(0, 1). 3. Mutation: IF (rand(0, 1) < 12/Hours Elapsed) THEN CL3 = CL3 + rand(−5, 5) 4. If CL3 is better than CL1 and CL2 then the worst parent is replaced. 5. Return to step 2. Note: In step 3, the first check takes 24 hours, and so the probability is less than 1. We also limit the CreditLimit value range to [1, 50] after considering larger intervals that were not used by the agents but introduce search delays. 8.5 Simulation results Now we present the results of the simulations performed with our Java UserNet simulator (freely avaliable on demand). We considered a cell lattice of (25 x 25 = 625) cells in the user network. We also considered the initial asignament of the 3 types of nodes and the 3 strategies equally probable. Every node neighborhood has 4 nodes as described in figure 2. • Imitation scenario Figure 7 shows the results of the evolution of cooperators, defectors and agent-based nodes in this scenario after 100 days. Initially, the defectors (middle curve) reach a value near 50% of the population, but at the end their percentage to become zero. None of the naive cooperators were successful. Only the agent-based strategy becomes useful. Agent-based nodes are a majority by imitation. Figure 8 shows the spatial distribution of defectors (D, dark cells), agentbased strategies (A, less dark cells) and cooperators (C, lighter cells) after 20 days in this imitation scenario. Cooperators may survive for a while in
18
E. Costa-Montenegro et al.
the presence of agent-based strategy nodes as they receive certain amount of cooperation, but they are very sensible to the attack of defectors. Nodes with agent-based strategy try to stay together to avoid defectors and become successful in the long term as shown if figure 7. Concerning the value of CreditLimit the agents learn, in our simulations the average value obtained is 22.5 (in 10 runs) with a variance of 12.6, and most of the values fall in the interval [5, 30]. This is coherent with the cellular automata results in section 7. Figure 9 shows a throughput comparison among the three strategies. It can be seen that the agent-based strategy performs in average much better than the others, but cooperators achieve a higher throughput peak sometimes. Their oscillation is also higher depending on whether they have defectors in the surroundings or not. • Isolated scenario Figure 10 shows the frequency evolution of the strategies along 50 days. The agent-based strategy becomes the most popular followed by defection. Cooperators still survive, linked to or surrounded by agent-based nodes as shown in figure 11, where darker cells are defectors, lighter ones cooperators and less dark ones agent-based nodes. In fact, agent-based nodes form somehow a skeleton to group co-operators around them with defectors surviving isolated and mainly exploiting cooperators. The value of CreditLimit the agents learn had an average of 20.8 (in 10 runs) with a variance of 11.2, and most of the values fall in the interval [5, 30]. Figure 12 shows the throughputs the three strategies achieve. In the beginning defectors have better results because they exploit cooperators and waste the CreditLimit provided by agent-based nodes. Then, after 400 hours (around 17 days) cooperators and (mainly) agent-based nodes get stronger. In the end, defectors perform half-better than the others. Therefore, learning nodes chose the agent-based strategy as the most effective to avoid defectors (i.e. free-riding) and to improve their daily throughput.
9 A More Realistic Multi-Agent Approach In this section we consider more realistic probability distributions for requests and user network topologies and compare our results with the scenarios presented in previous sections. 9.1 Considerations on user network topology and traffic To model a realistic user network topology with P2P traffic, we employ the IEEE 802.11 user network deployment algorithm in [42]. Figure 13 shows a
Agent-Controlled Sharing of Distributed Resources in User Networks
19
Fig. 7. Evolution of cooperators (C), defectors (D) and agent-based (A) nodes (K = 4, 100 days, imitation scenario)
resulting user network in Vigo (Spain), with 46 node locations and the corresponding wireless links for near maximum network bandwidth (AP channel cellular planning as in [43], for 50x50 m2 cells). Regarding traffic, we model elapsed times between node demands of P2P chunk transfers (either incoming our outgoing) by means of Pareto distributions, following the well-known result in [44]. The exact settings are provided later. 9.2 Control strategies, scenarios and settings In this scenario, each node will have as many neighbors as in figure 13, and for the sake of realism, connection bandwidth between neighbors will be given by distance, as in IEEE 802.11 connections. Agents keep the same strategy for 24 hours, since hourly traffic patterns are similar across different days. Once a day passes, nodes can change as described below for two different control scenarios: • Imitation scenario: Same as in section 6. • Isolated scenario: Same as in section 8.3, but this time we set n = 5 because, due to the increasing complexity, it was needed that nodes explore strategies deeper than in previous sections.
20
E. Costa-Montenegro et al.
Fig. 8. Spatial distribution of cooperators (C), defectors (D) and agent-based (A) nodes (K = 4, 20 days, imitation scenario)
We model both scenarios with different strategies, as explained in section 6. In section 9.3, using non-adaptive credit limit, we will use the strategies: defection and cooperation with CreditLimit. Later in the same section, using adaptive credit limit we will use the strategies: defection and agent-based. Concerning node demand distribution, we consider two node types, A and B, also as defined in section 6. We set the system parameters as follows: • Type A nodes generate maximum-activity traffic between 12 PM and 12 AM, and minimum-activity traffic otherwise. Type B nodes have opposite maximum and minimum activity timeframes. • All the nodes have an external 512 Kbps DSL access, i.e. 18 Gbph. • P2P chunk size is 512 KB (4 Mb). • During maximum and minimum activity timeframes, there are respective average node demands of 2880 Mbph and 360 Mbph. Thus, the aggregated external access is highly loaded (≈ 90 % ). • Pareto distribution settings for elapsed times between successive chunk demands (inbound or outbound) are a = 2.5, b = 3.0 and c = 0 for maximum activity timeframes (average=5 s, standard deviation= 4.5 s)
Agent-Controlled Sharing of Distributed Resources in User Networks
21
Fig. 9. Throughput comparison of cooperators (C), defectors (D) and agent-based (A) nodes (K = 4, 100 days, imitation scenario)
and a = 4.0, b = 30.0 and c = 0 (average=40 s, standard deviation=14.14 s) for minimum activity time-frames. 9.3 Simulation results Non-adaptive credit limit From these parameter values, we define a model with the strategies of defection and cooperation with CreditLimit that we introduced in section 6. Table 1 shows samples of the percentages of cooperators in permanent state vs. different credit limit values (in Mb). The plots are concave in all cases. We observe the following: • In ideal networks, imitation and isolated scenarios behave as in section 7, i.e. a concave plot that reaches a peak for a certain credit limit setting. Also, the more the information on neighbor nodes (imitation scenario), the higher the level of resource sharing. • In both scenarios, the permanent-state percentages of both strategies are similar for near-zero credit limits. This is logical, since a cooperator with zero credit limit is equivalent to a defector. • As credit limit grows, defectors tend to became a majority.
22
E. Costa-Montenegro et al.
Fig. 10. Evolution of cooperators (C), defectors (D) and agent-based (A) nodes (K = 4, 50 days, isolated scenario) Scenario Credit limit Cooperators in permanent state (%) imitation 0 48% imitation 180 61% imitation 1800 72% imitation 7200 49% imitation 36000 42% isolated 0 48% isolated 180 57% isolated 1800 53% isolated 7200 53% isolated 36000 46% Table 1. Cooperators in permanent state
Adaptive credit limit In the previous simulation, all cooperators used the same credit limit. However, in a realistic multiagent approach, as explained in section 8.4, every node learns the best credit limit from its context, i.e. its surrounding neighbors and its interaction with them. So we now define a model with the strategies defection and agent-based that we introduced in section 6.
Agent-Controlled Sharing of Distributed Resources in User Networks
23
Fig. 11. Spatial distribution of cooperators (C), defectors (D) and agent-based (A) nodes (K = 4, 50 days, isolated scenario)
Agents cannot explore the space of credit limit values exhaustively, since a delay in choosing a reasonable value could degrade throughput. We employ the following genetic algorithm, similar to the one described in 8.4. Given the fact that, after some simulation time, the best CreditLimit interval was [1000, 5000] in all cases, the algorithm uses the initial intervals: [1000,2000], [2000,4000] and [4000,5000]. It implements mutation with rand(−500, 500). We apply mutation with a decreasing probability depending on the simulated hour (the first check takes place after 24 simulated hours, so the probability is always less than 1). Using this CreditLimit adaptation in cooperator nodes, we obtain the results in table 2, which shows the mean and standard deviation of CreditLimit values after 10 simulation runs. The cooperators learn CreditLimit values that confirm the results in table 1, as well as our previous results with cellular automata in section 7. We observe the following:
24
E. Costa-Montenegro et al.
Fig. 12. Throughput comparison of cooperators (C), defectors (D) and agent-based (A) nodes (K = 4, 50 days, isolated scenario)
Fig. 13. ”Vigo” user network with 7x9 cells, size of each cell 50x50 m2
Agent-Controlled Sharing of Distributed Resources in User Networks
25
Scenario
Average Standard deviation Cooperators in CreditLimit of CreditLimit permanent state (%) Imitation 1698 309.1 82% Isolated 2818 1084.2 71% Table 2. Cooperators in permanent state with adaptive credit limit
• Imitation yields better results than isolated scenario, because nodes share state information. • In the isolated scenario, the results improve by letting nodes learn their CreditLimit. The poor results in table 1 seem to be due to the fact that a global CreditLimit may be inadequate for some cooperator nodes. Figure 14 shows the evolution of cooperators and defectors in the imitation scenario. It represents a temporal window of 100 days. The number of cooperators increases and the percentages become stable after 23 days.
Fig. 14. Imitation scenario with adaptive CreditLimit. Cooperators win. The x axis represents time in seconds. Percentages become stable after 23 days.
Figure 15 shows the evolution of cooperators and defectors in the isolated scenario. We observe initial oscillations until the nodes determine their best strategy and CreditLimit values. After 58 days, cooperation emerges as the preferred strategy.
26
E. Costa-Montenegro et al.
Fig. 15. Isolated scenario with adaptive CreditLimit. Cooperators win. The x axis represents time in seconds. Percentages become stable after 58 days.
10 Conclusions In this chapter we present an abstraction of the problem of resource sharing in user networks. We have abstracted the main features of a real user network to obtain some simpler yet valid models. Section 7 shows that the simple stochastic cellular automata in the distributed scenario gets close to the cooperation peak in the centralized one. This fact encourages us to study more powerful decision algorithms, as we did in sections 8 and 9, using a multi-agent approach. Using the multi-agent approach in section 8, agents are allowed to learn and set their own credit limits. In the imitation scenario almost every single node selected the agent-based strategy. In the isolated scenario, where nodes do not share information, cooperating nodes (cooperators and agent-based ones) became the majority, even to a greater extend than in the previous cellular automata approach. Then, we realized that the multiagent approach for sharing resources in user networks is a good choice, because agent-based nodes become a majority thanks to their CreditLimit adaptation. Consequently, we decided to adopt a more realistic user network scenario in section 9. Even though the results of this last scenario were not as good as in section 8, they show that cooperation is still the preferred strategy. As our main conclusion, we have observed that a user network can obtain benefits from node cooperation if traffic demands are variable along the day. This is a real assumption in the Internet. Besides, the selection of agent-based management with individual credit limits provides the best results for every
Agent-Controlled Sharing of Distributed Resources in User Networks
27
user, and also for the whole network, as cooperation emerges as the preferred strategy.
References 1. Kazaa news. [Online]. 2004. Available at: http://www.kazaa.com/us/news/index.htm. 2. WebCache, eMule-Board. [Online]. 2004. Available at: http://forum.emule-project.net/index.php?showtopic=61326&hl=webcache. 3. E. Adar and B. A. Huberman, Free riding on Gnutella. [Online]. 2002. Available at: http://www.cdt.luth.se/net/courses/01-02/smd076/articles/adar-free-riding.pdf 4. Y. Kulbak and D. Bickson, The eMule Protocol Specification. [Online]. 2005. Available at: http://leibniz.cs.huji.ac.il/tr/acc/2005/HUJI-CSE-LTR-2005-3 emule.pdf 5. Kazaa participation ratio. [Online]. 2006. Available at: http://www.kazaa.com/us/help/glossary/participation ratio.htm. 6. K. Tamilmani, V. Pai and A. Mohr, SWIFT: A System With Incentives For Trading, Proc. Second Work-shop of Economics in Peer-to-Peer Systems, 2003. 7. IEEE 802.11. [Online]. 2005. Available at: http://grouper.ieee.org/groups/802/11/. 8. J. P. Hubaux, T. Gross, J. Y. L. Boudec and M. Vetterli, Towards self-organized mobile ad-hoc networks: the terminodes project, IEEE Commun. Mag., no. 1, pp. 118–124, 2001. 9. Madrid Wireless. [Online]. 2004. Available at: http://madridwireless.net. 10. Wireless Athens Group. [Online]. 2004. Available at: http://www.nmi.uga.edu/research. 11. N. Negroponte, Being Wireless, Wired Magazine, Issue 10.10, Oct. 2002. 12. The official BitTorrent page. [Online]. 2006. Available at: http://www.bittorrent.com 13. B. Gu and S. Jarvenpaa, Are Contributions to P2P Technical Forums Private or Public Goods? - An Empirical Investigation, In 1st Workshop on Economics of Peer-to-Peer Systems, 2003. 14. M. Castro, P. Druschel, A. Ganesh, A. Rowstron and DS Wallach, Security for Structured Peer-to-Peer Overlay Networks, In Proceedings of Multimedia Computing and Networking, 2002. 15. G. Hardin, The Tragedy of the Commons, Science 162, 1968, 1243-1248. 16. M. Feldman, K. Lai, I. Stoica and J. Chuang, Robust Incentive Techniques for Peer-to-Peer Networks, ACM E-Commerce Conference (EC’04), 2004. 17. P. Golle, K. Leyton-Brown and I. Mironov, Incentives for Sharing in Peer-toPeer Networks, In ACM Conference on Electronic Commerce, 2001. 18. Y. Chu, J. Chuang and H. Zhang, A Case for Taxation in Peer-to-Peer Streaming Broadcast, ACM SIGCOMM Workshop on Practice and Theory of Incentives and Game Theory in Networked Systems (PINS), August, 2004. 19. K. Binmore, Game Theory, Mc Graw Hill, 1994. 20. F. Schweitzer, J. Zimmermann and H. Muhlenbein, Coordination of decisions in a spatial agent model, Physica A, 303(1-2), pp. 189-216, 2002. 21. R. Axelrod, The evolution of Cooperation, Basic Books, New York, 1984.
28
E. Costa-Montenegro et al.
22. R. Hoffmann, Twenty years on: The evolution of cooperation revisited, Journal of Artificial Societies and Social Simulation, 3(2), 2000. 23. M. Wooldridge and N. R. Jennings, Intelligent Agents: Theory and Practice, In Knowledge Engineering Review 10(2), 1995. 24. S.J. Russell and P. Norvig, Artificial Intelligence: a Modern Approach, Prentice Hall, 2nd edition, 2003. 25. K. Sycara, Multiagent systems, AI Magazine, 19(2):79-92, 1998. 26. N. Gilbert and J. Doran, editors, Simulating Societies: the computer simulation of social phenomena, UCL Press, London, 1994. 27. S. Moss and P. Davidson, editors, Multi-Agent-Based Simulation, LNAI Volume 1979, Springer, Berlin, 2001. 28. P. Maes, Agents that reduce work and information overload, Communications of theACM, 37(7):31-40, 1994. 29. D. Terzopoulos, Artificial life for computer graphics, Commun. ACM, 42(8):3242, 1999. 30. S.I. Roumeliotis and G.A. Bekey, Distributed multi-robot localization, IEEE Trans. Robotics and Automation, 18(5):781-795, 2002. 31. P. Noriega and C. Sierra, editors, Agent Mediated Electronic Commerce, Lecture Notes in Artificial Intelligence 1571, Springer, 1999. 32. T. Sandholm , Distributed rational decision making, In G. Weiss, editor, Multiagent Systems: A Modern Introduction to Distributed Artificial Intelligence, pages 201-258. MIT Press, 1999. 33. J. Ferber, Multi-Agent Systems: an Introduction to Distributed Artificial Intelligence, Addison-Wesley, 1999. 34. G. Weiss, editor, Multi-Agent Systems, The MIT Press, 1999. 35. M. Wooldridge, An Introduction to MultiAgent Systems, John Wiley & Sons, 2002. 36. Agentes Software y Sistemas Multi-Agente: Conceptos, Arquitecturas y Aplicaciones, Prentice-Hall (in Spanish), 2005. 37. F. Schweitzer, L. Behera and H. Muhlenbein, Evolution of Cooperation in a Spatial Prisioner’s Dilemma, Advances in Complex Systems, vol. 5 (2-3), pp. 269-299. 2003. 38. K.S. Narendra and M.A.L. Thathachar, Learning Automata, Prentice-Hall 1989. 39. J.C. Burguillo-Rial, F.J. Gonzalez-Casta˜ no, E. Costa-Montenegro and J. ValesAlonso, Agent-Driven Resource Optimization in User Networks: a Game Theoretical Approach, Lecture Notes in Computer Science (LNCS) 3305. Proc. 6th Intl. Conf. on Cellular Automata for Research and Industry, ACRI 2004, 335-344 40. A. Schaerf, Y. Shoham and M. Tennenholtz, Adaptive Load Balancing: A Study in Multi-Agent Learning, Journal of Artificial Intelligence Research, 2, 1995, 475500. 41. U.M. Garcia-Palomares, F.J. Gonzalez-Casta˜ no and J.C. Burguillo-Rial, A Combined Global & Local Search (CGLS) Approach to Global Optimization, Journal of Global Optimization (article in Press). 42. F.J. Gonzalez-Casta˜ no, E. Costa-Montenegro, U. Garcia-Palomares, M. Vilas Paz and P.S. Rodriguez-Hernandez, Distributed and Centralized Algorithms for Large-Scale IEEE 802.11b Infrastructure Planning, Proc. Ninth IEEE International Symposium on Computers & Communications (ISCC 2004). 43. F. Box, A heuristic technique for assigning frequencies to mobile radio nets, IEEE Trans. Veh. Technol., vol. VT-27, pp. 57–74, 1978.
Agent-Controlled Sharing of Distributed Resources in User Networks
29
44. W.E. Leland et al, On the Self-Similar Nature of Ethernet Traffic, IEEE/ACM Transactions on Networking, 1994. 45. S. Androutsellis-Theotokis and D. Spinellis, A survey of Peer-to-Peer Content Distribution Technologies, ACM Computing Surveys, 36(4), 2004. 46. Y. Korilis, A. Lazar and A. Orda, Architecting Noncooperative Networks, IEEE Journal on selected areas in communications, 13(7), 1995. 47. A. Orda, R. Rom and N. Shimkin, Competitive Routing in Multiuser Communication Networks, IEEE/ACM Transactions on Networking, 1(5), 1993. 48. P. Bernstein, F. Giunchiglia, A. Kementsietsidis, J. Mylopoulos, L. Serafini and I. Zaihrayeu, Data management for peer-to-peer computing: A vision, In Proceedings of the Workshop on the Web and Databases, WebDB 2002., 2002. 49. M. Castro, P. Druschel, A.M. Kermarree and A. Rowstron, Scribe: A largescale and decentralized application-level multicast infrastructure, IEEE Journal on Selected Areas in Communications, 20(8), October 2002. 50. M. Harren, J. Hellerstein, R. Huebsch, B. Loo, S. Shenker and I. Stoica, Complex queries in dht-based peer-to-peer networks, In Proceedings of the 1st International Workshop on Peer-to-Peer Systems (IPTPS ’02), MIT Faculty Club, Cambridge, MA, USA, March 2002. 51. A.Y. Halevy, Z.G. Ives, P. Mork and I. Tatarinov, Piazza: Data management infrastructure for semantic web applications, In Proceedings of the twelfth international conference on World Wide Web, pages 556-567, Budapest, Hungary, 2003. 52. The Jabber web site. [Online]. 2003. Available at: http://www.jabber.org/. 53. S.M. Larson, C. Snow and V.S. Pande, Modern Methods in Computational Biology, chapter Folding@Home and Genome@Home: Using distributed computing to tackle previously intractable problems in computational biology. Horizon Press, 2003. 54. The genome@home project web site. [Online]. 2003. Available at: http://genomeathome.stanford.edu/. 55. W.T. Sullivan III, D. Werthimer, S. Bowyer, J. Cobb, D. Gedye and D. Anderson, A new major seti project based on project serendip data and 100,000 personal computers, In Proceedings of the 5th International Conference on Bioastronomy, 1997. 56. The Boinc project web site. [Online]. 2006. Available at: http://boinc.berkeley.edu/. 57. The Condor project web site. [Online]. 2006. Available at: http://www.cs.wisc.edu/condor/. 58. R. Huebsch, J.M. Hellerstein, N. Lanham and B. Thau Loo, Querying the internet with pier, In Proceedings of the 29th VLDB Conference, Berlin, Germany, 2003. 59. W. Nejdl, B. Wolf, C. Qu, S. Decker, M. Sintek, A. Naeve, M. Nilsson, M. Palmer and T. Risch. Edutella: A p2p networking infrastructure based on rdf, In Proceedings of the twelfth international conference on World Wide Web, Budapest, Hungary, 2003. 60. R. VanRenesse, K.P. Birman, A. Bozdog, D. Dimitriu, M. Singh and W. Vogels, Heterogeneity-aware peer-to-peer multicast, In Proceedings of the 17th International Symposium on Distributed Computing (DISC 2003), Sorrento, Italy, October 2003.
30
E. Costa-Montenegro et al.
61. I. Stoica, D. Adkins, S. Zhuang, S. Shenker and S. Surana, Internet indirection infrastructure, In Proceedings of the ACM SIGCOMM’02 Conference, Pittsburgh, PA, August 2002. 62. A. Keromytis, V. Misra and D. Rubenstein, SOS: Secure overlay services, In Proceedings of the ACM SIGCOMM’02 Conference, Pittsburgh, PA, August 2002. 63. R. Janakiraman, M. Waldvogel and Q. Zhang, Indra: A peer-to-peer approach to network intrusion detection and prevention, In Proceedgings of 2003 IEEE WET ICE Workshop on Enterprize Security, Linz, Austria, June 2003. 64. V. Vlachos, S. Androutsellis-Theotokis and D. Spinellis, Security applications of peer-to-peer networks, Computer Networks Journal, 45(2):195-205, 2004. 65. The FON network website. [Online]. 2006. Available at: http://www.fon.com/.