AGGREGATION OF SENSORY INPUT FOR ROBUST PERFORMANCE IN CHEMICAL SENSING MICROSYSTEMS Denise M.Wilson Department of Electrical Engineering University of Washington, Seattle, Washington 98195-2500 USA e-mail:
[email protected] phone: 206-221-5238; FAX: 206-543-3842 Thaddeus Roppel Department of Electrical Engineering Auburn University Auburn, Alabama 36849 USA Ronald Kalim Department of Electrical Engineering University of Kentucky, Lexington, Kentucky 40506 USA
ABSTRACT This paper demonstrates the usefulness of aggregating information generated from arrays of chemical sensors for improving the ability to discriminate among target chemicals and their potential interferents. Two types of aggregation methods are evaluated; the first set do not compress the data, but incorporate effects from neighboring sensors into the output of each sensor in an array. The second method does result in compression of data and aggregates multiple sensor outputs into a single, more robust signal. Methods for processing data and aggregating and smoothing outputs from arrays of tin-oxide sensors are comparatively analyzed. Processing parameters studied include those related to simple averaging, linear-weighted averaging, and exponential smoothing across operating temperature and across type of sensing film in the dimensionality of the array. Aggregation techniques are evaluated during various stages of both the transient and steady-state response of the array to quantify the early-decision making capability of the array over that of a single or small number of unprocessed sensors. Aggregation strategies are studied combinatorically, and results are extracted by quantitatively measuring the goodness of clustering for each case. Cluster analysis, including principal component analysis, is used to determine which of these processing techniques are most effective. It is shown that aggregation methods, whether they reduce transmission bandwidth or not, improve the performance of a 30-element, tin-oxide heterogeneous sensor array in discriminating among common breath alcohol components (ethanols), their interferents (acetone, formaldehyde, isopropyl), and a contrast substance (ammonia). Aggregation generates a best-case 42% improvement in separability of clusters and 6.25% improvement in the tightness of clusters. Results are shown that clearly demonstrate the usefulness of aggregation in heterogeneous arrays among sensors whose outputs possess an appreciably degree of correlation (overlapping specificity). Keywords: Electronic Nose, Sensor Preprocessing, Principal Component Analysis, Chemical Discrimination, Feature Extraction Aggregation of Sensory Input for Robust Performance in Chemical Sensing Microsystems
Page 1 of 21
AGGREGATION OF SENSORY INPUT FOR ROBUST PERFORMANCE IN CHEMICAL SENSING MICROSYSTEMS D.M.Wilson Department of Electrical Engineering, University of Washington T.A. Roppel Department of Electrical Engineering, Auburn University Ronald Kalim Department of Electrical Engineering, University of Kentucky
1.0 Introduction In this paper, we explore the possibility of aggregating gas sensors with overlapping specificities to strengthen their pattern recognition capability.
Simple averaging and weighted averaging techniques are evaluated for
improvements in pattern recognition capability over arrays of raw sensory input. Biological olfaction has long been known to aggregate the raw sensory information collected by millions of olfactory receptors into only thousands of aggregate inputs before these signals reach the olfactory bulb. Like the tin-oxide gas sensor arrays we evaluate here, biological olfactory receptors are known to have specificities and sensitivities that overlap with many of their neighboring receptors [1]. Although biological olfactory receptors are more selective than tin-oxide gas sensors, they are in some ways, prone to as much fluctuation as their artificial, tin-oxide counterparts. This fluctuation is caused in large part by the 60 to 90 day turnover of these receptors inside the nose, leading to a wide variety in maturity, drift, and stability of the same type of receptor on any given day [2]. Drift and stability of tinoxide sensors, likewise, are an issue in their use for practical commercial applications. Inspired by biology, then, we deviate from the “electronic noses” that have used artificial neural networks as biological inspired pattern recognition to differentiate gas vapors [3]-[5]. Instead, this paper presents part of our investigation of the usefulness of signal processing architectures, in addition to signal processing algorithms, that are inspired by the biological olfactory system.
Aggregation of Sensory Input for Robust Performance in Chemical Sensing Microsystems
Page 2 of 21
The exact nature of aggregation in compressing the bandwidth of millions of olfactory receptors to thousands of aggregated glomeruli in the olfactory bulb is not well understood. The aggregation or averaging of redundant inputs from like or homogeneous sensors is well known in both biology and in statistical analysis to reduce variance in the aggregate output as compared to the outputs of individual sensors. However, it is less obvious how to use the outputs of similar, but not identical sensors, to produce an aggregate output that provides more robust or useful information than any of the individual component sensors. It is this type of aggregation of heterogeneous input signals that we evaluate in this work for the analysis of an array of 30 discrete, tin-oxide sensors (TGS2000 series sensors). The 30-element array consists of 3 types of sensors at 10 operating temperatures, providing a 30 dimensional, heterogeneous map of chemical information. Temperature has been widely used as a discrimination tool in these types of arrays [6]-[12]. Aggregation techniques that involve some data compression and techniques that do not involve any such compression are evaluated. Sensor outputs at various times into the sensor response are averaged or aggregated using linear and weighted techniques to evaluate their effectiveness in improving the separability of the seven chemicals under evaluation. Principal component analysis and three cluster analysis techniques are used to evaluate separability of clusters, separation between clusters, and closeness of clustering. Cluster separability and separation between clusters in PCA relate directly to the discrimination capability of the pre-processed array of data under analysis, while closeness of clustering relates to the reduction in data uncertainty provided by aggregation during preprocessing. Experimental results are provided here for the 30 element array of tin-oxide sensors targeted at breath alcohol analysis applications. The effectiveness of aggregation is evaluated for the targeted breath alcohol detection and associated interferents. However, this same analysis can be used to evaluate the effectiveness of aggregation for other related applications that involve sensor technologies of overlapping response characteristics and whose components and interferents have related chemical characteristics. Experimental results in Section 5.0 support the statistical arguments presented in Section 2.0 that relate the benefits of aggregation to significant cross correlation among neighboring sensors in the array.
2.0 Sensor Chemistry Background In a metal-oxide gas sensor, the sensitivity of the metal-oxide resistance to concentrations of reducing gases in the sensing environment is known to be related to adsorption and desorption of gas on the redox reactions between the gas and oxygen. The level, type, and rate of adsorption and desorption changes with temperature as does the type of oxygen ion with which the gas reacts. At moderate concentrations, above the sensors’s noise floor and below the saturation level of the sensor, conductance is related to gas concentration as follows:
Aggregation of Sensory Input for Robust Performance in Chemical Sensing Microsystems
Page 3 of 21
G s = AC
α
(1)
where G s is the conductance of the metal-oxide sensor, C is the concentration of the gas, A is the response coefficient for a particular gas and type of sensor and α is a constant close to 0.5 [13]. The constants A and α change with the type of sensor material, the type of reducing gas and the temperature of the sensor. This relationship is limited on the lower end by noise in the sensor heaters and variations in surface chemistry; at the upper end, this relationship changes due to temperature increases on the surface of the sensor induced by exothermic reactions between the gas and the sensor surface. Between these high and low limits, the above relationship fits well to gas concentrations introduced in controlled environments. Effects of diffusion, turbulent air flow, and similar factors are not included in Equation 1. For an array of homogeneous sensors, where operating temperature, ambient conditions, and sensor materials are the same, the relationship described in Equation 1 remains the same for all sensors in the array. Identical responses, however, are not observed in such a homogeneous array because of random variations in sensor conductance due to fabrication variations in the sensor material and concentration variations in the quantity of gas delivered to each sensor over time. In practical environments, where gas sampling is not tightly controlled, these variations in gas delivery are significant and cannot be neglected. In the example of the homogeneous array, these variations can be expressed as a random variation in the constants A and C respectively: G s = ( A + ∆A ) ( C + ∆C )
α
(2)
These random variations in the variables A and C above, propagate to the sensor conductance as follows: α–1 α 2 2 ∂G 2 ∂G 2 2 ) + σA ( C ) σ G = σ C + σ A = σ C ( αAC ∂ C ∂ A
(3)
where σA and σC are the variances associated with the constants A and C respectively. In a homogeneous array of sensors, this uncertainty can be reduced by averaging the outputs of the array into a single aggregate output. The uncertainty or variance associated with this new aggregate output is simply: σG σ Aggregate Output = ------N
(4)
where N is the number of sensors in the homogeneous array. Thus, the improvement in robustness of the aggregate signal provided by a homogeneous array increases as the square root of the array size N. For a heterogeneous array, the benefits of aggregation are not as easy to predict. Whether aggregation provides an advantage over the raw sensory input depends significantly on the method of aggregation and the correlation among the variables involved in aggregation. Consider, for example, a heterogeneous array of two sensors, U and Aggregation of Sensory Input for Robust Performance in Chemical Sensing Microsystems
Page 4 of 21
V, with corresponding uncertainties, 〈 σ G〉 U and 〈 σ G〉 V . These sensors have some correlation between them, σUV, that reflects the degree to which their response characteristics overlap. The resulting variance in the aggregate output, X, that combines these two sensor outputs in some way can be generically represented as: 2
2
〈 σ X 〉 = 〈 σ G〉 U 〈
2 ∂X 2 ∂X 2 ∂X 2 ∂X 〉 + 〈 σ G〉 V 〈 〉 + 2σ U V 〈 〉 〈 〉 ∂U ∂V ∂U ∂V
(5)
where the uncertainty in the aggregate output is σ x . For example, consider the simple case where aggregation involves the averaging of the two sensor conductances U and V: + VX = U ------------2
(6)
the variance in the aggregate variable X is a function of the variance in the two component variables U and V: 2 1 2 1 2 1 2 〈 σ X〉 = 〈 σ G〉 U 〈 ---〉 + 〈 σ G〉 V 〈 --- 〉 + 2σ U V 〈 ---〉 4 4 4
(7)
the success of aggregation depends solely on the third term in the above expressions that reflects correlation between the variables or signals to be aggregated. If the variables are completely correlated, it is possible for each erroneous measurement of U to counteract a corresponding erroneous measurement in V, causing the variance of the combined observation to disappear. In practice, it is difficult to quantify correlations among a large number of variables, operating parameters, and sensor types in an array. In this paper, however, we evaluate the effectiveness of aggregation, not knowing all these cross-correlations quantitatively but qualitatively expecting that aggregation will provide benefit for closely correlated variables and that used incorrectly, aggregation will detrimentally affect the performance of the array. The analysis presented here uses anywhere from three to ten sensors in each aggregation step for an array of 30 tin-oxide sensor signals. In this research, we use metal-oxide sensors that are different in dopants and in temperature to construct a 30 element heterogeneous array of sensors. We use three types of discrete, commercially available tin-oxide sensors (Figaro TGS2600, TGS2610, and TGS2620). We use 10 each of these sensors operating at temperatures evenly spaced from 250oC to 475oC. From the quantitative and qualitative information we have available about the response of this array to different gases, we hypothesize that several specific parameters of the sensor response are important to discriminating different gases while remaining resilient to noise introduced by randomness of surface effects and variations in ambient conditions (these parameters are introduced and described in Section 3.0). We test the effect of these parameters (time into sensor response, and aggregation method) using principal component and cluster analysis to determine which parameter values lead to the best discrimination among gases of interest in a particular application.
Aggregation of Sensory Input for Robust Performance in Chemical Sensing Microsystems
Page 5 of 21
In subsequent sections, we analyze the effectiveness of aggregating outputs of heterogeneous (unlike) sensors into a single signal that is more capable of discriminating among breath alcohol mixtures (vodka, wine, beer) and associated interferents (acetone, isopropyl, formaldehyde) than individual sensors taken alone. We also include ammonia for verification purposes, since ammonia is very distinct from the other gases studied. From this parameter analysis, we derive the optimal aggregation methods across sensor type and temperature to be extracted from the array of tin-oxide sensors for effective discrimination between ethanol mixtures and interferent gases. Although the analysis methods presented next have been demonstrated on an array of tin-oxide sensors for seven specific gases, the basic methodology can be extended to arrays of other types of sensors to design array architectures optimally suited to particular applications.
3.0 Aggregation Analysis Aggregation of the data has been investigated using both principal components analysis (PCA) and a cluster analysis that evaluates quantitatively the following characteristics of each data set: •
Centroid Proximity Metric (CPM): evaluates uniformity of cluster distribution (detects “intruders”)
•
Intra-Cluster Distance (INTRA): evaluates cluster density (expresses “variability” for a particular chemical)
•
Inter-Cluster Distance (INTER): evaluates separation of clusters (quantifies “distance from intruders”)
Based on the statistical arguments presented in Section 2.0, we expect that aggregation will have a beneficial impact on intra-cluster distance, as the uncertainty associated with a particular chemical will decrease for aggregation methods where correlation is present among aggregated variables. Improvements in intra-cluster distance often lead to improvements in inter-cluster distance when the cluster centroids remain in similar locations in principal component space. The impact of aggregation on the Centroid Proximity Metric, however, is not straightforward, and may actually impact the CPM detrimentally as compared to CPM values associated with raw data. Details of the aggregation methods evaluated here are described in detail in Section 3.1 followed by more detailed discussion of PCA and cluster analysis techniques in Sections 3.2 and 3.3 respectively.
3.1 Preprocessing Parameters Investigated In designing a gas sensing array, the size and structure of the array are to be constructed to suit the targeted application. In the prototype design presented here, the targeted application is to discriminate among four common reducing gases: ethanol (beer, wine, vodka), acetone, formaldehyde, and isopropyl alcohol; and a contrast substance, ammonia. Cluster analysis is used to analyze clustering of sensor responses in a 30 element array of tinoxide sensors constructed from three types of sensors: •
TGS2600 (air contaminant detector): optimally sensitive to hydrogen and carbon monoxide ( output Sna where n = 1-10).
•
TGS2610 (combustible gas detector): optimally sensitive to propane, methane, and butane ( output Snb where n = 1-10).
Aggregation of Sensory Input for Robust Performance in Chemical Sensing Microsystems
Page 6 of 21
•
TGS2620 (solvent vapor detector): optimally sensitive to ethanol (output Snc where n = 1-10).
operating across a range of temperatures from 250oC to 475oC in 25oC increments. Various preprocessing parameters are evaluated in combinations using cluster analysis. Table 1 lists and describes the preprocessing parameters and their associated values. The parameters studied include compressive aggregation, non-compressive aggregation, and sensor response time. The main focus of this analysis is to evaluate the impact of aggregating sensor outputs in performing chemical discrimination. These aggregation techniques are divided into compressive and non-compressive methods. Simply, compressive methods produce less than 30 outputs from the 30 element array and non-compressive methods maintain 30 processed outputs from this same array. We evaluate the impact of both local and global averaging across the array and expect that localized averaging will provided better clustering results, because large differences in operating temperature tend to represent changes in fundamental reactions (type of oxygen, impact of humidity, etc....) and lead to less correlation among sensor outputs. Compressive methods consist primarily of linear averaging techniques where multiple sensor outputs are averaged into a single (compressed) aggregate output. The Type, Local Linear aggregation involves averaging each of three types of sensors at a single operating temperature, replacing a group of three sensors with the following value: S na + S nb + S nc S m = ----------------------------------3
(8)
for a total of ten aggregate outputs, S1 - S10. The Temperature, Local Linear aggregation technique is similar, but replaces a group of same-type sensors operating at the three adjacent operating temperatures with their average: Sn – 1 + Sn + Sn + 1 S m = ---------------------------------------3
(9)
The tenth (coolest) temperature is removed from this aggregation process for a total of nine aggregate outputs, S1 S9. The last of the compressive aggregation techniques (Temperature, Global Linear) averages sensors globally, rather than locally for a total of three aggregate outputs S1 - S3, each representative of one type of sensor across its entire range of operating temperatures: 10
Sm
1 = -----10
∑ Sn
(10)
n=1
The non-compressive aggregation techniques combine sensor information in a manner similar to the compressive aggregation techniques, but do so in a sliding window, so that the number of aggregate outputs is identical to the Aggregation of Sensory Input for Robust Performance in Chemical Sensing Microsystems
Page 7 of 21
number of sensor outputs in all cases. The first technique, Temperature Linear, is identical to the Temperature Local Linear, compressive aggregation method, except that each sensor value (as opposed to every three sensor values) is replaced with the average of itself and its two neighbors. The second technique, Temperature Weighted, is similar to the first with the exception that the two neighbors to every sensor contributes only 25% to the total weighted average of the three sensors. Finally, Temperature Exponential method aggregates all sensors of the same type as a weighted average of the sensor at each location and its neighbors, where the weight of the neighbor decreases exponentially with distance from the sensor.The main thrust of this analysis is to evaluate the effectiveness and clustering capability of aggregating heterogeneous sensor inputs as compared to clustering raw sensor data. The outcome of this analysis quantifies the usefulness of aggregated data over raw data and which types of aggregation are suitable to the 30-element array described here and the breath alcohol analysis problem. Cluster analysis is performed on ten samples of each of the seven vapors tested and clustering metrics are calculated to compare the usefulness of aggregation for different aggregation methods at different times in the sensor response.
3.2 Principal Component Analysis Principal component analysis (PCA) is a linear supervised learning, pattern recognition technique that can be used to analyze raw data or features of that data. Principal component analysis clusters features in n-dimensional space according to their similarity to other features or raw data. In this work, we focus on the first two principal components in each analysis; however, investigation of third and fourth principal components in these same analyses has led to the same conclusions based on the experimental data used here. Goodness of clustering on PCA plots can be measured quantitatively by using several established techniques (e.g., Mahalanobis distance). However, in this work we use three similar metrics to established techniques, but are modified to more easily facilitate comparison of aggregation methods among themselves and with raw sensor data. Based on these observations, we conclude that, regardless of the specific features considered, PCA could not be used to automatically determine the combinations of features that would lead to optimal aggregation and subsequent processing. However, PCA does provide us with an evaluative tool for determining the usefulness of extracting selected features. PCA also provides a fast, linear computational alternative to non-linear recognition techniques, such as artificial neural networks, and can be used as a predictor for the relative success of these other pattern recognition engines on data that has been pre-processed and feature-extracted using a variety of methods.
3.3 Full-Dimensional Cluster Analysis Visual analysis of PCA results provides qualitative insight into the effectiveness of various aggregation methods. To quantitatively analyze and compare these results among aggregation methods and with raw sensor data, we use Aggregation of Sensory Input for Robust Performance in Chemical Sensing Microsystems
Page 8 of 21
three simple cluster evaluation metrics that are specifically suited to the evaluation of aggregation techniques. These metrics are as follows: •
Centroid Proximity Metric (CPM) computed according to the following algorithm: • Each of the 56 odor data samples is represented as a point in n-dimensional space, where n is the number of features extracted from the sensor data. The coordinates of this point are the corresponding response values from each sensor. • For each of the seven odors studied, the centroid of the eight samples of that odor is computed. • For each centroid, the ten closest samples are identified using the Euclidean distance measure. • The number of these ten closest samples that are “correct” (correspond to the same odor as the centroid) is counted and normalized to a maximum value of “1”. • CPM evaluates how uniformly the data corresponding to a particular chemical are distributed around the centroid. The closer the CPM lies to one, the more random the uncertainty in the data and the more easily the uncertainty can be reduced through aggregation and redundancy in the array.
•
Intra-Cluster Distance (INTRA) computed according to the following algorithm: • The distance from each element of a chemical cluster to every other element belonging to that cluster is computed. • These intra-cluster distances are averaged and normalized for each cluster to a value between 0 and 1. • INTRA is directly related to the uncertainty or variance in the data and is the most direct measure of the effectiveness of aggregation methods in decreasing the uncertainty in data through appropriate cross-correlation among aggregated variables.
•
Inter-Cluster Distance (INTER) computed according to the following algorithm: • The centroid for each cluster is computed. • The shortest distance between each centroid and the centroid of another cluster is computed (nearest neighbor). • These inter-cluster centroid distances are normalized for each cluster to a value between 0 and 1. • INTER is directly related to the separability of the data and influences the ability of pattern recognition techniques to discriminate among data effectively.
We have calculated these three cluster metrics for every cluster in every aggregation method at every time step described in Section 3.1. Cluster metrics for closely related chemicals (breath alcohol constituents, breath alcohol interferents, and the contrast substance) have also been averaged and evaluated as a group of chemicals as well as single chemical components of interest.
4.0 Experimental Set-Up Eight sets of data are collected for each of the seven odorants tested: beer, wine, vodka (which are all forms of ethanol), acetone, isopropyl, formaldehyde, and ammonia. Acetone and formaldehyde are products of digestion for some people and can interfere with breath alcohol detection, while isopropyl is a common external interferent (perfumes, colognes, deodorants, facial cleaners) for this same application. Ammonia is included for verification purposes, since ammonia is very distinct from the other gases studied. Data are collected from a set of 30 sensors over a 2 month time period. The array of 30 sensors consists of: •
TGS2600 (air contaminant detector): 10 sensors operating between 250o and 475o C in 25o increments.
Aggregation of Sensory Input for Robust Performance in Chemical Sensing Microsystems
Page 9 of 21
•
TGS2610 (combustible gas detector): same temperatures as TGS2600.
•
TGS2620 (solvent vapor detector): same temperatures as TGS2600.
Each sensor contains a metal oxide semiconductor layer and an on-board heater to set the temperature of the tinoxide during operation. The array is constructed so that each sensor has its own on-board heater power supply capable of maintaining a wide range of operating temperatures. A National Semiconductor adjustable voltage regulator (LM317) is used to regulate the voltage delivered to each sensor heater. Two fixed and one variable resistor are used to set the desired output voltage from regulator to sensor heater. The heating module for each sensor is shown in Figure 1a. A single power supply of 9V, DC is used to power both sensors and heaters. The 9V supply is transferred to three voltage regulators (LM317) that independently supply sensor power to each row (type) of sensors. A schematic of the sensor configuration is shown in Figure 1b. Independent control of each of sensor heaters and the sensor supply in each row of sensors ensures signal separation and helps in minimizing noise. All three main sensor supply voltages are monitored using PC based data acquisition during testing to evaluate any potential impact of electrical noise or power supply fluctuations. The board configuration for the sensor array is shown in Figure 2. The three regulated power supplies, 30 heater voltages, and 30 sensor outputs are monitored using automated (Labview-based) data acquisition cards and associated PC. The sensors are mounted in a removable holder upside down into a 174 liter testing chamber. A headspace of the vapor to be tested is allowed to collect in a glass container of 1 pint volume 1/4 filled with the corresponding liquid to be tested. When the headspace has stabilized, an electronic valve is opened, allowing the headspace to diffuse into the testing chamber and to the sensors, mounted close to the top of the chamber. Each experiment runs for 30 minutes, with a sample taken via automated data acquisition every 150 ms. After each experiment, the electronic valve is closed and the chamber purged with compressed air for 30-45 minutes. A diagram of the experimental set-up is shown in Figure 3.
5.0 Results and Discussion Principal component and cluster analysis, as described in Section 3.0, have been performed on data extracted from the tin-oxide sensor array described in the previous section for a variety of aggregation methods and times into sensor response. We have found that aggregation improves both the INTER (increases) metric and the INTRA (decreases) metric. Results for the CPM metric, however, do not demonstrate the improvements provided by aggregation, a fact that is more a function of the circular nature of clusters used in calculating CPM than in the nature of pre-processing under analysis. In section 5.1, we present representative PCA results that clearly demonstrate the usefulness of aggregation in heterogeneous arrays and in section 5.2, we present complete and detailed results for each of the three clustering metrics that more rigorously quantify and summarize the results of PCA. Aggregation of Sensory Input for Robust Performance in Chemical Sensing Microsystems
Page 10 of 21
5.1 Principal Component Analysis: Qualitative Results Figure 4 and Figure 5 demonstrate what we expect to see as a result of aggregation used as a pre-processing technique. Figure 4 compares principal components 1 and 2 for raw data, compressive aggregation (Temperature, Local Linear), and non-compressive aggregation (Temperature, Exponential) at 1100 seconds into the sensor response. Improved separation of clusters, via aggregation, is seen clearly in Figure 4. The Temperature, Local Linear and Temperature, Exponential techniques both aggregate local variables, where we would expect a larger correlation among aggregated variables. Aggregation, however, is not always beneficial, as is clearly demonstrated in Figure 5, where uncorrelated variables are aggregated across a wide temperature range in the Temperature, Global aggregation technique. For global aggregation, we see increase in cluster overlap and overall increase in confusion in the relationships between the first two principal components. Global aggregation produces clustering that is inferior to other, more local aggregation techniques and to raw data, because the lack of correlation among most variables in the aggregation serves to damage the discrimination capability of the array rather than to improve it.
5.2 Cluster Analysis: Quantitative Results Clustering analysis, for two of the three metrics chosen, supports the use of aggregation. In this section, we discuss the results of cluster analysis and conclude the usefulness of aggregation among correlated variables. The centroid proximity metric (CPM), while it supports the improvement of clustering as time into the sensor response increases, generates superior results for raw data as compared to aggregation techniques in all cases. For example, at 1100 seconds into the sensor response, the CPM metric is 0.77 for raw data and 0.70 for the best of the aggregation methods (Temperature, Weighted), in terms of this particular metric. At first glance, we would conclude that the use of raw data, then, must provide better clustering capability than for pre-processed, aggregated data. However, we can see visually, in Figures 4 and 5, that aggregation has provided better discrimination capability in all but the Temperature, Global Linear methods. It is the metric rather than the pre-processor that is deficient in this type of cluster analysis. CPM assumes a circular cluster, which in this particular analysis, leads to erroneous conclusions because most of the clusters are not circular but elliptical in shape, with the majority of the spread in each cluster occurring in the direction of principal component 1. The remaining two clustering metrics, INTER and INTRA, which measure the separability and closeness of each cluster respectively, regardless of overall cluster shape, provide more relevant information about the discrimination capability of the raw vs. aggregated sensor data. Statistical analysis of aggregation as a pre-processing method suggests that data should become more closely clustered through aggregation as long as the aggregated variables are in some appreciable way, correlated. As the Aggregation of Sensory Input for Robust Performance in Chemical Sensing Microsystems
Page 11 of 21
uncertainty in each variable decreases through aggregation, the INTRA clustering metric should also decrease, because it is directly related to the spread or uncertainty in each set of data. The decrease in the INTRA metric dominates the results for correlated aggregation methods in Table 2. As data become less correlated (Type, Local Linear aggregation) and significantly uncorrelated (Temperature, Global Linear aggregation), aggregation begins to detrimentally impact the uncertainty in variables within each data set. As expected, the INTER cluster metric, which is directly related to the separability of clusters and the discrimination capability of PCA, also improves with aggregation methods. The INTER metric is tabulated for all aggregation methods at 1100 seconds into the sensor response in Table 3. For the same reasons as described previously, Temperature, Global Linear aggregation provides poor clustering results, when measured in terms of INTER, as compared to all other techniques, including PCA of raw data. However, on the average, the INTER metric of all other aggregation methods increases over that of raw data, thereby improving the discrimination capability of PCA. The best improvement is provided by Temperature Exponential aggregation (42% for INTER and 6.25% for INTRA), which is not a surprising result if we return to biology for an explanation. Many biological sensing systems, including vision and possibly olfaction, perform exponentially weighted averaging at the frontend of their sensory processing. The superior performance of exponential aggregation in this analysis further supports the use of biological inspiration in overcoming accuracy issues associated with metal-oxide sensor arrays. The impact of time into sensor response on the clustering capability of PCA is clearly shown in Table 4. Without exception, the clustering metrics INTRA and INTER improve as time into the sensor response increases. Both metrics improve 40% from 50 seconds to 1100 seconds into the response for the demonstrated Temperature, Weighted Aggregation technique. Similar improvements are seen for all aggregation methods as the sensor response progresses from its transient phase to its steady-state phase. Clustering improves as the randomness in the transient response gives way to the stability of the steady-state response. The monotonic changes in these two metrics clearly demonstrate that better discrimination is available the longer we wait to make a decision.
6.0 Conclusions In this study, an array of 30 sensor tin-oxide sensors has been exposed to odors related to breath alcohol detection. It is shown that aggregation of correlated variables in the sensor array provides improved odor identification capability. Improvements as high as 42% in the separation of clusters and 6.25% in the tightness of clusters are demonstrated in our detailed principal component and cluster analysis of chemicals related to the breath alcohol problem. Best results are provided by the most biologically inspired of the aggregation techniques (exponential averaging). The beneficial effects of aggregation can be translated to other arrays of metal-oxide sensors and to other discrimination problems suited to the metal-oxide sensor technologies.
Aggregation of Sensory Input for Robust Performance in Chemical Sensing Microsystems
Page 12 of 21
The intent of this study is to lay the groundwork for designing on-chip hardware circuits to perform preprocessing via the successful aggregation techniques described in this paper. Integrated sensors and circuits are becoming more viable in the advancement of micro fabrication techniques. Appropriate pre-processing hardware has the potential to provide improvements in performance to an array of chemical microsensors that can simply not be achieved through improvements in individual metal-oxide sensor technology.
7.0 Acknowledgements The authors would like to thank the National Science Foundation for the CAREER grant that has funded this research.
8.0 References [1] Gordon M. Shepherd, “Computational Structure of the Olfactory System,” from Olfaction: a Model System for Computational Neuroscience, Joel L. Davis and Howard Eichenbaum, MIT Press: Cambridge, Massachusetts, 1992, pp. 333. [2] Jane Dodd and Vincent F. Castellucci, “Smell and Taste: The Chemical Senses,” from Principles of Neural Science, E.R. Kandel, J.H. Schwarz, and T.M. Jessel, eds, New York: Elsevier, pp. 512-529, 1991. [3] G. Huyberechts, P. Szecowka, J. Roggen, and B.W. Licznerski, “Simultaneous quantification of carbon monoxide and methane in humid air using a sensor array and an artificial neural network,” Sensors and Actuators B, vol. 45, 1997, pp. 123-130. [4] Eduard Llobet, Jesus Brezmes, Xavier Vilanova, Jesus E. Sueiras, and Xavier Correig, “Qualitative and quantitative analysis of volatile organic compounds using transient and steady-state responses of a thick-film tin oxide gas sensor array, Sensors and Actuators B, vol. 41, 1997, pp. 13-21. [5] G. Faglia, F. Bicelli, G. Sberveglieri, P. Maffezzoni, and P. Gubian, “Identification and quantification of methane and ethyl alcohol in an environment at variable humidity by an hybrid array,” Sensors and Actuators B, vol. 44, 1997, pp. 517-520. [6] Eduard Llobet, Jesus Brezmes, Xavier Vilanova, Jesus E. Sueiras, and Xavier Correig, “Qualitative and quantitative analysis of volatile organic compounds using transient and steady-state responses of a thick film tin oxide gas sensor array,” Sensors and Actuators B, vol. 41, 1997, pp. 13-21. [7] G. Faglia, F. Bicelli, G. Sberveglieri, P. Maffezzoni, and P. Gubian, “Identification and quantification of methane and ethyl alcohol in an environment at variable humidity by an hybrid array,” Sensors and Actuators B, vol. 44, 1994, pp. 517-520. [8] C. Di Natale, A. Macagnano, F. Davide, A.D’Amico, A. Legin, Y. Vlasov, A. Rudnitskaya, and B. Selezenev, “Multicomponent analysis on polluted waters by means of an electronic tongue,” Sensors and Actuators B, vol. 44, 1997, pp. 423-428. [9] Evor L. Hines and Julian W. Gardner, “An artificial neural emulator for an odour sensor array,” Sensors and Actuators B, vol. 18-19, pp. 661-664, 1994. [10] David C. Dyer, and Julian W. Gardner, “High-precision intelligent interface for a hybrid electronic nose,” Sensors and Actuators A, vol. 62, 1997, pp. 724-728. [11] T. Seiyama and N. Yamazoe, “Recent Advances in Gas Sensors in Japan,” ACS Symposium: Fundamental and Applications of Chemical Sensors, pp. 39-50, 1986. [12] Kousuke Ihokura and Joseph Watson, The Stannic Oxide Gas Sensor, CRC Press: Boca Raton, Florida, Chapters 2,3,4. [13] David E. Williams and Keith F.E. Pratt, “Resolving combustible gas mixtures using gas sensitive resistors with arrays of electrodes,” J. Chem. Soc., Faraday Trans., 1996, vol. 92, no. 22, pp. 4497-4504. Aggregation of Sensory Input for Robust Performance in Chemical Sensing Microsystems
Page 13 of 21
9.0 Biographies Denise Wilson is an assistant professor at the University of Washington in the U.S. She received her Ph.D. and M.S. in Electrical Engineering from the Georgia Institute of Technology in 1995 and 1989 respectively. She has a B.S. in Mechanical Engineering from Stanford University and has worked for several years for Applied Materials, a semiconductor capital equipment supplier from 1990-1992. Her research interests focus on the development of signal processing architectures, array platforms and other infrastructure for visual, auditory and chemical sensing microsystems. Thaddeus Roppel is an associate professor of Electrical and Computer Engineering at Auburn University in the U.S. He received the Ph.D in Electrical Engineering from Michigan State University in 1986. His research interests include information extraction from large-scale sensor arrays, applications of neural networks, and microsensor fabrication.
Aggregation of Sensory Input for Robust Performance in Chemical Sensing Microsystems
Page 14 of 21
10.0Tables Table 1: Parameter Values Studied Parameter
Parameter Values
Description
Data Scaling
Voltage
Sensor voltage output (raw data)
Temperature Range
Wide
250oC to 475oC in 25oC increments
Response Time
50, 100, 200, 500, 800, 1100 sec. Time after initial sensor response
Compressive Aggregation
• •
Type, Local Linear Temperature, Local Linear
•
Temperature, Global Linear
• • •
Temperature, Linear Temperature, Weighted Temperature, Exponential
Non-Compressive Aggregation
Each group of sensors is replaced with a single average value: • Three types of sensors at every temperature (simple average) • Three groups of three sensors at three adjacent temperatures (simple average) for every type of sensor • One group of ten sensors at all 10 operating temperatures (simple average) for every type of sensor Each sensor is replaced with: • Simple average of itself and two neighbors • Weighted average of itself and two neighbors • Exponential average of itself and all neighbors
Table 2: Results of Cluster Analysis (INTRA) for Single Component Chemicals at 1100 sec. Parameter
Ace
Amm
Beer
Form
Iso
Vodka
Wine
Avg
.051
.164
.033
.048
.125
.096
.044
.080
Type, Local Linear
.054
.159
.040
.049
.121
.103
.052
.082
Temperature, Local Linear
.034
.158
.033
.048
.117
.080
.045
.074
Temperature, Global Linear
.102
.168
.029
.076
.179
.080
.036
.096
Temperature, Linear
.041
.170
.031
.050
.105
.078
.046
.074
Temperature, Weighted
.037
.164
.032
.049
.110
.078
.047
.074
Temperature Exponential
.042
.156
.032
.049
.110
.084
.048
.075
RAW SENSOR DATA (Compressive) at 1100 sec AGGREGATION METHODS
(Non-Compressive) at 1100 sec AGGREGATION METHODS
Aggregation of Sensory Input for Robust Performance in Chemical Sensing Microsystems
Page 15 of 21
Table 3: Results of Cluster Analysis (INTER) for Single Component Chemicals at 1100 sec Parameter
Ace
Amm
Beer
Form
Iso
Vodka
Wine
Avg
.467
.203
.075
.142
.142
.203
.075
.186
Type, Local Linear
.445
.303
.072
.191
.191
.303
.072
.225
Temperature, Local Linear
.380
.537
.073
.186
.234
.313
.073
.257
Temperature, Global Linear
.428
.053
.103
.096
.134
.053
.096
.138
Temperature, Linear
.376
.570
.073
.206
.240
.297
.073
.262
Temperature, Weighted
.375
.565
.073
.204
.239
.301
.073
.262
Temperature Exponential
.392
.550
.072
.215
.229
.323
.072
.265
RAW SENSOR DATA (Compressive) at 1100 sec AGGREGATION METHODS
(Non-Compressive) at 1100 sec AGGREGATION METHODS
Table 4: Results of Cluster Analysis for Temperature, Weighted Aggregation at Various Times into Sensor Response Parameter
Avg INTRA
Avg INTER
50 Seconds
.123
.186
100 Seconds
.107
.198
200 Seconds
.099
.207
500 Seconds
.079
.236
8000 Seconds
.076
.257
1100 Seconds
.074
.262
Aggregation of Sensory Input for Robust Performance in Chemical Sensing Microsystems
Page 16 of 21
11.0 Figures
LM317 LM317
Vccx
Vccx
Vheater Sensor
Vdd
Vheater
Vout
Vout Rload
(a) Sensor Heater Control Circuit
Rload (b) TGS26xx Sensor Configuration
Figure 1. Sensor Measurement Configurations Each TGS26xx has (a) a dedicated heater control circuit for regulating operating temperature, the sensor space is broken up into three groups of ten where each group (b) has its own regulated sensor supply voltage (Vcca, Vccb, and Vccc in Figure 2). All supply voltages (sensor and heater) are collected and monitored with each sensor output measurement.
Aggregation of Sensory Input for Robust Performance in Chemical Sensing Microsystems
Page 17 of 21
9V (Single Power Supply, Vdd)
LM317 Voltage Regulator and supporting circuitry (Figure 1a)
Vcca
S0 a
S1 a
S2a
S3a
S4a
S5a
S6a
S7a
S8a
S9a
S5b
S6b
S7b
S8b
S9b
S5c
S6c
S7c
S8c
S9c
TGS2600 Sensors Vccb
S0 b
S1 b
S2b
S3b
S4b
TGS2610 Sensors Vccc
S0 c
S1 c
S2c
S3c
S4c
TGS2620 Sensors Figure 2. TGS26xx Sensor Array Ten element arrays of three types of sensors make up the array where each row of sensors contains sensors operating at ten different operating temperatures (hot on left, cool on right). One main power supply (Vdd) is used to supply both sensor and heater voltages; one regulated supply is provided for each row’s sensor voltage (Vcca, Vccb, and Vccc) and one regulated supply is provided for each of the 30 sensor heaters.
Aggregation of Sensory Input for Robust Performance in Chemical Sensing Microsystems
Page 18 of 21
9V
TGS26xx Sensor Array Testing Chamber (174 liters)
PC-Based
Figure 3. Experimental Set-up Gas vapor is introduced by opening an electronic valve into the testing chamber. Vapor from the stable headspace in the collection jar (containing the liquid of interest) diffuses into the chamber throughout the 30 minute experimentation period.
Data Acquisition
Aggregation of Sensory Input for Robust Performance in Chemical Sensing Microsystems
Page 19 of 21
Chemical
Acetone
Ammonia
Beer
Formaldehyde
Symbol
o
x
+
*
Isopropyl
Vodka
Wine
AGG=None T=1100 S=.186 T=.080 0.8
0.6
Principal Component 2
0.4
0.2
0
−0.2
−0.4
−0.6
5
6
7
8
9 10 Principal Component 1
11
12
13
AGG=Temp/Local Linear T=1100 S=.257 T=.074 0.3
0.2
Principal Component 2
0.1
0
−0.1
−0.2
−0.3
−0.4
3
3.5
4
4.5 5 5.5 Principal Component 1
6
6.5
7
AGG=Temp/Exponential T=1100 S=.265 T=.075 0.6
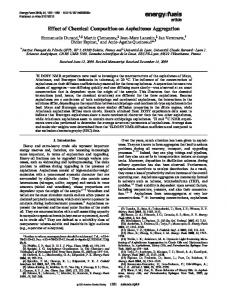
0.4
Figure 4. Principal Component Analysis Results for Raw Sensor Data, Compressive and Non-Compressive Aggregation Shown are principal components 1 and 2, 1100 seconds into the sensor response, for (a) raw sensor data, (b) compressive Temperature, Local Linear aggregation and (c) non-compressive Temperature, Exponential aggregation. Since aggregation in both (b) and (c) is done in small local neighborhoods, the benefit to subsequent clustering of the seven chemicals presented is clear. Isopropyl and Formaldehyde clusters are circled to demonstrate this point, but similar clustering improvement can be seen in other clusters as well. Clusters diminish in size and separate more from neighboring clusters when aggregation is used as a pre-processor to PCA.
Principal Component 2
0.2
0
−0.2
−0.4
−0.6
−0.8
5
6
7
8 9 Principal Component 1
10
Aggregation of Sensory Input for Robust Performance in Chemical Sensing Microsystems
11
12
Page 20 of 21
Chemical
Acetone
Ammonia
Beer
Formaldehyde
Symbol
o
x
+
*
Isopropyl
AGG=Temp/Weighted T=1100 S=.262 T=.074
Vodka
Wine
AGG=Temp/Global Linear T=1100 S=.138 T=.096
0.6
0.12
0.1 0.4 0.08 0.2 Principal Component 2
Principal Component 2
0.06 0
−0.2
0.04
0.02
0 −0.4 −0.02 −0.6 −0.04
−0.8
5
6
7
8
9 10 Principal Component 1
11
12
−0.06 13 1.8
2
2.2
2.4
2.6 2.8 3 Principal Component 1
3.2
3.4
3.6
3.8
Figure 5. Principal Component Analysis Results for Aggregation among Correlated and Uncorrelated Variables Shown above are principal components 1 and 2, 1100 seconds into the sensor response, for (a) temperature, weighted and (b) temperature, global methods. In temperature, global methods, where sensor data are averaged across the full temperature range, clustering is in general poor; uncertainty in the variables has been enhanced rather than diminished because poor correlation among the variables does not offset the increase in uncertainty in the variables evaluated individually.
Aggregation of Sensory Input for Robust Performance in Chemical Sensing Microsystems
Page 21 of 21