Published online June 2, 2005
Reproduced from Soil Science Society of America Journal. Published by Soil Science Society of America. All copyrights reserved.
The Relationship between Carbon Input, Aggregation, and Soil Organic Carbon Stabilization in Sustainable Cropping Systems Angela Y. Y. Kong,* Johan Six, Dennis C. Bryant, R. Ford Denison, and Chris van Kessel ABSTRACT
the underlying processes, capacity, and longevity of C pools in agricultural lands. Studies have shown that increases in SOC levels are directly linked to the return of fresh organic material to soil (Rasmussen et al., 1980; Cole et al., 1993). Agronomic practices that influence yield and, therefore, affect the proportion of crop residues returned to the soil, are likely to influence C levels in agricultural soils. Therefore, the inclusion of legumes and cover crops (Kuo et al., 1997), the addition of manure and fertilizer (Hartwig and Ammon, 2002), and the reduction in fallow frequency (Rasmussen et al., 1980) linearly increase SOC levels. Nevertheless, Campbell et al. (1991) found no effect of varying C inputs on SOC levels for a high organic matter soil at Melfort, Saskatchewan (Canada), thereby suggesting that these soils may be C saturated (Six et al., 2002). Carbon saturation implies that once the capacity for a soil to stabilize C is reached, additional C inputs will not be stabilized as SOC (Paustian et al., 1997b; Six et al., 2002). Therefore, determining the C status of a soil relative to C saturation is important to gauging the potential for C sequestration. Several studies have illuminated that, besides C input, soil aggregate dynamics also strongly influence C sequestration and cycling (Tisdall and Oades, 1982; Jastrow, 1996; Six et al., 1998). Tisdall and Oades (1982) presented a hierarchical model, which suggested that three different classes of organic matter, persistent, transient, and temporary, are associated with three different physical soil fractions, that is, ⬎250-m macroaggregates, 53- to 250-m microaggregates, and ⬍53-m silt-and-clay, respectively. Recently, several studies have shown the importance of microaggregates (Jastrow, 1996; Six et al., 1998; Gale et al., 2000; Puget et al., 2000) and especially microaggregates-within-macroaggregates (Six et al., 2000; Denef et al., 2004) in the protection and stabilization of C. Denef et al. (2004) showed that microaggregateswithin-macroaggregates could explain almost the entire difference in SOC between no-tillage and conventional tillage systems. The objectives of this study were to (i) quantify the relationship between C input and SOC sequestration in whole soil and SOM fractions and (ii) identify mechanisms of long-term soil C stabilization in cropping systems that represented a gradient of C input levels.
One of our current challenges is to quantify the mechanisms, capacity, and longevity of C stabilization in agricultural lands. The objectives of this study were to evaluate the long-term (10 yr) role of C input in soil organic carbon (SOC) sequestration and to identify underlying mechanisms of C stabilization in soils. Carbon input and SOC sequestration, as governed by crop management strategies, were assessed across 10 Mediterranean cropping systems. Empirically derived relationships between yield and aboveground plus belowground crop biomass as well as estimates of C contributions from crop residues and manure amendments were used to quantify cumulative C inputs into each cropping system. Soil samples were separated into four aggregate size classes (⬎2000, 250–2000, 53–250, and ⬍53 m) and into three soil organic matter (SOM) fractions within the large (⬎2000 m) and small (250– 2000 m) macroaggregates. Aggregate stability increased linearly with both C input (r 2 ⫽ 0.75, p ⫽ 0.001) and SOC (r 2 ⫽ 0.63, p ⫽ 0.006). Across the 10 cropping systems, annual soil C sequestration rates ranged from ⫺0.35 to 0.56 Mg C ha⫺1 yr⫺1. We found a strong linear relationship (r 2 ⫽ 0.70, p ⫽ 0.003) between SOC sequestration and cumulative C input, with a residue-C conversion to SOC rate of 7.6%. This linear relationship suggests that these soils have not reached an upper limit of C sequestration (i.e., not C saturated). In addition, C shifted from the ⬍53-m fraction in low C input systems to the large and small macroaggregates in high C input systems. A majority of the accumulation of SOC due to additional C inputs was preferentially sequestered in the microaggregates-within-small-macroaggregates (mM). Hence, the mM fraction is an ideal indicator for C sequestration potential in sustainable agroecosystems.
C
urrently, crop-based agriculture, excluding pastureland, occupies 1.7 billion hectares globally (Paustian et al., 1997a). It is estimated that 111 to 170 Pg C or approximately 10% of the earth’s total soil C (1500 Pg) (Post et al., 1990; Eswaran et al., 1993) is stored within agricultural soils (Schlesinger, 1984; Paustian et al., 1997a). Revived interest in SOC is due partly to its role as an important indicator of soil quality (Gregorich and Carter, 1997; Lal, 1997), and its potential function as a C sink (Bruce et al., 1998; Paustian et al., 1997a). Farming systems that utilize best management practices hold promise for sequestering soil C, which has the potential to enhance agricultural sustainability, reduce negative environmental impacts, and attenuate anthropogenic carbon dioxide emissions. If the potential benefits of SOC sequestration are to be validated, then there exists a substantial need to elucidate and accurately quantify
Abbreviations: CMT, conventional–maize–tomato; cPOM, coarse particulate organic matter; CWT, conventional–wheat–tomato; IWC, irrigated–wheat–control; IWF, irrigated–wheat–fallow; IWL, irrigated– wheat–legume; LMT, legume–maize–tomato; mM, microaggregateswithin-macroaggregates; MWD, mean weight diameter; OMT, organic– maize–tomato; RWC, rainfed–wheat–control; RWF, rainfed–wheat– fallow; RWL, rainfed–wheat–legume; sc-M, silt-and-clay-within-macroaggregates; SOC, soil organic carbon; SOM, soil organic matter.
Dep. of Plant Sciences, Univ. of California, Davis, CA 95616. Received 29 June 2004. *Corresponding author (
[email protected]). Published in Soil Sci. Soc. Am. J. 69:1078–1085 (2005). Soil Biology & Biochemistry doi:10.2136/sssaj2004.0215 © Soil Science Society of America 677 S. Segoe Rd., Madison, WI 53711 USA
1078
1079
KONG ET AL.: LINKING C INPUT, AGGREGATION, AND C STABILIZATION
Table 1. The 10 cropping systems at the Long-Term Research on Agricultural Systems site (LTRAS; Davis, CA, USA).
Reproduced from Soil Science Society of America Journal. Published by Soil Science Society of America. All copyrights reserved.
Cropping system Rainfed–wheat–control (RWC) Rainfed–wheat–legume (RWL) Rainfed–wheat–fallow (RWF) Irrigated–wheat–control (IWC) Irrigated–wheat–legume (IWL) Irrigated–wheat–fallow (IWF) Conventional–wheat–tomato (CWT) Conventional–maize–tomato (CMT) Legume–maize–tomato (LMT) Organic–maize–tomato (OMT)
Even years of cropping
Odd years of cropping
unfertilized rainfed wheat unfertilized rainfed wheat fertilized rainfed wheat unfertilized irrigated wheat unfertilized irrigated wheat fertilized irrigated wheat fertilized irrigated wheat fertilized irrigated maize winter legume then irrigated maize winter legume then irrigated maize with composted manure and no pesticides
fallow rainfed legume cover crop fallow fallow rainfed legume cover crop fallow fertilized irrigated tomato fertilized irrigated tomato fertilized irrigated tomato winter legume then irrigated tomato with composted manure and no pesticides
MATERIALS AND METHODS
Physical Fractionation
Study Site
Air-dried 2003 soil samples were separated into four aggregate size classes by wet-sieving through a series of three sieves (2000, 250, and 53 m) according to Elliott (1986). Before sieving, air-dried soil samples were submerged in deionized water, at room temperature, on top of the 2000-m sieve for 5 min, thereby slaking the soil. Slaking disrupts aggregates due to the buildup of internal air pressure during the rapid wetting of the soil (Kemper et al., 1985). Water-stable aggregates were separated by moving the sieve in an up-and-down motion with 50 repetitions, over a period of 2 min. The material remaining on the 2000-m sieve (⬎2000-m aggregates) was backwashed off the sieve and collected in aluminum pans. Soil and water that passed through the 2000-m sieve were transferred onto the next smaller-sized sieve (250 m) and underwent the same sieving procedure as outlined above. The soil-water solution from this second sieving was further wet-sieved with the smallest sieve (53 m). Consequently, four aggregate size fractions were produced: (i) large macroaggregates (⬎2000 m), (ii) small macroaggregates (250–2000 m), (iii) microaggregates (53–250 m), and (iv) silt-and-clay (⬍53 m) fractions. The aggregate fractions retained on each sieve were oven-dried at 50⬚C. Mean weight diameter (MWD) was used as an index of aggregate stability and was calculated by summing the weighted proportion of each aggregate fraction obtained from a whole soil sample.
Soil samples were taken from the Long-Term Research on Agricultural Systems (LTRAS) experimental site (Davis, CA; 38⬚32⬘24″ N, 121⬚52⬘12″ W). Two soil types are present at the LTRAS site: (i) Yolo silt loam (fine-silty, mixed, nonacid, thermic Typic Xerothent) and (ii) Rincon silty clay loam (fine, montmorillonitic, thermic Mollic Haploxeralf). The climate is Mediterranean with a winter wet-season that does not coincide with the height of crop water use. Since 1993, the LTRAS has been a site for testing the sustainability of conventional and alternative cropping management practices. The LTRAS site houses a main experiment with 10 different 2-yr rotation cropping systems (Table 1), which vary in crop, irrigation, nitrogen levels, and nitrogen sources. The 10 cropping systems are represented by three 0.4-ha replicate plots, with both phases of each 2-yr rotation represented each year. Crops are planted on beds and water is applied to irrigated plots via furrow irrigation. Vetch (Vicia dasycarpa Ten.) and pea (Pisum sativum L.) (winter legume cover crops), wheat (Triticum aestivum L.), and maize (Zea mays L.) are direct-seeded and tomato (Lycopersicon esculentum Mill.) is transplanted. Fertilizer applications are determined by crop demand while legume biomass and composted manure inputs to the legume–maize–tomato (LMT) and organic–maize–tomato (OMT) cropping systems are incorporated in early spring, using bed-preserving tillage equipment. Several studies (Hasegawa et al., 1999; Denison et al., 2004; Martini et al., 2004) report yield, soil properties, crop residue, and weather data pertaining to each of the cropping systems for the 10 yr following the initiation of the experiment.
Soil Sampling In April 2003, soil cores (4.7-cm diameter) were collected from the 0- to 15-cm layer of all three replicate plots of one phase of each of the 10 cropping systems. Five soil cores were collected at 15-m intervals along the north–south transect of each replicate plot. Once in the laboratory, bulk densities were determined for the individual soil cores. Subsequently, the field-moist soil was gently broken apart, passed through an 8-mm sieve, air-dried, and stored at room temperature. The five soil cores from each plot were composited for further analysis. Subsamples of archived LTRAS soils, which were taken in September 1993 (time-zero of the LTRAS experiment) from the 0- to 15-cm layer, were obtained for plots corresponding to those that were sampled in April 2003. These 2-mm-sieved subsamples were stored at room temperature until further analysis.
Microaggregate Isolation Subsamples of approximately 10 g from both the large and small macroaggregate fractions were further separated into coarse particulate organic matter (⬎250 m; cPOM), microaggregates (53–250 m; mM), and silt-and-clay (⬍53 m; sc-M) fractions according to the methodology outlined in Six et al. (2000). Macroaggregates were immersed in deionized water on top of a 250-m mesh screen and gently shaken with 50 glass beads (4-mm diameter) under a continuous and steady stream of water, until all macroaggregates were completely dispersed. The ⬎250-m-sized material remained on the 250-m screen while the stream of water flushed the ⬍250-m-sized material onto a 53-m sieve, avoiding disruption of the ⬍250m-sized material by the beads. The material on the 53-m sieve was wet-sieved to isolate only water-stable mM. The fraction that passed through the 53-m sieve (sc-M) was collected and, along with the other two isolated SOM fractions, oven-dried at 50⬚C.
Carbon Analysis Subsamples of both 1993 and 2003 whole-soil samples as well as all 2003 extracted aggregate plus SOM fractions (i.e., large and small macroaggregates, microaggregates, silt-and-clay, cPOM, mM, and sc-M) were ground and analyzed for C concentrations using a Carlo-Erba NA 1500 elemental analyzer (Milan, Italy). Since we determined that the samples were free
1080
SOIL SCI. SOC. AM. J., VOL. 69, JULY–AUGUST 2005
Table 2. Formulas relating above- and belowground biomass to yields for maize, wheat, and tomato crops. Formula
Reproduced from Soil Science Society of America Journal. Published by Soil Science Society of America. All copyrights reserved.
ha⫺1)
Maize stover (Mg dry wt. ⫽ 1.06 ⫻ grain dry wt. (Mg dry wt. ha⫺1) ⫹ 0.50† Winter wheat straw (Mg dry wt. ha⫺1) ⫽ 1.06 ⫻ grain dry wt. (Mg dry wt. ha⫺1) ⫹ 0.39† Maize roots (Mg dry wt. ha⫺1) ⫽ 0.23 ⫻ aboveground biomass dry wt. (Mg dry wt. ha⫺1)† Wheat roots (Mg dry wt. ha⫺1) ⫽ 0.22 ⫻ aboveground biomass dry wt. (Mg dry wt. ha⫺1)† Tomato aboveground biomass (Mg dry wt. ha⫺1) ⫽ 0.001(fresh wt. yield Mg ha⫺1)2 ⫹ 0.05(fresh wt. yield Mg ha⫺1) ⫹ 0.34 Tomato roots (Mg dry wt. ha⫺1) ⫽ 0.30 ⫻ aboveground biomass (Mg dry wt. ha⫺1)‡ † Equations are adapted from S. Williams (personal communication, 2004). ‡ Aboveground biomass does not include tomato yield.
of inorganic C (carbonates), the total C measured was taken to be equivalent to the quantity of organic C in the soil sample. The concentration of total organic C determined by the C analysis was converted to a m2 by 15-cm-depth basis using bulk density measurements. Because the archived LTRAS soils from 1993 were only available in a 2-mm-sieved form and affiliated soil core data had not been recorded, bulk densities for the 1993 soil samples were not available. Hence, bulk densities measured from the 2003 sampling date (1.11–1.38 g cm⫺3) were used to calculate 1993 SOC concentrations for the 10 cropping systems. We assumed drastic changes in bulk density did not occur between 1993 and 2003.
Determination of Cumulative Carbon Input and Sequestered Soil Organic Carbon Cumulative C input values for the 10 cropping systems at the LTRAS site were derived from nine years (1994–2002) of harvest yield data. Yield data and added composted manure estimates for 1994 through 2002 harvests were adapted from Denison et al. (2004). Empirical equations were used to estimate crop residue-derived C inputs (Table 2). Unfortunately, studies reporting conversion equations for maize and wheat yields to maize stover and wheat straw (aboveground biomass), respectively, were few in number or limited to specific cultivars. Hence, we used conversion equations originating from an extensive data set, which has been regularly updated since 1999 with data from numerous studies across the United States (S. Williams, personal communication, 2004). The equation employed in quantifying tomato-derived residue data was established from a review of available studies relating aboveground tomato biomass and tomato yield (Yaffa et al., 2000; Cavero et al., 1997; Sainju et al., 2001). Belowground tomato biomass was assumed to be 30% of aboveground biomass in our calculations (M. Burger and L.E. Jackson, personal communication, 2003). To determine the C input gradient, we quantified cumulative C input levels for each of the 10 cropping systems (30 plots), by summing the total C contribution from crop residues and
additions over the nine seasons between 1993 and 2003. Carbon concentrations of maize, wheat, and tomato residue were on average 43% C, while mean C concentrations of composted manure and cover crop were 20.4% and 43.1% C, respectively (R.F. Denison, personal communication, 2003). The SOC sequestered in each plot after 10 yr of the respective cropping management practices was calculated as the mathematical difference between the 1993 and 2003 SOC values. Positive and negative SOC values were interpreted as SOC gains and losses for the cropping systems, respectively.
Statistical Analyses Multiple linear regression analyses of the dependent variables (SOC sequestered, aggregate-associated C for the four aggregate size classes, percentage of macroaggregate-C as SOM fraction-C, and MWD) against the independent variable (cumulative C input level) were performed using the PROC REG procedure of SAS software Release 8.2. (SAS Institute, 2002). Data for 1993 SOC, 2003 SOC, annual SOC sequestered, cumulative C input level, MWD (dependent variables), and cropping systems (independent variable) were analyzed using the SAS statistical package for analysis of variance (ANOVA; PROC GLM) (SAS Institute, 2002). Differences between means were calculated based on least significant difference tests, with the LSD option of the MEANS statement and with a significance level of p ⬍ 0.05. Where transformations were needed to meet normality assumptions, data were power-transformed.
RESULTS Carbon Input Levels, Soil Organic Carbon, and Aggregate Stability Estimates of cumulative C input levels for each of the cropping systems after 10 yr of continuous cropping management ranged from a low of 8.3 Mg C ha⫺1 in the rainfed–wheat–control (RWC) system to a high of 89.6 Mg C ha⫺1 in the OMT system (Table 3). It should
Table 3. Soil organic carbon (SOC), sequestered SOC, cumulative C input, and aggregate stability values for the 10 cropping systems at the Long-Term Research on Agricultural Systems site (LTRAS; Davis, CA, USA). SOC Cropping system†
1993
2003
Annual SOC sequestered
Cumulative C input
Mean weight diameter (MWD)
16.9c 15.9c 17.9bc 16.1c 17.8bc 19.6b 17.1c 16.9c 17.7bc 22.8a
Mg C ha⫺1 yr⫺1 ⫺0.35c ⫺0.19bc ⫺0.05bc 0.04b 0.06b 0.06b ⫺0.06bc ⫺0.01b 0.04b 0.56a
Mg C ha⫺1 8.3g 9.1fg 10.3ef 11.8e 30.4d 30.5d 42.0c 45.9c 51.8b 89.6a
mm 0.33a 0.31a 0.37ab 0.30a 0.80c 0.95cd 0.45b 0.88c 0.85c 1.2d
Mg C ha⫺1 RWC IWC RWF IWF IWL RWL CWT LMT CMT OMT
20.4a‡ 17.7b 18.4b 15.8b 17.2b 18.9b 17.7b 17.0b 17.3b 17.2b
† CMT, conventional–maize–tomato; CWT, conventional–wheat–tomato; IWC, irrigated–wheat–control; IWF, irrigated–wheat–fallow; IWL, irrigated– wheat–legume; LMT, legume–maize–tomato; OMT, organic–maize–tomato; RWC, rainfed–wheat–control; RWF, rainfed–wheat–fallow; RWL, rainfed– wheat–legume. ‡ Values followed by a different lowercase letter within one column are significantly different (p ⬍ 0.05) between cropping systems.
Reproduced from Soil Science Society of America Journal. Published by Soil Science Society of America. All copyrights reserved.
KONG ET AL.: LINKING C INPUT, AGGREGATION, AND C STABILIZATION
be noted that the OMT system received annual external C inputs in the form of composted manure for a cumulative C contribution of 25.9 Mg C ha⫺1. Between the RWC and irrigated–wheat–control (IWC) systems and the rainfed– and irrigated–wheat–fallow (RWF and IWF, respectively) systems, where the N fertilization rates to each cropping system pair were similar, the irrigated counterparts showed significantly higher C input levels compared with the rainfed systems. In the rainfed– and irrigated– wheat–legume (RWL and IWL, respectively) cropping system pair, where winter legume cover crops were incorporated in alternating winters, no difference in C input associated with irrigation was observed. However, the latter two systems received significantly higher C inputs than the systems that included a fallow year rotation (Table 3). Average C input values calculated for the maize–tomato systems were significantly higher than the other seven cropping systems (Table 3). A mean SOC value of 17.8 Mg C ha⫺1 (SE ⫽ 0.60) was found for the archived 1993 soils across all 10 cropping systems. After 10 yr of continuous cropping management, the RWC, IWC, RWF, conventional–wheat– tomato (CWT), and LMT systems lost SOC, whereas the IWF, IWL, RWL, conventional–maize–tomato (CMT), and OMT systems sequestered SOC (Table 3). Soil organic C losses were greatest in the wheat control systems, RWC and IWC (Table 3). A significantly higher accumulation of SOC was seen in the OMT system than in the other cropping systems (Table 3). In addition, annual C sequestration rates at the LTRAS site ranged from ⫺0.35 Mg C ha⫺1 yr⫺1 in the low C input RWC system to 0.56 Mg C ha⫺1 yr⫺1 in the high C input OMT system (Table 3). Irrigated and rainfed legume cover cropped wheat systems (IWL and RWL, respectively) demonstrated identical yearly C sequestration rates (Table 3). Aggregate stability was low for the control (RWC
1081
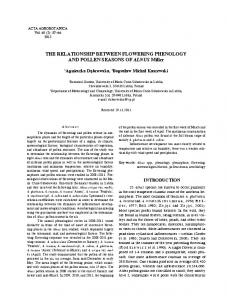
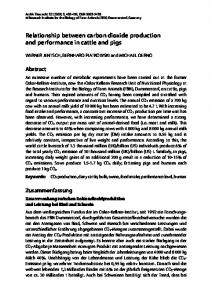
and IWC) and wheat fallow (RWF and IWF) cropping systems, with mean plot MWD values in the range of 0.30 to 0.37 mm (Table 3). A MWD value of 0.45 mm was found for the CWT system, which was approximately 30% higher than mean MWD values of the control and wheat systems, but about 50% less than the maize–tomato cropping systems and the cropping systems with winter legume cover crops. The OMT system had the highest MWD value of the LTRAS cropping systems (Table 3). Furthermore, 50 to 70% of the soil in the RWC, IWC, RWF, IWF, and CWT cropping systems was recovered as microaggregates, while less than 2% of the soil in these systems was comprised of macroaggregates. However, up to 21% of the soil from the OMT, CMT, IWL, RWL, and LMT cropping systems was found in the macroaggregate fraction. Significant positive linear relationships were found between SOC sequestered and aggregate stability (r 2 ⫽ 0.63, p ⫽ 0.006), aggregate stability and C input levels (r 2 ⫽ 0.75, p ⫽ 0.001), as well as between SOC and C input levels (r 2 ⫽ 0.70, p ⫽ 0.003; Fig. 1). The relationship between SOC sequestered (Y: Mg C ha⫺1) and cumulative C input (X: Mg C ha⫺1) was described by the following linear equation: Y ⫽ 0.076X ⫺ 2.39. Multiple linear regressions indicated a significant ( p ⫽ 0.006) relationship across the cropping systems between SOC sequestered, MWD, and the cumulative C input: MWD ⫽ 0.35 ⫹ 0.03(SOC sequestered) ⫹ 0.009(C input) (r 2 ⫽ 0.77; data not shown)
Macroaggregate-, Microaggregate-, and ⬍53-m-Fraction-Associated Carbon While a significant positive interaction was observed between cumulative C inputs levels and both the large macroaggregate-associated C (r 2 ⫽ 0.71, p ⫽ 0.002) and
Fig. 1. Relationship between sequestered soil organic carbon (SOC) and cumulative carbon (C) input across the 10 different cropping systems at the LTRAS site (Long-Term Research on Agricultural Systems, Davis, CA, USA). Vertical and horizontal error bars indicate standard errors from the means of the SOC sequestered and cumulative C input level, respectively.
Reproduced from Soil Science Society of America Journal. Published by Soil Science Society of America. All copyrights reserved.
1082
SOIL SCI. SOC. AM. J., VOL. 69, JULY–AUGUST 2005
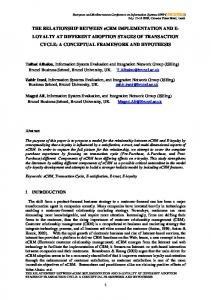
Fig. 2. Trends in aggregate-associated carbon (C) across the C input gradient determined for the 10 cropping systems at the LTRAS site (LongTerm Research on Agricultural Systems, Davis, CA, USA). Vertical and horizontal error bars indicate standard errors from the means of the aggregate-associated C and cumulative C input level, respectively.
small macroaggregate-associated C (r 2 ⫽ 0.80, p ⫽ 0.0005) (Fig. 2), the microaggregate-associated C was found to decrease with increasing C inputs (r 2 ⫽ 0.33, p ⫽ NS) (Fig. 2). Carbon concentrations of the large and small macroaggregate fractions increased from 0.1 to 4.9 Mg C ha⫺1 and from 1.7 to 8.8 Mg C ha⫺1, respectively. Carbon sequestration within the large and small macroaggregate fractions increased with increasing C input levels at rates of 0.05 and 0.06 Mg aggregate-C Mg⫺1 C input, respectively (Fig. 2). Microaggregate-associated C concentrations decreased from 11.2 to 4.3 Mg C ha⫺1 at a rate of 0.04 Mg aggregate-C Mg⫺1 C input, across the C input gradient (Fig. 2). No influence from increasing C inputs was observed for ⬍53-m-associated C (Fig. 2).
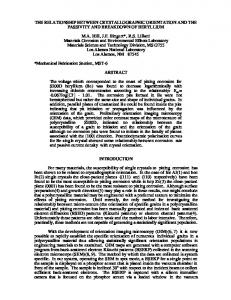
Carbon Stabilization in Soil Organic Matter Fractions Isolated from Large and Small Macroaggregate The percentage of large macroaggregate-C and small macroaggregate-C as cPOM-C ranged from 7 to 31 and 6 to 44%, respectively (data not shown for large macroaggregates, but shown in Fig. 3 for small macroaggregates). Additionally, the regression relationships between cumulative C input and both the percentage large macroaggregate-C and small macroaggregate-C as cPOM-C were not significant (Fig. 3). A similarly insignificant regression relationship was found between the percentage large macroaggregate-C and small macroaggregateC as sc-M-C and C input levels (Fig. 3). In both the large and small macroaggregate fractions, the mM fraction accounted for 40 to 68% of the C stabilized within these macroaggregate fractions. In addition, the percentage of small macroaggregate-C as mM-C significantly increased along the increasing C input gradient (r 2 ⫽ 0.45,
p ⫽ 0.03; Fig. 3). However, the relationship between C input and the percentage of large macroaggregate-C as mM-C was not significant (data not shown).
DISCUSSION Carbon Input and Soil Organic Carbon Sequestration Since SOC levels usually change only slowly with time following a change in cropping management, long-term experiments are necessary to detect differences in SOC against the background SOC as well as against analytical variability. Rasmussen and Parton (1994) and others (e.g., Cole et al., 1993; Horner et al., 1960; Larson et al., 1972) have shown that SOC responds linearly to increasing rates of residue or C additions in both short- and long-term experiments. The strong, linear relationship found between SOC sequestered and cumulative C input after 10 yr of continuous cropping at the LTRAS site corroborates these findings. Furthermore, C sequestration rates of the cropping systems at the LTRAS site were comparable with rates found at other experimental sites of equivalent duration. A conversion from continuous wheat to wheat–fallow in Swift Current, Saskatoon, Canada (Campbell et al., 1995) was reported to have lost 0.21 Mg C ha⫺1 yr⫺1. A similar rotation change at the LTRAS site, from the CWT to the IWF system, resulted in a loss of 0.13 Mg C ha⫺1 yr⫺1. Conversion of a continuous wheat to a wheat–legume cropping system on an Entic Haplustoll in Buenos Aires, Argentina (Miglierina et al., 2000) led a SOC sequestration rate of 0.43 Mg C ha⫺1 yr⫺1. We found that the inclusion of a winter legume cover crop to the rainfed wheat system
Reproduced from Soil Science Society of America Journal. Published by Soil Science Society of America. All copyrights reserved.
KONG ET AL.: LINKING C INPUT, AGGREGATION, AND C STABILIZATION
1083
Fig. 3. Cumulative carbon (C) input levels for the 10 cropping systems at the LTRAS site (Long-Term Research on Agricultural Systems, Davis, CA, USA) regressed against percentages of small macroaggregate-C derived from soil organic matter fractions that were isolated from the small macroaggregates. Vertical and horizontal error bars indicate standard errors from the means of the percentage of small macroaggregate-C as soil organic matter (SOM) fraction-C and the cumulative C input level, respectively.
also increased SOC levels and at a rate of 0.23 Mg C ha⫺1 yr⫺1. In terms of C sequestration potential, the strong linear relationship between SOC sequestered and C input suggests that the soils at the LTRAS site were not C saturated. The range of cumulative C input levels (10–90 Mg C ha⫺1) among the LTRAS cropping systems was greater than the range (40–70 Mg C ha⫺1) applied in Melfort, Saskatchewan (Canada), yet the SOC sequestered across the LTRAS cropping systems showed a positive, linear response to C additions, while no relationship was found between SOC sequestered and cumulative C inputs for the Melfort soil (Campbell et al., 1991). Within the conceptual SOM model proposed by Six et al. (2002), which defined a maximum soil C storage potential, the LTRAS soils had a large saturation deficit and, therefore, held great potential for C sequestration. Despite corroborating the results of studies that found linear relationships between changes in SOC relative to increasing C input, comparison of our data with that of other long-term agricultural experiment sites suggests that cropping systems in California have a lower efficiency in sequestering C from added C inputs. The slope of the relationship between SOC sequestered and cumulative C input corresponds to the residue-C conversion to SOC rate. It follows that 7.6% of each additional Mg C input per hectare is sequestered as SOC at the LTRAS site. This estimate of the residue-C conversion to SOC rate at the LTRAS site was similar to the rate Horner et al. (1960) found for a continuous wheat system in Pullman, Washington, where 8.7% of organic residue was ultimately retained as SOC. However, Rasmussen and Smiley (1997) found a residue-C conversion to SOC rate of 14.8% for a wheat–fallow system in Pendleton, Oregon. Moreover, under a variety of climatic conditions,
Rasmussen and Collins (1991) found that the residue-C conversion to SOC rates ranged between 0.14 and 0.21, which were two to three times greater than that found for the LTRAS cropping systems. Our data indicate that the cropping systems at the LTRAS site must receive C inputs in excess of 3.1 Mg C ha⫺1 yr⫺1 to maintain SOC levels (zero change). This amount of C addition necessary to prevent the loss of SOC is 11 times greater than the quantity of C input required for maintenance of SOC levels (0.29 Mg C ha⫺1 yr⫺1) in a wheat system in Montana (Black, 1973). The lower C sequestration efficiency found at the LTRAS site than at other long-term agricultural research sites is likely a consequence of hot summers, which are typical of Mediterranean climates, coupled with moist soil conditions due to irrigation. Nevertheless, further studies are needed to address the inefficient stabilization of C inputs and the enormous ensuing C losses (80–98% of C input) to the atmosphere from seemingly sustainable agroecosystems.
Quality of Carbon Inputs and Soil Organic Carbon Sequestration While it has been suggested that the type of residue applied to a soil only weakly relates to SOC levels (Larson et al., 1972) and that the overriding cover crop effect of various cover crop species on SOC is due to the magnitude of the cover crop-C inputs (Kuo et al., 1997), our results suggest that residue quality might be directly linked to the amount of SOC sequestered in cropping systems. We observed a trend where certain cropping systems disproportionately accumulated SOC relative to their C input level. For example, the OMT cropping system received 1.7 times more C additions in the form of
Reproduced from Soil Science Society of America Journal. Published by Soil Science Society of America. All copyrights reserved.
1084
SOIL SCI. SOC. AM. J., VOL. 69, JULY–AUGUST 2005
crop residues, winter legume cover crops, and composted manure, on a yearly basis, than the CMT cropping system. However, the OMT system had an annual C sequestration rate 14 times greater than the CMT system, where the C inputs consisted only of crop residues. Comparison of the two rainfed wheat systems (RWF and RWL) also revealed a disproportionate rate of SOC sequestration relative to the difference in C input between the two systems. Although the RWL system received three times higher annual C inputs (wheat residue and legume cover crop) than its wheat–fallow counterpart (RWF), the net annual SOC sequestration in RWL system was more than three times larger than the net SOC accumulation in the RWF system, which actually lost SOC. Moreover, in a comparison of the CWT and the two wheat–legume systems (IWL and RWL), where 1.4 times more C inputs were added annually to the CWT system than to either the IWL and RWL systems, annual C sequestration rates for both wheat–legume systems were found to be close to three times higher than that of the CWT system. Hence, it appears that the growth of winter legume cover crops in the IWL and RWL systems enhanced the rate of C sequestration, irrespective of irrigation. Our data imply that C quality, as governed by legume and compost addition, is as influential on soil C sequestration as the quantity of C added to the system.
Preferential Sequestration of Carbon Oades (1984) was the first to conceptualize the formation of microaggregates taking place at the center of macroaggregates, and subsequent studies by several investigators (e.g., Golchin et al., 1994; Angers et al., 1997; Six et al., 1998) have corroborated the notion of microaggregate formation within macroaggregates. After 10 yr of continuous cropping management at the LTRAS site, the distribution of aggregates and aggregate-associated C appears to have shifted from the microaggregates in the low C input systems to the macroaggregates in the high C input systems. Our soil sampling event took place at the end of the winter legume cover crop growing season. Consequently, active roots might have artificially increased aggregation for the RWL and IWL cropping systems. Nevertheless, our results show that the relationship between C input and SOC sequestration was dominated by the increase in SOC associated with the macroaggregate fractions and that SOC stabilization is associated with greater macroaggregation (i.e., higher MWD). Following 10 yr of continuous cropping management, the LTRAS soils demonstrated preferential sequestration of SOC in the mM fraction (Fig. 3). Recent findings have revealed the importance of microaggregates formed within macroaggregates to C sequestration in soils (Six et al., 2000; Bossuyt et al., 2002; Denef et al., 2004). Similarly, Del Galdo et al. (2003) found that afforestation resulted in significant sequestration of new C and stabilization of old C in physically protected SOM fractions associated with the mM fraction. To ascertain the preferential sequestration of C in the mM fraction, we normalized the C concentration of the SOM fractions with the amount of C in the macroaggregate fraction from which the SOM fraction was isolated. If the C content of the SOM fraction is not cor-
rected for macroaggregate-C, then an overall macroaggregate-C accumulation would have translated to an accumulation in the SOM fraction, regardless of actual physical protection and preferential sequestration of C within the SOM fraction. The higher value of the percentage of macroaggregate-C derived from mM-C suggests that the mM was a pool with slower C turnover than either the cPOM or sc-M fractions. The low values for the percentage macroaggregate-C as sc-M-C were in agreement with the lack of significant correlation between increasing C inputs and C associated with the sc-M fraction isolated from both the large and small macroaggregates. Insignificance of the relationship between C input and the percentage of large macroaggregate-C as mM-C and the lower rate of C stabilization found in the large versus the small macroaggregates were likely the results of the fact that the large macroaggregate fraction comprised a very small portion of the entire soil and did not contribute a significant amount of C to the total SOC pool. Compared with the small macroaggregate and microaggregate fractions, which represented 13 to 50% of the total SOC, the large macroaggregate fraction consisted of an insignificant part of the total SOC (0.6–14.9% of total SOC). Across the cropping systems, the increase in SOC sequestered along the increasing C input gradient could not be attributed to either the C associated with the cPOM or silt-and-clay fractions isolated from the large and small macroaggregates. However, the preferential sequestration of SOC in the mM of the small macroaggregates explains the majority of the increase in the amount of SOC sequestered across the C input gradient. Our findings suggest that the mM fraction is an ideal diagnostic indicator of long-term SOC sequestration.
CONCLUSIONS Our results corroborate previous findings that the rate of change in SOC is directly related to the level of C input from crop residue and added C amendments. The strong linear relationship found between SOC sequestered and C input levels indicated that the LTRAS soils were not C saturated. Nevertheless, we found that only 7.6% of each additional Mg C input per hectare was sequestered as SOC. Furthermore, it seems that not only the quantity, but also the quality of above- plus belowground crop residue returned to the soil determines the rate of soil C sequestration. We also found that long-term management practices that augment residue-C returned to the soil will result in increased aggregate stability, increased aggregateassociated SOC levels, and long-term C sequestration. We demonstrated a preferential stabilization of soil C in the microaggregate fraction that was isolated from small macroaggregates. This result corroborates findings from recent studies in afforested and no-tillage systems. Therefore, preferential C sequestration in the microaggregate-within-small macroaggregate fraction seems to be a principal mechanism and ideal indicator of long-term soil C sequestration in agroecosystems.
KONG ET AL.: LINKING C INPUT, AGGREGATION, AND C STABILIZATION
Reproduced from Soil Science Society of America Journal. Published by Soil Science Society of America. All copyrights reserved.
ACKNOWLEDGMENTS Many thanks to Sonya Hendren and Bastian Boots for help with laboratory work and in the field, respectively. Thanks to the entire LTRAS crew for their time and assistance with our preparations for soil sampling. Funding for this project was provided by the Kearney Foundation of Soil Science, University of California.
REFERENCES Angers, D.A., S. Recous, and C. Aita. 1997. Fate of carbon and nitrogen in water-stable aggregates during decomposition of 13C15N-labelled wheat straw in situ. Eur. J. Soil Sci. 48:295–300. Black, A.L. 1973. Soil property changes associated with crop residue management in wheat-fallow rotation. Soil Sci. Soc. Am. Proc. 37: 943–946. Bossuyt, H., J. Six, and P.F. Hendrix. 2002. Aggregate-protected carbon in no-tillage and conventional tillage agroecosystems using carbon-14 labeled plant residue. Soil Sci. Soc. Am. J. 66:1965–1973. Bruce, J.P., M. Frome, E. Haites, H. Janzen, R. Lal, and K. Paustian. 1998. Carbon sequestration in soils. In Proc. Soil and Water Conservation Society’s Carbon Sequestration in Soils Workshop, Calgary, AB. 21–22 May 1998. SWCS, Ankeny, IA. Campbell, C.A., K.E. Bowren, M. Schnitzer, R.P. Zentner, and L. Townley-Smity. 1991. Effect of crop rotations and fertilization on soil biochemical properties in a thick Black Chernozem. Can. J. Soil Sci. 71:377–387. Campbell, C.A., B.G. McConkey, R.P. Zentner, F.B. Dyck, F. Selles, and D. Curtin. 1995. Carbon sequestration in a Brown Chernozem as affected by tillage and rotation. Can. J. Soil Sci. 75:449–458. Cavero, J., R.E. Plant, C. Shennan, and D.B. Friedman. 1997. The effect of nitrogen source and crop rotation on the growth and yield of processing tomatoes. Nutr. Cycling Agroecosyst. 47:271–282. Cole, C.V., K. Flach, J. Lee, D. Sauerbeck, and B. Stewart. 1993. Agricultural sources and sinks of carbon. Water Air Soil Pollut. 70:111–122. Del Galdo, I., J. Six, A. Peressotti, and M.F. Cotrufo. 2003. Assessing the impact of land-use change on soil C sequestration in agricultural soils by means of organic matter fractionation and stable isotopes. Global Change Biol. 9:1204–1213. Denef, K., J. Six, R. Merckx, and K. Paustian. 2004. Carbon sequestration in microaggregates of no-tillage soils with different clay mineralogy. Soil Sci. Soc. Am. J. 68:1935–1944. Denison, R.F., D.C. Bryant, and T.E. Kearney. 2004. Crop yields over the first nine years of LTRAS, a long-term comparison of field crop systems in a Mediterranean climate. Field Crops Res. 86:267–277. Elliott, E.T. 1986. Aggregate structure and carbon, nitrogen, and phosphorus in native and cultivated soils. Soil Sci. Soc. Am. J. 50:627–633. Eswaran, H., E. van Den Berg, and P.F. Reich. 1993. Organic carbon in soils of the world. Soil Sci. Soc. Am. J. 57:192–194. Gale, W.J., C.A. Cambardella, and T.B. Baily. 2000. Root-derived carbon and the formation and stabilization of aggregates. Soil Sci. Soc. Am. J. 64:201–207. Golchin, A., J.M. Oades, J.O. Skjemstadt, and P. Clarke. 1994. Study of free and occluded particulate organic matter in soils by solid state 13 C CP/MAS NMR spectroscopy and scanning electron microscopy. Aust. J. Soil Res. 32:285–309. Gregorich, E.G., and M.R. Carter. 1997. Soil quality for crop production and ecosystem health. Developments in Soil Science 25. Elsevier Sci. Publ., Amsterdam. Hartwig, N.L., and H.U. Ammon. 2002. Cover crops and living mulches. Weed Sci. 50:688–699. Hasegawa, H., J.M. Labavitch, A.M. McGuire, D.C. Bryant, and R.F. Denison. 1999. Testing CERES model predictions of N release from legume cover crop residue. Field Crops Res. 63:255–267. Horner, G.M., M.M. Oveson, G.O. Baker, and W.W. Pawson. 1960. Effect of cropping practices on yield, soil organic matter and erosion in the Pacific Northwest wheat region. Bull. 1. Washington, Oregon, and Idaho Agric. Exp. Stn., USDA-ARS, Washington, DC. Jastrow, J.D. 1996. Soil aggregate formation and the accrual of particu-
1085
late and mineral-associated organic matter. Soil Biol. Biochem. 28:656–676. Kemper, W.D., R. Rosenau, and S. Nelson. 1985. Gas displacement and aggregate stability of soils. Soil Sci. Soc. Am. J. 49:25–28. Kuo, S., U.M. Sainju, and E.J. Jellum. 1997. Winter cover crops effects on soil organic carbon and carbohydrate in soil. Soil Sci. Soc. Am. J. 61:145–152. Lal, R. 1997. Residue management, conservation tillage and soil restoration for mitigating greenhouse effect by CO2 enrichment. Soil Tillage Res. 43:81–107. Larson, W.E., C.E. Clapp, W.H. Pierre, and Y.B. Morachan. 1972. Effects of increasing amounts of organic residues on continuous maize: II. Organic carbon, nitrogen, phosphorus, and sulfur. Agron. J. 64: 204–208. Martini, E.A., J.S. Buyer, D.C. Bryant, T.K. Hartz, and R.F. Denison. 2004. Yield increases during the organic transition: Improving soil quality or increasing experience? Field Crops Res. 86:255–266. Miglierina, A.M., J.O. Iglesias, M.R. Landriscini, J.A. Galantini, and R.A. Rosell. 2000. The effects of crop rotation and fertilization on wheat productivity in the Pampean semiarid region of Argentina. 1. Soil physical and chemical properties. Soil Tillage Res. 53:129–135. Oades, J.M. 1984. Soil organic matter and structural stability: Mechanisms and implications for management. Plant Soil 76:319–337. Paustian, K., O. Andre´n, H. Janzen, R. Lal, P. Smith, G. Tian, H. Tiessen, M. van Hoordwijk, and P. Woomer. 1997a. Agricultural soil as a C sink to offset CO2 emissions. Soil Use Manage. 13:230–244. Paustian, K., H.P. Collins, and E.A. Paul. 1997b. Management controls on soil carbon. p. 15–42. In E.A. Paul et al. (ed.) Soil organic matter in temperate agroecosystems—Long-term experiments in North America. CRC Press, New York. Post, W.M., T.-H. Peng, W.R. Emanuel, A.W. King, V.H. Dale, and D.L. DeAngelis. 1990. The global carbon cycle. Am. Sci. 78:310–326. Puget, P., C. Chenu, and J. Balesdent. 2000. Dynamics of soil organic matter associated with particle-size fractions of water-stable aggregates. Eur. J. Soil Sci. 51:595–605. Rasmussen, P.E., R.R. Allmaras, C.R. Rohde, and N.C. Roager, Jr. 1980. Crop residue influences on soil carbon and nitrogen in wheatfallow system. Soil Sci. Soc. Am. J. 44:596–600. Rasmussen, P.E., and H.P. Collins. 1991. Long-term impacts of tillage, fertilizer, and crop residue on soil organic matter in temperate semiarid regions. Adv. Agron. 45:93–134. Rasmussen, P.E., and W.J. Parton. 1994. Long-term effects of residue management in wheat-fallow: I. Inputs, yield, and soil organic matter. Soil Sci. Soc. Am. J. 58:523–530. Rasmussen, P.E., and R.W. Smiley. 1997. Soil carbon and nitrogen change in long-term agricultural experiments at Pendleton, Oregon. p. 353–360. In E.A. Paul et al. (ed.) Soil organic matter in temperate agroecosystems—Long-term experiments in North America. CRC Press, New York. Sainju, U.M., B.P. Singh, and W.F. Whitehead. 2001. Comparison of the effects of cover crops and nitrogen fertilization on tomato yield, root growth, and soil properties. Sci. Hortic. (Amsterdam) 91:201–214. SAS Institute. 2002. Statistical analysis system. Version 8.2. SAS Inst., Cary, NC. Schlesinger, W.H. 1984. Soil organic matter: A source of atmospheric CO2. p. 111–127. In G.M. Woodwell (ed.) The role of terrestrial vegetation in the global carbon cycle. Measurement by remote sensing. John Wiley & Sons, New York. Six, J., R.T. Conant, E.A. Paul, and K. Paustian. 2002. Stabilization mechanisms of soil organic matter: Implications for C-saturation of soils. Plant Soil 241:155–176. Six, J., E.T. Elliott, and K. Paustian. 2000. Soil macroaggregate turnover and microaggregate formation: A mechanism for C sequestration under no-tillage agriculture. Soil Biol. Biochem. 32:2099–2103. Six, J., E.T. Elliott, K. Paustian, and J. Doran. 1998. Aggregation and soil organic matter accumulation in cultivated and native grassland soils. Soil Sci. Soc. Am. J. 62:1367–1377. Tisdall, J.M., and J.M. Oades. 1982. Organic matter and water-stable aggregates in soils. J. Soil Sci. 33:141–163. Yaffa, S., U.M. Sainju, and B.P. Singh. 2000. Fresh market tomato yield and soil nitrogen as affected by tillage, cover cropping, and nitrogen fertilization. HortScience 35:1258–1262.