2015 48th Hawaii International Conference on System Sciences
Agile Enterprise Metrics Daniel R Greening Senex Rex
[email protected] organization can have highly agile behavior at the team level, but if the teams are structured into small interdependent component teams, the organization’s release time can be so long it cannot adapt rapidly to changing market need [larm2010]. Agile production is characterized by short iterations that produce usable product increments. Short iterations force team members to contribute outside their primary specialty to achieve delivery. Agile teams use metric-based hypotheses to motivate process improvement. Agile teams make conscious tradeoffs between utility and consistency. Agile teams consciously assess risks and devise production experiments that reduce risk. Each of these characteristics directly contributes to a business outcome: Short iterations allow a business to adapt rapidly to market changes. Multi-skilled team members reduce risk of production interruptions when a specialist is unavailable or when the work load overwhelms. Empirical forecasting provides statistically defensible release dates and allows the company to make thoughtful tradeoffs in scheduling features for development. Empirical risk identification, by shipping software rapidly and finding bugs early, allows the team to quantify risk and cancel features or even whole projects before too much money is spent. Such concepts are scalable: they can apply not only to a 7-person Scrum team, but also to a large production effort or even an executive team. For example, average product release duration, the large-scale equivalent of Sprint length, can be used at a company-level to assess its agility [gree2012], A combination of widespread Scrum and Enterprise Scrum practices drove the average release duration at Citrix Online from roughly 20 months down to less than 4 months. Assuming that metrics are used for Good (insight into company behavior) and not Bad (creating incentives that motivate gaming), what other scalable metrics can help us assess the agility of organizations large and small?
Abstract Key performance indicators are used by some large enterprises to alert executives to opportunities and dangers. Executives seek “leading indicators” to help them make decision early enough to make a difference. In large enterprises adopting agile practices, managers sometimes use behavioral compliance metrics to help teams self-assess or to gauge how practices are performed. These often cause dysfunctions, especially when coupled with incentives to meet metric-based targets. We outline a set of scalable metrics that articulate the “Why?” of agile practices, and allow freedom for teams to explore their own approaches. Anecdotally, these approaches seem to produce improved Product Owner communication, team member alignment, more accurate forecasting and higher quality software production.
1
Introduction
What are our capabilities and risks, as a team or organization? How agile are we? How can we improve? Agilists and managers often ask these important questions. Some efforts to measure agility have focused on self-assessment of behavioral activities, including the Nokia Test [vodd2005] and the Scrum Checklist [knib2010]. Unfortunately, these behavioral metrics rarely scale naturally beyond a few teams. Organizations, such as Nokia, have attempted to apply behavioral metrics to hundreds of teams, sometimes to help direct coach attention to behavioral problems [sims2008]. If the organization establishes metric targets, the inherent reliance on self-reporting virtually assures questionable results. Can we find agile metrics that scale to products or businesses? Merely aggregating the agility metrics of individual teams creates a local-optimization problem. For example, an 1530-1605/15 $31.00 © 2015 IEEE DOI 10.1109/HICSS.2015.597
5038
1.1
hypotheses. “What went well? What went badly, What could we change in the coming sprint?” is the standard mantra of many Sprint Retrospectives, and in this mantra we have assessed the past experiment and proposed one or more new ones. Scrum seeks improvement. The goal of the Retrospective meeting is to identify and adopt process changes that improve the team’s production. Scrum measures production. In Scrum’s rhythmic experiment, the most common production metric is Velocity, the rate at which the team completes features. However, teams sometimes add other production metrics, such as value, customer reported bugs, test coverage, security risk, team happiness, etc. Other Scrum characteristics seem to be “discoveries” that have arisen from Scrum’s rhythmic experimentation. There are three roles in a Scrum Team. A Product Owner articulates candidate features and team activities as Product Backlog Items, and orders those items based on relative current ROI (which may incorporate the value of market learning, or building a dependency before it is needed). There are roughly 3-7 Development Team members who estimate the effort to complete Product Backlog Items during Sprint Planning Meeting, and complete the work during the Sprint. A Scrum Master facilitates team meetings, enforces team-consensus process rules and working agreements, and helps remove impediments during the Sprint. This division of labor helps Scrum Team Members focus on their roles in the experiment. Product Owners can articulate what might be produced, from a stakeholder perspective, and can work with stakeholders to find out how valuable those items are. Development Team Members can estimate the time required to complete Product Backlog Items. And Scrum Masters serve as research facilitators: controlling the experimental conditions and enforcing the process rules being examined by the Sprint experiment.
Scrum Framework
To help us better create scalable metrics, let us consider the fundamentals of Scrum as scalable concepts. Scrum is a process framework in which teams can experiment, analyze and improve production. It is not a process because many key process aspects are left open, intending that the team self-organize to establish and adapt process rules. Scrum is rhythmic. Scrum teams produce working software on a cadence. At the Scrum team level, Sprints are every-4-weeks or less. This short production cycle time helps reveal risks and constraints to the team, and challenges the team to remove them. Shorter Sprint cadences can increase Scrum’s adaptation rate, but can also cause relative production overhead—such as building, localizing, testing and releasing the software—to increase. The induced tension to reduce production overhead can help motivate important organizational changes. Scrum is experimental. Scrum teams perform a sequence of meetings that form a production experiment: A Retrospective Meeting determines the process rules to be used in the next Sprint. Teams construct the experimental hypothesis in a Retrospective Meeting: “If we change the process this way, we will improve our production that way.” For example, a team might say, “If we change our Done Criteria to require automated tests, our velocity will improve in the next Sprint,” is an experiment many Scrum teams try. Scrum for software development usually includes other ritual meetings that teams have found useful. A Sprint Planning Meeting follows the team’s current process rules to choose Product Backlog Items (PBIs) that the team intends to complete in the Sprint (once the team commits to try to complete them, PBIs become Sprint Backlog Items). Daily Scrum Meetings bring team members together to share information on yesterday’s completed work, today’s intended work, and impediments. A Sprint Review Meeting brings the team and external stakeholders together to review the Sprint Increment and consider new items that might be added to the Product Backlog. Immediately following the Sprint Review, a new Sprint begins with a Sprint Retrospective. A typical beginning of a Sprint Retrospective measures the team’s production (velocity, happiness, quality, etc.), and compares it to the
2
Metrics
Considering our basic Scrum model, what metrics reveal a team’s effectiveness? In working with large organization containing dozens or hundreds of teams, my colleagues and I have found the following metrics useful.
5039
2.1
True Sprint Length
2.2
As a business, the release rhythm of a team helps us understand its agility: What’s the likely time it will take to ship a Sprint Increment containing a Product Backlog Item recently added to the top of a Product Backlog? Most presume this is the “Sprint Length,” but there are complicating factors. Can the team actually ship every Sprint? We have found in our practice that too-often the team cannot ship in what it calls a “Sprint”. Instead some teams ship in a certain multiple of Sprints. I’ve encountered teams that followed this mini-waterfall cadence: Sprint
1
2
3
Activity
Dev
Dev
Dev
Velocity
Velocity measures work completed in a Sprint. In some teams, velocity is a count of the number of Product Backlog Items completed in a Sprint. In others, it is the sum of the estimation points a team assigned to Product Backlog Items completed in a Sprint. Teams only report the points from shippable Product Backlog Items. Velocity can be used in these ways: • To forecast when the team might complete PBIs later in the Product Backlog, in the same way that a car’s velocity supports a firstapproximation forecast for when it will reach a distant city. • To help a team plan a Sprint, taking in only the number of PBIs likely to complete (and thus helping the team focus). • Assessing the effect of process changes adopted in a previous Sprint Retrospective. To accomplish this third goal with velocity, teams must use relative estimation units rather than estimated time. [cohn2005]. • Apportioning cost for accounting purposes [gree2013].
4 Localize Test Sec. Check
What does the velocity of Sprints 1, 2 and 3 mean in this case? If the claimed Sprint Length is 2 weeks, one might assert, “The True Sprint Length is 8 weeks.” But even this optimistically assumes that all regression bugs from PBIs developed in Sprint 1 and detected in Sprint 4 can be fixed in Sprint 4. To responsibly report velocity for the four Sprints we would have to retroactively remove supposedly “completed” PBIs that failed Sprint 4 testing, and put them back in the backlog. But this is a huge, complex undertaking. I’ve never seen anyone do this, instead they effectively extend their miniwaterfall True Sprint by an extra Sprint or more to fix the bugs. And here, we have violated a timebox principle of Scrum: We don’t extend Sprints. Your head may be hurting now. Mine is. The value of reporting the True Sprint is simply this: when the True Sprint length is longer than the team’s stated Sprint Length, there’s a dysfunction. I ask mini-waterfall teams to first report and track honestly, sometimes even recommending they use an 8-week Sprint length, and work to reduce that to 4 weeks with sincerity, incorporating everything required to ship. True Sprint Length is time required for the team to assess the value, quality and market acceptance of a feature. Assuming velocity, quality and other metrics are constant, lowering True Sprint Length is better because the team can more rapidly adapt to actual production and market discoveries.
2.3
Velocity Deviation
Some managers, agile trainers and coaches state that “consistent”, “stable” or “predictable” velocity is a sign of a maturing team. Here I argue stable velocity is not necessarily good, but measuring its stability can create insight in the company and help better forecast ship dates. A metric for the magnitude of velocity inconsistency is the percent standard deviation of the velocity, σ(V)/Μ(V), where Μ(V) is the expected velocity (often approximated as the average velocity over some number of previous Sprints) and where σ(V) is the standard deviation of the velocity. We will call this the velocity deviation. This can be used to compare teams, even those with different story point scales. Many factors can contribute to high velocity deviation: unanticipated impediments and sloppy estimation are the factors these managers seek to reduce by lauding consistency. However, innovation, tackling significant impediments, trying a new process or learning new skills can also increase a team’s velocity deviation. These “good” things, which may help the team succeed, will decrease estimation accuracy and increase velocity deviation. Teams with low deviation, in my experience, are often internally dysfunctional.
5040
Imagine a team with σ(V)/Μ(V)=0. Like a fraudulent scientist forging the unruly data to fit the desired curve, someone on the team, or the team as a whole, is likely forcing production rate to fit the mean velocity, Μ(V), by padding, sandbagging or outright falsification. In environments where consistency is encouraged, even when there are no reported metrics, teams often become dysfunctional. Teams with high deviation usually have external randomizing impediments or are exploring strange new worlds (innovating). If you’re an executive or coach in a large company, and one of your teams has a high or low velocity deviation, you might want to visit them. “Can I help with an impediment?” or “What crazy thing are you people doing over here (that I might learn from)?” Finally, the standard deviation of the velocity, σ(V), can be used to more reliably forecast feature shipments. We will discuss thes further when considering Forecast Horizon.
2.4
Scrum, estimation points correlate to development cost, so when Forecast Horizon is large, Product Owners have greater visibility to make tradeoffs to increase total profit. Here are the advantages of longer Forecast Horizons • The inclusion of Epic PBIs creates a long-term vision for the product, and requiring teams to estimate Epic PBIs ensures that they know what that vision is. • Product Owners can make better tradeoffs in what the team produces. In my experience, Product Owners often misjudge the cost of a PBI (which they must implicitly estimate when ordering an otherwise unestimate Backlog Item). When teams correct that estimate, they often radically change the item’s order. • Requiring teams to rapidly estimate usually puts pressure on the Product Owner to better define the Product Backlog Items. In practice, I usually ask established teams to seek a Forecast Horizon at least 8 weeks long. To address the estimation cost, first I teach teams to perform “Bulk Estimation” [gree2013c}, where teams can easily relatively estimate 40 Backlog Items in roughly an hour. Second, I teach Product Owners to construct large Epic PBIs that have clear acceptance criteria, and counsel teams how to estimate them (usually, “faster than you might want, and with errors proportional to their size, because large PBIs will be broken down before being taken into a Sprint”). Different teams require different Forecast Horizons. For example, a service team operating Kanban-style inside Scrum (i.e., starting on new items mid-Sprint) may responsibly have a Forecast Horizon of zero. A component team that serves multiple client or business partner teams, some of which have external deadlines, will likely want a longer Forecast Horizon (to help client teams better plan).
Forecast Horizon
The Forecast Horizon is the point in the Product Backlog just before the first unestimated Product Backlog Item. We can express its value as the sum of estimation points, h, from the top of the Product Backlog to that point. If we assume a Normal distribution for velocity (a convenient assumption for this theoretical illustration, but likely wrong, since a Normal distribution gives a non-zero probability for negative velocity), and if we know the team’s estimated velocity μ(V) and standard deviation σ(V), we can express the Forecast Horizon in Sprints, h/μ(V)± σ(V)*h/μ(V) Sprints for 68% certainty or h/μ(V)± 2σ(V)*h/μ(V) for 95% certainty. If we know the Sprint Length l, we can now express the Forecast Horizon in units of time, hl/μ(V)± lσ(V)*h/μ(V). If the velocity is distributed non-Normally, Monte Carlo simulation or more complex mathematics can provide accurate distributions for the Forecast Horizon. [magi2014] Do we want Forecast Horizon to be large or small? Some argue it should be small, pointing to the time and effort required to estimate Product Backlog Items. Others argue the Forecast Horizon should be large, to give the Product Owner more data to order the backlog for highest profit. A good Product Owner seeks to order the backlog by long-term profitability, sorting items in descending order by profit = value/cost. In
2.5
Lead Time
Organizations comprising Scrum teams that can independently ship any functionality to end users produce an organizational lead time tl equal to the teams’ shortest Sprint Length. Larman and Vodde call this a “feature team organization.” [larm2008]. However, pure feature teams are rarely seen in practice in large enterprises—no team has knowledge and skill coverage sufficient to produce end-user value. In these circumstances, user-facing teams require the
5041
true sprint length, resulting in an expected Sprint lead time of 1.5 × true sprint length. Similar logic applies to all remaining teams in the dependency chain. Using this logic, we can create a minimum = dependency chain lead time, tm SUM_teams(true sprint length)*1.5. Many argued, when we proposed this metric, that it was too pessimistic. Teams actually do start working on new work midsprint, sometimes because they initiate work speculatively before their dependencies are ready. Teams sometimes produce releasable artifacts mid-Sprint. Teams can jointly decide on APIs and program in parallel. Others have argued that this model was too optimistic. Teams sometimes produce bugs, which introduce loops and concomitant delays. Inter-team delays are unaccounted for by this simplistic model. Despite these inaccuracies, this simplistic static dependency graph and its minimum dependency chain lead time metric has allowed managers to reason about organizational changes that could make the project faster. For example, by merging the Notify and Event Bus teams into two parallel “feature-ish teams” that operate from a single shared Product Backlog, and crosstraining members of those teams to be able to independently produce both Notify and Event Bus code, we can shrink the total lead time for Notify+Event Bus changes by at least 3 weeks. That 3 week improvement, since it has been performed on upstream teams, can improve the lead time for many downstream teams throughout the organization. In addition, we used this logic to improve the organizational structure with simple, localized changes to nearby teams. Anecdotally, this metric produces forecasts that have accurately predicted lead times in several real-world cases. However, we recognize further experimentation is needed.
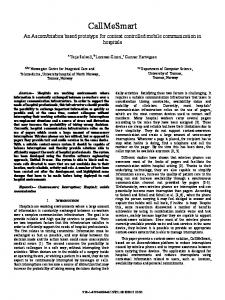
output of a chain of antecedent teams to complete a feature. Such organizations have a “component team structure.” Component team organizations can be represented by a directed graph, where infrastructure teams are antecedents to consuming teams.
Figure 1. Team dependency graph Figure 1 shows a portion of a team dependency graph for a large engineering department that produces a real-time voice and data communication tool. From this graph, we can see the following dependency chain: Base Library (2w) ≺ Event Bus (2w) ≺ Notify (2-4w) ≺ Initiation (4w) ≺ Standard Library (4w) ≺ Backend (2w) Each node of the dependency chain represents a team. The number of weeks in a Sprint is noted in each node. When a range is listed, such as 2-4w, the team has stated it has 2 week Sprints, but we have discovered that the team requires 4 weeks to produce a shippingquality product. (In short, the True Sprint Length is 4 weeks.) The shortest time required to propagate a change made by the Base Library team, assuming a precedent team’s Sprint end immediately precedes a dependent team’s Sprint beginning, is the sum of the True Sprint Lengths of each team in the dependency chain. However, most agile organizations (including this one) have unsynchronized Sprints, if for no other reason than meeting room and attendance conflicts discourage synchronization. Assuming that Sprints start times are uniformly distributed, we can model unsynchronized Sprints by simply multiplying the sum of the Sprint times by 1.5. For example, when a stakeholder requests a change, Base Library could be at any point in a Sprint. Scrum rules prevent the team from satisfying new requests until the next Sprint Planning, so, on average, the request will not be started for 0.5 ×
2.6
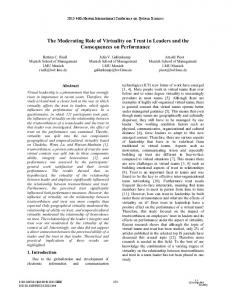
Downstream Impact
Although agilists generally prefer “feature team” organizational structures [larm2008], few large organizations are free of component teams. In these environments, “downstream teams” may require contributions from “upstream teams.” The number of downstream teams an upstream team serves provides a rough impact metric for bugs and delays produced by the upstream team.
5042
5.
6.
7.
metric-based target outcome from using the strategy. Coach records the problem, the targeted cause, the current measurement, the target metric. Coach and team apply the strategy and report intermediate results to management, in metric form. Coach and team terminate the coaching engagement when the target outcome is reached.
Figure 2. Dependency count Figure 2 shows an example where Standard Library has an immediate dependent count of 15. Bugs and delays impact immediate dependents first. A second impact metric is the total dependent count, which is the count of teams in the union of all dependent teams, immediate or otherwise. This metric measures potential inefficiencies introduced by a team on its dependents. A third impact metric is the critical path dependent count. This counts the number of dependent teams in a critical path that are downstream. This metric can be used to focus coaching efforts on the teams whose improvement is most likely to contribute to organizational improvement.
We applied this metric-driven coaching approach, and reported on it quarterly to upper management. It made coaches more rigorous in identifying problems and mitigations, and the quarterly reports helped upper management better understand the contributions made by coaches. Upper management increased their support for agile coaching while this reporting structure was in place. This work cannot claim the statistical rigor of controlled studies. As practitioners, our primary goal was to ship products. In arriving at these metrics and approximations, we sought to measure something that seemed likely to correlate with good results. We present this work perhaps to inspire further research in agile metrics and their potential benefit.
3
4
Coaching with Metrics
In two companies, I led agile coach teams, comprised not of ScrumMasters, but rather of coaches who helped ScrumMasters, Product Owners and teams improve. In each company, I was asked, “What do you people do, and is agile worth the effort and money required to maintain it?” I created a metric-driven coaching process to address this question. Here’s how the process works: 1. A coach and one or more members of the team meet to discuss a problem raised by the team or a stakeholder. 2. Coach and team work together to create a five-whys root cause map. 3. Coach and team mutually pick a cause, and identify a metric that should be improved if the team mitigates the cause. 4. Coach and team measure the team’s current performance with the metric, chooses a strategy to improve the performance, and hypothesizes a
Conclusion
I have described several agile metrics in a scalable Scrum framework: Velocity, Velocity Deviation, Forecast Horizon, True Sprint Length, Lead Time (including a few variants, but particularly minimum dependency chain lead time), and Dependency Count (also including a few variants). I discussed how these metrics have provided the basis for coaching reports to show how coaches improve teams. Further research efforts on these topics could include surveying teams on the impact of improving different metrics. We have discussed anecdotal and qualitative outcomes we think correlate with quantitative improvements. However, we are too early in our research to make definitive conclusions. We hope these metric explorations inspire others (as well as ourselves) to dig deeper.
5043
5
References
[blan2008]
[busc2011]
[char2005]
[cohn2005]
[gree2010]
[gree2012]
[gree2013a]
[gree2013b]
[knib2010]
[larm2008]
Steve Blank, Four Steps to the Epiphany, Cafepress.com (Feb 1, 2005). ISBN 978-0976470700. Frank Buschmann, To Pay or Not to Pay Technical Debt, IEEE Software, November/December 2011 (Vol. 28, No. 6) pp. 29-31. Robert N. Charette,"Why software fails," Spectrum, IEEE , vol.42, no.9, pp. 42- 49, Sept. 2005, doi: 10.1109/MSPEC.2005.1502528, http://ieeexplore.ieee.org/stamp/sta mp.jsp?tp=&arnumber=1502528&i snumber=32236 Mike Cohn, Agile Estimating and Planning, ISBN 978-0131479418, Prentice-Hall 2005. Daniel Greening, “Enterprise Scrum: Scaling Scrum to the Enterprise Level,” 2010 43rd Hawaii International Conference on System Sciences (HICSS), Hawaii January 5-8, ISBN: 978-0-76953869-3 (10 pages), http://www.computer.org/plugins/d l/pdf/proceedings/hicss/2010/3869/ 00/10-01-01.pdf Daniel Greening, “Bulk Estimation,” 2012, http://senexrex.com/rapid-scrumestimation/. Daniel Greening, “Enterprise Agility and Release Duration,” 2013 46th Hawaii International Conference on System Sciences (HICSS), Hawaii January 7–10. Daniel Greening, “Why should agilists care about capitalization?” InfoQ, http://www.infoq.com/articles/agile -capitalization (Jan 29, 2013). Henrik Kniberg, Scrum Checklist, version 2.10, https://dl.dropboxusercontent.com/ u/1018963/ScrumChecklist/Scrum-checklist.pdf. Craig Larman and Bas Vodde, Scaling Lean & Agile Development: Thinking and Organizational Tools for LargeScale Scrum, ISBN 9780321480965, Addison-Wesley 2008.
[magi2014] Troy Magennis, Personal communication. [ries2011] Eric Ries, The Lean Startup, Crown Business (September 13, 2011), ISBN 978-0307887894. [vodd2005] Bas Vodde, The Nokia Test, extended with scoring by Jeff Sutherland, 2005, http://www.cedur.se/nokia_test2.ht ml. [larm2010] Craig Larman and Bas Vodde, “Scaling Lean & Agile Development: Thinking and Organizational Tools for LargeScale Scrum,” Addison-Wesley Professional, 2008.
5044