2013 46th Hawaii International Conference on System Sciences
Agile practices to accelerate the delivery of software: a quantitative study with software professionals Adriano Olímpio Tonelli Universidade Federal de Lavras
[email protected]
Paulo Henrique S. Bermejo Universidade Federal de Lavras Bentley Univerity
[email protected]
Mariana Azevedo Santos Mitah Technologies
[email protected]
André Luiz Zambalde Universidade Federal de Lavras
[email protected]
Marcelo Silva de Oliveira Universidade Federal de Lavras
[email protected]
Luiz Marcelo Antonialli Universidade Federal de Lavras
[email protected]
Abstract This study aims to investigate the perceptions of software professionals in relation with impact of agile practices to accelerate the delivery of software products. Quantitative data obtained from a sample of 109 professionals were collected and analyzed by Pearson correlation and factor analysis. The results of factor analysis showed that the perception of professionals in relation to agile practices can be grouped into seven factors. From the correlation analysis, it was observed that customer satisfaction is the main variable influencing the perceptions of professionals regarding the use of agile practices to meet the deadlines on software projects.
1. Introduction The question of how best to organize software development to ensure rapid product delivery has been debated for decades [1]. These debates reflect the complexity of software development and the consequent difficulty that companies face in improving their ability to swiftly deliver solutions to customers. According to research by the Standish Group [2], about 63% of software development projects had deficiencies in meeting deadlines, budget, or quality benchmarks. In the face of these continuing challenges to productivity, an increasing number of software companies have been seeking alternative models that will improve the efficiency of development and increase the speed of delivery [3]. Elaborated in the 2000s following the declaration of the Agile Manifesto [4], agile methodologies are based on principles fundamentally different from traditional approaches to software development. Specifically, these principles emphasize (1) individuals and interactions over processes and tools, (2) working software over comprehensive documentation, (3) 1530-1605/12 $26.00 © 2012 IEEE DOI 10.1109/HICSS.2013.75
customer collaboration over contract negotiation, and (4) responding to change over following a plan [4]. While traditional software development models emphasize documentation and sequential processes based on requirements elicitation, architecture development, coding, and testing, agile methodologies emphasize iterative development and conceptual simplicity to allow developers to create products quickly and with heavy interaction with customers [1, 5, 6]. Given the nimbleness that its principles allow, agile methodologies have garnered increasing interest from companies seeking to improve product delivery and quality and to identify solutions to problems associated with constant changes in requirements, fixed-date releases, lack of customer feedback, and fixed budgets [1, 7, 8]. With the growing adoption of agile methodologies in the market, there have been an increasing research interest in agile software development. Numerous studies have focused on factors influencing the successful adoption of agile methodologies, including shared experiences among team members [6, 9], toplevel management support [10], team autonomy and diversity [11], self-discipline in individual team members [10], team member communication [6, 12], the utility of documentation [6]. Other studies have analyzed social factors related to agile software development, such as organizational culture [6, 12] and team characteristics [12–14]. Still others have studied practitioners’ perceptions of specific agile practices, predominantly XP practices [7, 15–17]. However, although increasingly examined in the literature, the concept of agile software development is still insufficiently understood, especially regarding the outcomes of agile practices [6, 9, 18] and how firms can control and influence agile development [11]. Most studies employ experiential, anecdotal, or case study 4769 4771
design [1, 9], with a few exceptions (e.g., Misra, Kumar, and Kumar [9]; and Lee and Xia [11]), quantitative research based on large-scale surveys are scant. Furthermore, most of the available studies focus on a single agile methodology, generally on XP or Scrum [1]. The literature lacks studies that consider a broader spectrum of agile methodologies. This gap is critical because agile practices are not always adopted discretely: based on the needs of a specific organization, a variety of practices from different agile methodologies may be mixed the practices to create hybrid approaches [9, 18, 19]. In light of this lacuna in the existing literature, the present study seeks to examine two questions; (1) which agile practices contribute to improving the ability of organizations to accelerate the software product delivery? And (2) what influences the professional’s perception of the contribution of agile practices to accelerated the software product delivery? This study investigates these questions through quantitative, survey-based research. The paper provides empirical evidence on how to combine and apply different agile practices. In doing so, this work seeks to expand the knowledge about the application of different agile practices from different methodologies to enhance the agility in the delivery of software products.
evaluate 3 or more practices that they were using at the time or had used in the past. This precaution was taken to prevent flawed and inconsistent responses. The agile practices included in the questionnaire were derived from the practices identified by Santos et al. [20] as most relevant in the marketplace. Table 1 lists the practices included in this study.
2.2. Data analysis Factor analysis using Varimax orthogonal rotation [21] was conducted to identify the structure underlying sets of practices that impact the accelerated delivery of software products. Only practices with loads above 0.55 were included in the factors. The Kaiser–Meyer– Olkin (KMO) latent root and Bartlett’s test of sphericity [21, 22] were used to test validity. Included practices were also restricted to those with more than 35 responses to eliminate practices insignificant to this study. To determine the factors that influence professionals’ perceptions of the impact of agile practices on the speed of software product delivery, we used Pearson correlation analysis. According to Malhotra and Birks [22], Pearson correlation is widely used to summarize the strength of association between two metric variables. Data relating to the perceived impact of agile practices on product delivery speed were correlated with four variables: stage of adoption of agile practices, time of adoption, customer satisfaction for products delivered, and team satisfaction with the agile practices. The correlations were analyzed considering significance levels of 0.05 and 0.01.
2. Methodology 2.1. Sampling and data collection This quantitative study conducted a survey of 109 professionals engaged in different aspects of the software development process. Two types of sampling were used to select the participants: expert sampling and geometrical, or snowball, sampling [23]. The use of these sampling methods is justified because the study required the participation of (i) specialists or individuals with an expertise in software development and (ii) hard-to-reach individuals with characteristics compatible with the research objectives. Such participants are usually best identified by individuals in personal or professional networks and unknown by the researcher. A structured questionnaire was made available on the web tool Survey Monkey, and data were collected between January and May 2011. The questionnaire contained 59 questions: 2 questions related to demographics and 57 questions related to an equal number of agile practices. For the latter, we used a 6point Likert scale ranging from “very low” to “very high” to assess of participants’ perceptions of the impact of the practices on software product delivery. Of the 57 practices, the participants were asked to
2.3. Description of variables Considering the perception that practitioners have about agile practices, this research was based on the following groups of variables: Perception of agile practices – This set of variables assessed, on a 6-point scale, the participants’ perception of the agile practice’s positive contribution to accelerated software delivery. 51 practices were identified (Table 1) from a review of the main Agile Methodologies available in the market. . Satisfaction – this group includes variables related to customer satisfaction and team satisfaction. Customer satisfaction is the professional’s perception of customer satisfaction with the speed of product delivery. This was measured on a 6-point scale (very low, low, regular, fair, high, very high). Team satisfaction measures the level of team members’ satisfaction with the speed in delivery. This variable
4772 4770
was also measured on a 6-point scale (very low, low, regular, fair, high, very high). Adoption of agile practices – This group includes variables related to the time since adoption and the stage of implementation of agile practices in the organization. Time since adoption considered the time (in months) that the professional’s organization has
employed agile practices. Stage of implementation at the professional’s present company was measured using the Capability Maturity Model (CMMI) [23] based on a 4-point scale: (1) initial, (2) partially implemented, (3) implemented without measurements, and (4) implemented with measurement and continuous improvement.
Missing data analysis Missing
Practice N 90 59 43 53 46 43 28 33
Count 19 50 66 56 63 66 81 76
Percent 17.4 45.9 60.6 51.4 57.8 60.6 74.3 69.7
Small teams in large staffs
30
79
72.5
Daily meeting Stand-up meeting Iteration planning meeting Retrospective Product backlog
53 63 61 50 50
56 46 48 59 59
51.4 42.2 44.0 54.1 54.1
Customer onsite Use cases Scenarios
59 47 31
50 62 78
45.9 56.9 71.6
Vision document Evocative document
40 22
69 87
63.3 79.8
User story Architectural spike Domain model Business objective
46 23 25 29
63 86 84 80
57.8 78.9 77.1 73.4
UML diagrams Refactoring Pair programming
42 44 37
67 65 72
61.5 59.6 66.1
Small teams Multifunctional teams Solo programmer Product owner Scrum master Leader developer Features teams Parallel teams
Missing
Practice Code ownership Build 10 minutes
N 32 17
Class ownership
13
96
88.1
Screening bugs Configuration management Test last develop Test first develop
41 24 23 21
68 85 86 88
62.4 78.0 78.9 80.7
Functional test Test cases
46 32
63 77
57.8 70.6
Unit test Test automation Methodology refining
41 33 10
68 76 99
62.4 69.7 90.8
Continuous integration Fixed iterations Burn down chart
36 49 34
73 60 75
67.0 55.0 68.8
Kanban Planning games Velocity Features estimative Mission estimative
52 32 26 33 12
57 77 83 76 97
52.3 70.6 76.1 69.7 89.0
Progress report Checklist Parking lot
22 25 9
87 84 100
79.8 77.1 91.7
Potentially shippable Agile coach
43 21
66 88
60.6 80.7
Table 1 Missing data analysis
4773 4771
Count Percent 77 70.6 92 84.4
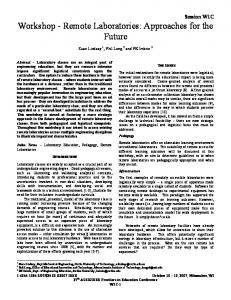
Figure 1 Profile of professionals participants of the research
3. Results Following the analysis of missing data and responses frequency of each practice, the method Kaiser–Meyer–Olkin (KMO) and Bartlett’s sphericity test were executed. As illustrated in Table 2, the KMO index was 0.784. According Hair et al. [21], this can be considered median and validates the factorial analysis for the set of research data. In relation to sphericity test, significance less than 0.001 indicate that the correlation matrix is not identity, and then, is suitable for the application of factorial analysis.
3.1. Sample profile Analysis of the survey data revealed that participants were predominantly project managers (27.5%), technical leaders (11.0%), and project leaders (10.1%). There was no incidence of customer participation, although this class of stakeholder was included in the questionnaire Figure 1 illustrates the participants’ occupations .
3.2. Validity and reliability
Kaiser-Meyer-Olkin measure of sampling adequacy Bartlett’s test of sphericity
As a first step in data validation, variables with fewer participant evaluations were removed prior to factor analysis in order to obtain more representative samples. Only practices with 35 or more assessments were considered in factor analysis. Table 1 represents the frequencies and the missing data of participant assessments for each of the practices considered in the study. The practices considered for factor analysis, with frequencies greater than 35, are shown in bold.
df Sig.
.784 -5.351 325 0.000
Table 2 KMO method and Bartlett’s sphericity test result for the research
4774 4772
Factors
Practices Fixed iterations
1 .644
Kanban
.682
Potentially shippable
.688
Screening bugs
.705
2
3
Development guide by test
.804
Unit tests
.730
Continuous integration
.649
Multifunctional teams
.817
Product owner
.562
Leader developer Customer on-site
.677 .623
4
Iteration planning meeting
.699
Retrospective
.692
User story
.682
5
Use cases
.812
Vision document
.646
6
Scrum master
.732
UML diagrams
.587
Solo programmer
7
8
.814
Product backlog
.786
Functional tests
.582
Table 3 Extracted factors
3.3. Factor analysis Factor 2 – Development guide by test/Test-driven development with instant feedback. The second factor clusters test-driven development practices and instant feedback. We could explain this factor as: the team writes test cases and code and perform unit tests; when the code passes the test, they continuously integrated all codification, helping to reduce development efforts on sprint overall [24]. Factor 3 – Building agile teams. Practices grouped by this factor are multifunctional teams, product owner, leader programmer, and customer on-site. The third factor represents the customer involvement with the team on development. In line with previous studies [6, 9, 18] the involvement of the customer could be of help to the team to focus on customer needs, diagnosing problematic situations, while the product owner writes customer-centric items, thereby making the team’s work more effective and productive. Factor 4 – Requirements organization and evaluation. Practices grouped by this factor are user story, iteration planning meeting, and retrospective.
Using factor analysis, eight factors were extracted from the data, explaining 66.097% of the variance. According Hair et al. [21] identify this as an acceptable parameter for adaptation to the technique applied. Table 3 shows the practices classified into each of the eight factors extracted. Factor 1 – Bug correction and tasks on sprint. The first factor includes practices related to partial deliveries and named releases. The practices of Kanban, screening errors, fixed iterations, and potentially shippable are significantly correlated and can be grouped in order to explain the professionals’ perception of these practices’ contribution to timely project delivery. This factor could be explained by the following: planning sprints with bug correction could contribute in a better planned release, ensuring the potentially shippable product’s delivery thereby avoid unnecessary refactoring in the future.
4775 4773
software projects. Projects are based on releases to the customer, with potentially shippable product delivery (Factor 1). In each release, teams write tests and code them, providing continuous integration to gradually form a complete software product to be delivered (Factor 2). These tests can be conducted from a priorities list, known as a product backlog, whose items are tested using functional tests (Factor 8). In the project, teams are multifunctional and rely upon the active and continuous participation of the customer (Factor 3). In this way, requirements are developed based on customer’s narratives, known as user story, on planning meetings. The project documentation is lean and easy to understand, emphasizing the characteristics of focus on development highlighted by agile methodologies (Factor 5). Specifications used in projects are based on UML resources, which helps communication between the scrum master and team members (Factor 6). Finally, the development is driven from the solo developer approach, in which a team member is responsible for implementing user story and continuously integrating with the team’s work (Factor 7). Subsequently, the implementation of these user stories is reviewed and all facts (negative and positive) experienced in developing are identified at a retrospective meeting, to be improved in the project (Factor 4).
Using user stories to detail the customer’s requirements, in addition with a product backlog in the planning meeting, could improve the understanding of the task during the sprint. So, the combination of user story and product backlog can contribute to reduce team’s inefficiency, and, consequently, to the risk of missed deadlines. Also, this could avoid the some negative experiences on retrospective meeting, for example, bad estimates based on bad information. Factor 5 – Documentation. Practices addressed in this factor were use cases and vision document. The fifth factor is related to a project’s documentary elaboration. The vision document, in negotiation phase, elucidates to the customer how the developed system and final product works. The vision document could be helpful in the domain analysis, once this document can feasibly implement the use cases practice in its structure. Factor 6 – Design using diagrams. This factor encompasses practices related to the leadership of the scrum master and to UML diagrams. The factor indicates that developers participating in this study may still use UML in their agile projects. This could be helpful to scrum masters and team members for communication in a standardized manner, without compromising the project’s scheduled delivery through a misunderstanding, especially if the teams are technologically non-homogenized. Factor 7 – Solo developer. The seventh factor indicates that research participants perceived that solo programming can contribute to productivity and timely delivery. Factor 8 – Functional tests on backlog items. Practices contemplated in this factor are functional tests and product backlog (priorities list). The eighth factor includes test cases created to measure the functional quality of the backlog items. Because the tests are estimated and made by tasks, deadlines are not compromised, they can still help to identify specific failures of user stories. The extracted factors describe combinations of agile practices that, in the perception of practitioners, are correlated with an impact on the timely delivery of software products. From these results, we can construct a scenario of using agile practices with a focus on timely delivery of
3.4. Correlation analysis From the correlation analysis of the variables having perceived value to agile practices with the four variables, team satisfaction, customer satisfaction, time since adoption, and stage of implementation, we found that in most cases, the variable with perceived relation to agile practices is correlated with at least with one of the variables related to satisfaction, adoption time and stage of adoption. Exceptions were: product owner, features teams, parallel teams, small teams in large staff, daily meetings, product backlog, use cases, scenarios, evocative document, diagrams UML, refactoring, 10 minutes builds, and configuration management. Table 5 illustrates the correlation matrix.
4776 4774
Practice
Satisfaction Customer satisfaction
Adoption time
Team satisfaction
Adoption time
Adoption stage
Small teams
.247*
.239*
.358**
.144
Multifunctional teams
.354**
.395**
.247
.257*
Solo programmer
.143
.120
.327*
.114
Product owner
.269
.105
.115
.226
Scrum master
.302*
.128
−.047
−.085
Leader developer
.273
.228
.157
Features teams
−.083
.014
−.101
−.158
Parallel teams
−.027
.252
−.050
.031
Small teams
.330
.130
.267
.290
Daily meeting
.242
.195
−.139
.040
Stand−up meeting
.281*
.250*
.137
.253*
Iteration planning meeting
.289*
.027
.186
.160
Retrospective
.417**
.099
.043
.165
Product backlog
.162
.141
.081
−.020
Customer onsite
.382**
.260*
−.073
.102
Use cases
.183
.078
−.031
.159
Scenarios
.270
.08
−.052
.156
Vision document
.384*
.099
−.066
.353*
Evocative document
.290
.085
−.050
.239
User story
.493**
.163
−.096
.195
Architectural spike
.405
.160
.470*
.458*
Domain model
.553**
.397*
.358
.205
Business objective
.541**
.452*
.112
.241
UML diagrams
.278
.222
−.046
−.129
Refactoring
.209
−.072
.131
.213
Pair programming
.444**
.210
.084
.199
Code ownership
.583**
.409*
.141
.360*
Build 10 minutes
.467
.204
.243
.425
Class ownership
.182
.113
.124
.048
Screening bugs
.313*
.250
.152
.200
Configuration management
.241
.228
.243
.060
.305*
* Significant at .05 (2-tailed) ** Significant at .01 (2-tailed) Table 4. Correlation matrix between perceptions of agile practices and stage of adoption, adoption time, customer satisfaction and team satisfaction. The data indicate that customer satisfaction is variable that most influenced the perception professionals about agile practices. Thus, to accepted and have positive perceptions
the of be by
professionals, it is essential that the use of agile practices has to be able to generate results that positively impact customer satisfaction.
4777 4775
professionals in software organizations. In addition, these results suggest that customer satisfaction is an important variable in the development of frameworks for explaining the relationship between the use of agile practices and the swiftness of software product releases. From a managerial perspective, the main contribution of this study is to suggest that the eight factors extracted by factor analysis and relevant agile practices can together develop agility in the delivery of software products. Furthermore, from correlation analysis, this study provides insight on the factors—customer satisfaction, team satisfaction, time since adoption, and implementation stage—that influence the professionals’ perceptions of the results of agile practices From a researcher’s perspective, the factors provide initial concepts from which to develop models that can be used to apply techniques, such as Structural Equation Modeling, to develop and test theoretical frameworks that correlate the use of agile practices and agility in software development.
Secondly, it is observed that team satisfaction influences most practices associated the team’s organization and interactions between professionals. Small teams, multifunctional teams, stand-up meetings, customer on-site, and collective ownership of code are correlated with team satisfaction. Although it has low correlation with the number of agile practices, the time since adoption had the highest correlation with the perception of professionals in small teams, solo programmer, and spike architecture. This can be evidence that, to generate positive results, such practices need time to be embraced by an organization. This finding is observed in particular with spike architecture, because the perception of this practice presents significant and positive correlations exclusively with time since adoption and implementation stage.
4. Conclusion This study sought to investigate the perceptions of software professionals in relation with impact of agile practices to accelerate the delivery of software products. Specifically, the study examined two fundamental questions about the application of agile practices: (1) which agile practices can contribute to improving the ability of organizations to accelerate the delivery of software products? (2) What influences the professional’s perception of the contribution of agile practices to accelerated software product delivery? Considering the first question, the results of factor analysis indicated that an approach in which sets of agile practices are selected rather that a methodology embraced completely can be a path to the appropriate adoption of an agile approach to software development. The eight factors produced from the analysis reveal the relationships of a set of manifest variables (perceptions of professionals regarding the use of practices included in the different agile methodologies) with a smaller number of latent variables (factors) that explain the professionals’ perceptions regarding the use of agile practices to agility on delivery of software products. From these factors, future studies will be able to develop frameworks that explain the relationship between the use of agile practices and the agility of software products releases. Regarding the second question, the results of correlation analysis indicated that customer satisfaction is the main determinant of the professionals’ perception of the impact of agile practices on ability to meet project deadlines. Thus, these results suggest that customer satisfaction can be a determining factor for the continued acceptance and use of agile practices by
5. Limitations This paper presents two limitations that should be considered when interpreting and applying the results. First, the results are based upon a study with a limited sample, which prevents the generalization of the results obtained. Thus, it is important that these results will be interpreted as recommendations. Future studies which should perform further investigations to confirm or refute the software professionals’ perceptions revealed in this study. In addition, this study was based on quantitative data and thus does not deepen our understanding of how and why agile practices contribute to agile software development. Given this limitation, future studies can investigate the use of such practices and their relationship to the ability to deliver projects into the deadline.
Acknowledgements The authors thank FAPEMIG (The Minas Gerais State Research Foundation), CAPES (Coordination for the Improvement of Higher Level or EducationPersonnel Process BEX 1588/11-7), and CNPq (National Counsel of Technological and Scientific Development) for their financial support.
6. References
4778 4776
[1].
[2]. [3].
[4]. [5].
[6].
[7].
[8].
[9].
[10].
[11].
[12].
[13].
[14]. [15].
[16].
Dybå, T. and T. Dingsøyr, Empirical studies of agile software development: A systematic review. Information and Software Technology, 2008. 50(9– 10): p. 833–859. Group, S., New Standish Group report shows more project failing and less successful projects. 2009. Koscianski, A. and M.S. Soares, Qualidade de software: Aprenda as metodologias e técnicas mais modernas para o desenvolvimento de software. 2nd ed. 2007. Beck, K., et al. Agile manifesto. 2001; Available from: http://www.agilemanifesto.org/. Cao, L., et al., Framework for adapting agile development methodologies. European Journal of Information Systems, 2009. 18: p. 332–343. Lindvall, M., et al., Empirical findings in agile methods, in Extreme Programming and Agile Methods — XP/Agile Universe 2002, D. Wells and L. Williams, Editors. 2002, Springer: Berlin / Heidelberg. p. 81–92. Mann, C. and F. Maurer, A case study on the impact of scrum on overtime and customer satisfaction, in Agile Development Conference. 2005, IEEE Computer Society: Washington DC. p. 70–79. Nerur, S., R. Mahapatra, and G. Mangalara, Challenges of migrating to agile methodologies. Communication of the ACM, 2005. 48(5): p. 72– 78. Misra, S.C., V. Kumar, and U. Kumar, Identifying some important success factors in adopting agile software development practices. Journal of Systems and Software, 2009. 82(11): p. 1869– 1890. Jiangping, W., L. Weiping, and W. Xiaoyao. Case study on critical success factors of agile software process improvement, in Business Management and Electronic Information (BMEI), 2011 International Conference on. 2011. Lee, G. and W. Xia, Toward agile: an integrated analysis of quantitative and qualitative field data. MIS Q., 2010. 34(1): p. 87–114. Robinson, H. and H. Sharp, The characteristics of XP teams, in Extreme Programming and Agile Processes in Software Engineering, J. Eckstein and H. Baumeister, Editors. 2004, Springer: Berlin / Heidelberg. p. 139–147. MacKenzie, A. and S. Monk, From cards to code: How extreme programming re-embodies programming as a collective practice. Computer Supported Cooperative Work (CSCW), 2004. 13(1): p. 91–117. Sharp, H. and H. Robinson, An ethnographic study of XP practice. Empirical Software Engineering, 2004. 9(4): p. 353–375. Koskela, J. and P. Abrahamsson, On-Site Customer in an XP Project: Empirical Results from a Case Study T. Dingsøyr, Editor. 2004, Springer: Berlin / Heidelberg. p. 1–11.
[17].
[18].
[19].
[20].
[21]. [22].
[23]. [24].
4779 4777
Martin, A., R. Biddle, and J. Noble. The XP customer role in practice: three studies, in Agile Development Conference, 2004. 2004. Melnik, G. and F. Maurer, Perceptions of agile practices: A student survey, in Extreme Programming and Agile Methods — XP/Agile Universe 2002, D. Wells and L. Williams, Editors. 2002, Springer Berlin / Heidelberg. p. 103–113. Chow, T. and D.-B. Cao, A survey study of critical success factors in agile software projects. Journal of Systems and Software, 2008. 81(6): p. 961–971. Geras, A., M. Smith, and J. Miller, Configuring hybrid agile-traditional software processes, in Extreme Programming and Agile Processes in Software Engineering, Proceedings, P. Abrahamsson, M. Marchesi, and G. Succi, Editors. 2006, Springer-Verlag Berlin: Berlin. p. 104–113. Santos, M.A., et al., Agile practices: An assessment of perception of value of professionals on the quality criteria in performance of projects. A Journal of Software Engineering and Applications, 2011. 4: p. 700–709. Hair, J.F., et al., Análise multivariada de dados. 2009, Porto Alegre: Artmed. Malhotra, N.K. and D.F. Birks, Marketing research: An applied approach. 2007, London: Prentice Hall. Team, C.P., CMMI for Development Version 1.2. 2006, Pittsburgh: Software Engineering Institute. Gupta, A. and P. Jalote, An experimental evaluation of the effectiveness and efficiency of the test driven development, in First International Symposium on Empirical Software Engineering and Measurement (ESEM ’07). 2007, IEEE Computer Society: Washington, DC. p. 285–294.