Springer India 2013. Test Case ... Rayagada - 765017, Odisha, India. {abi.tripathy ... In a typical software development project, more than 50% of the software.
Test Case Generation Using Activity Diagram and Sequence Diagram Abinash Tripathy and Anirban Mitra Department of CSE & IT, M.I.T.S., Rayagada - 765017, Odisha, India {abi.tripathy,anir.mitra}@gmail.com
Abstract. In this paper, we present an approach to generate test cases by usingtogether the UML activity diagram and the sequence diagram. Our approach consists of transforming the sequence diagram into a graph called Sequence Graph (SG) and transforming the activity diagram to the Activity Graph (AG). Henceforth, System Graph (SYG) is formed by integrating the two graphs i.e. SG and AG. The SYG is then traversed to form the test cases. We have used DFS (Depth First Search) method as a Graph Optimization technique .for traversing the SYG.It was observed that the test cases obtained from this method is not only exhaustive but also optimized. The test case thus generated is suitable for system testing and detect the operational, interact and, scenario faults.Our approach is also capable of handling the state explosion problem in case of concurrent systems. Keywords: Sequence Graph, Activity Graph, System Graph, DFS.
1 Introduction In a typical software development project, more than 50% of the software development is being spent on testing in terms of time as well as finance [1]. As the complexity and size of software grow, the time required to carry out the process of testing also increases. Manual testing is time-consuming and error-prone. Therefore, automated testing processes are more preferred. The process of testing effort can be divided into three parts: test case generation, test execution and test evolution. The latter two parts are relatively easy to implement provided the proper passing condition is provided. However, the first part, i.e. to determine the test cases generation requires knowledge up to certain level. UML is known as the language for creating Models. UML provides life-cycle support in software development and is widely used to describe analysis and design specifications of software [2]. It is a big challenge to study the test case generation from UML diagram. An activity diagram shows the flow of activity in a system. An activity is an ongoing non atomic execution in some action. Activity ultimately results in some action. Action encompasses calling another operation, sending signal, creating and destroying objects. Graphically, an activity diagram is a collection of vertices and arcs [3].The Figure 1 (a) shows the activity diagram for the card validation in ATM transaction. On the other hand a sequence diagram is an Aswatha Kumar M. et al. (Eds.): Proceedings of ICAdC, AISC 174, pp. 121–129. © Springer India 2013 springerlink.com
122
A. Tripathy and A. Mitra
interaction diagram that emphasizes the time ordering of messages. Graphically, a sequence diagram is a table that shows objects arranged along the X axis and messages, ordered in increasing time, along Y axis. Figure 2 (a) shows the sequence diagram for card validation. In this paper, we proposed the test case generation from UML diagrams. We use sequence diagram and activity diagram as sources of test case generation. Then by using an optimization technique DFS, we try to optimize the test case that is generated in respect to the number of test cases. Our generated test suite aims to cover various interaction faults, scenario faults and operational faults. The rest of the paper is organized as follows. In Section 2, we discuss the existing work done on test generation techniques using different UML diagrams. In Section 3, we discuss how we generate the graph from the respective UML diagrams and also propose an algorithm that generates a system Graph(SYG) by integrating both graphs. In Section 4, we present generation of test cases from SYG using the optimization technique DFS. In Section 5 we give a snapshot of the test case generated using the proposed algorithm on the given example. Finally, in Section 6 we conclude the paper with an inside to the future work.
2 Related Work In this section, we survey the different test case generation technique using different UML diagrams. Mall et.al [4] proposed an algorithm to generate test cases from a combination of use case and sequence diagrams. First, they convert the use case diagram in to use case diagram graph (UDG) and the sequence diagram in to Sequence Diagram Graph (SDG). Then by integrating the SDG and UDG, they generate system testing graph (STG). In the algorithm for UDG, there have mentioned that there is an edge from the use case diagram to the sequence diagram, but when the edge comes it is not clearly mentioned in the paper. Wang et al [5] proposed a method to generate the test cases from activity diagram. In this paper, another diagram called IOAD (input/output explicit Activity Diagram) is generated from activity diagram. In the IOAD diagram only the external elements i.e. send and accept signals are represented. The non-external inputs and outputs are suppressed and the data objects like invoice and order are dropped as these objects are implicit tasks. As these fields are dropped this method does not convey the total information to the programmer, they take it as an abstract view.
3 Proposed Approach In our proposed algorithm we convert the system under test into a graph called System Graph (SYG) which is an integration of activity graph and sequence graph. We first transform sequence diagram (SD) graph into a sequence graph (SG) [4], the activity diagram (AD) into activity graph (AG) [9] and then integrate the SG and AG to form SYG. Next, we generate the test cases by using the System Graph. In the following section, we discuss the different steps of our approach.
Test Case Gen neration Using Activity Diagram and Sequence Diagram
123
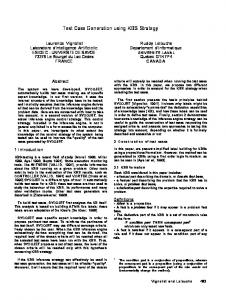
3.1 Transformation of AD D into AG In this section first we present, the definition of activity graph (AG). Then we disccuss the methodology to generatte AG from AD. Definition 1: Activity Grraph:The activity graph (AG) is defined asAG={ A, T, F, C, V, ai, af }, where A= a finite set of activity y states, T= a finite set of completion transactions, C=aa set of guard condition, and Ci is i the corresponding transaction ti, F (A X T X C)∪(A AX T X C) is the flow relatio onship between activities and transaction.V= a condittion which depend upon previous node which contain a condition. The content is nulll if previous node has no condiition and 1 if the activity is the successful for the previious condition and 0 if it is unssuccessful.ai∈ A, is the initial activity state. af∈ A, is the final activity state. In the activity a diagram, at any time its current state (denotedd by CS) is represented by a set of o activity states. Now, we discuss the transformation of AD to AG. Each activity in the activvity diagram can be mapped ass a node. A directed edge from a node Ai to Ajis usedd to represent the sequential deependency of Ai on Aj.. Figure1 (a) shows the AD for the card validation in an ATM A transaction and the corresponding AG is shownn in Figure1 ( b).
Fig. 1 (a). Activity Diag gram for card validation in ATM Transaction n
Fig. 1(b). Activity Graph for the Actiivity Diagram in figure 1(a)
3.2 Transformation of a SD into a SG In this section we first preesent, the definition of the sequence graph (SG). Then we present the methodology to generate the SG from SD Definition 2: sequence grraph SG: The sequence graph (SG) is defined as: SG G = {State, Edge, First, Last}, whereState set of all the nodes representing various staates of a scenario.Edge set of edges representing transaction between differrent ode representing the starting state.Lastis the final nnode states.Firstis the initial no representing the final state. In order to formulate a method, m we define a scenario as a quadruple Scenario: < Id, Start State, message, Succcessful / Unsuccessful> .Id is a unique number usedd to
124
A. Tripathy and A. Mitra M
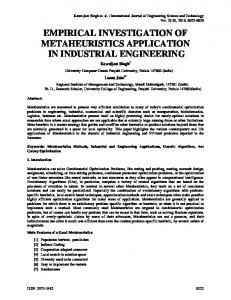
identify each scenario. Sta art State is the starting point of Scenario i.e. where the scenario start Message is a set of all the events that occur in scenario. Successfful / Unsuccessful, this state is th he final state which conveys whether the system’s outpuut is successful or not. The succcessful/ unsuccessful condition totally depend upon the user’s choice) c be denoted by a triplet. Event: < message id; form; to; An event in a message can [/condition]>where messag ge id is a unique identification number for a particuular message, from is the send der of the message, to is the receiver of the messaage, /condition is the guard cond dition subject to which an event takes place. An event w with * indicates an iterative proccess. Figure 2(a) shows the seq quence diagram for the card validation. It has 3 scenarios as shown in Figure 2(b). Figuree 2(c) is the SDG for sequence diagram given in Figure 22(a).
Fig. 2(a a). Sequence Diagram for Card Validation
< id1
Unsuccessfful>
Fig. 2(b). Threee scenarios represented in the form of Quadruples
Fig. 2(c)). SDG for Sequence diagram in figure 2(a)
Test Case Gen neration Using Activity Diagram and Sequence Diagram
125
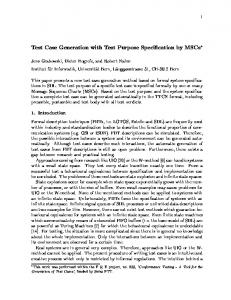
3.3 Integrating AG and SG S into SYG After creating the AG and SG, the next step is to integrate these two graphs intto a single graph called System Graph (SYG). in the following algorithm1, GEN-SYG we integrate the AG and SG to form SYG. The definition of the SYG is as follows Definition3: system graph h SYG: The sequence graph (SYG) is defined asSYG G= {State, Edge, First, Last}, where, State = StateSG∪A is the set of all nodes of the SG and AG Edge = EdgeSG∪ F ∪ Ed dgeG where EdgeSG is the edges of the SG, F is the flow w in case of AG and EdgeG is thee edge from the AG to SG. First= ai the first node of o the AG. Last = LastSDG∪ af is the final set of nodes in SYG. Starting with AG, we in ntegrate the SGs into it as per the definition of the SY YG. Figure3 shows the SYG forr the system after combination of the SG and AG.
Fig. 3. SY YG formed after the integration of AG and SG
Now we present the algo orithm to generate SYG from AG & SG. Algorithm1: GEN-SYG G) and Sequence Graph (SG) Input: Activity Graph (AG Output: System Graph (SY YG) 1. P = EnumerateAllP Paths(AG) 2. For each path pi∈ P do 3. 4. 5. 6. 7. 8. 9.
// start with the first node CSj = CSi preCi = FindPreCo ond(CSi) T Φ For each node CSj of path pi do If ci∈ CSi // current c stage has any conditional statement α = CSi-1 SG // edge from previous node to sequence graph β = SG(Last) CSi+1 //edge from the lasstnode of SG to next node of AG. Edge from unsuccessful final node of SG to node CSi+1 where the value of V = 0 else edge frrom Successful final no ode of SG to node CSi+1 where the value of V = 1
126
A. Tripathy and A. Mitra
10. EndIf 11. T T∪ T1 12. If ci∈ CSi 13. γ = CSi CSi+1 // there is edge from the present node to the next node of the of the same Activity Graph 14. EndIf 15. EndFor 16. End
4 Test Case Generation After storing all essential information for test case generation using SYG, we now traverse the SYG to generate test cases. We purpose an algorithm TCG-SYGthat automatically traverses the SYG so as to generate the test cases. While traversing the system graph (SYG) we use DFS (Depth First Search) [8] optimization technique. As its name implies, DFS traverses "deeper" in the graph whenever possible. In depth-first search, edges are explored out of the most recently discovered vertex v that still has unexplored edges leaving it. This process continues until we have discovered all the vertices that are reachable from the original source vertex. If any undiscovered vertices remain, then one of them is selected as a new source and the search is repeated from that source. This entire process is repeated until all vertices are discovered.Now we present own algorithm TCG-SYG, in pseudocode form. Algorithm 2: TCG - SYG Input: System Graph (SYG) Output: Test Suite (T) 1. Enumerate all paths P = {P1, P2, P3,…..,Pn} fromstart node to a final node in the SYG. 2. For each path P i∈P do 3. nj = nx // nj is the current node ; start withnxthe start node 4. preCi is the precondition of the node corresponding to scenario stored in nx 5. tiΦ // initially the test case for the path Pi is empty 6. while ( nj ≠ nz ) do nz being the final node 7.
8.
Select Test Case t= {preC, I (a1, a2, a3,.., an), O(d1,d2,d3,.,dm), postC} where preC = precondition of the method m I (a1, a2, a3,.., an) = set of input values for the method m(…)from fromObject O(d1,d2,d3,.,dm)= set of resultant values in thetoObject when the method m(…) is executed postC = the postcondition of the method m(…) Add t to the test set ti, that is, ti= ti∪ t
Test Case Generation Using Activity Diagram and Sequence Diagram
127
9. 10. 11. 12. 13. 14.
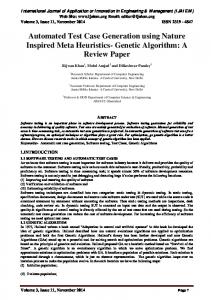
nj = nk // Move to the next node nk on the path Pi T = T ∪ti Endwhile Determine the final output Oi and postCifor the node stored as nz t = {preCi, Ii, Oi, postCi} Add the test case t to the test case T, that is, T T∪ t 15. EndFor 16. Return (T) 17. Stop The algorithm TCG-SYG starts by enumerating all paths in the SYG, from the start node to the different final nodes. Steps 2 to 15 are iterated for each path in the SDG. Step 4 determines the initial precondition of the node from the start node nx. For each considered path, Steps 7 to 11 determine the various pre conditions, input, output and post conditions for each interaction of the considered scenario. This gives the test cases for finding out interaction faults if any. And finally Step13 gives the test case corresponding to the scenario as a whole. The test cases generated using theses algorithms and for the case ATM card Validation is shown in Figure 4.
Test name: = “ATM CARD VALIDATION” Precondition : ATM is displaying an welcome message, Ask the User to enter the ATM card Test case 1 Input: user input ATM card Condition: Not a valid ATM card Output: Eject card Postcondition : display the welcome message Test case 2 Input: Card = ATM, status =“ valid” Condition: Account =“ closed” Output: Eject card Postcondition : display the welcome message Test case3 Input: Card= ATM, status = “valid”, Account=“open” Output: Display “enter pin” Postcondition: pin is enter and checked for validity
Fig. 4. Test cases generated using GEN-SYG and TCG-SYG for the case ATM card Validation
128
A. Tripathy and A. Mitra
5 Conclusions and Future Work We have proposed an approach to use activity diagram and sequence diagram as UML diagram for generating test cases. We convert the diagrams into intermediate representations called System Graph (SYG), which is an integration of intermediate representation of activity diagram and sequence diagram. The test cases obtained in this method is exhaustive i.e. no more valid test cases can be generated apart from the test cases generated in this method. In the activity diagram, a conditional statement is required for having the possibility of multiple paths. The solution of the statement leads us to the optimum result. Sequence diagram represent the various interactions possible between the objects during the operation. For developing the sequence diagram, an experienced developer will consider all the cases. So whenever we integrate the two UML diagrams it will cover all the possibility. Apart from this characteristic, the system is able to solve faults like operational, integration and scenario faults using sequence diagram. Activity diagram also solves the problem of concurrent execution problem which leads to state explosion problem. In this paper while traversing the graph, we use the method of Depth First Search (DFS) as the method of traversing each graph. As DFS is one of the optimization algorithm while graph traversal, so that the test cases obtained in this methods are not only exhaustive but also optimum. During the process of test case generation, we have tried to solve many problems but still some of the problems related to combination of activity and sequence diagram remained unsolved. In our future work, we will try to combine one or more UML diagrams with this existing system, so that the system is able to handle all types of error. This step will lead us to develop a generalized method. Further, we have only used the DFS algorithm to optimize the test cases generation. A further analysis on results and performance of our model using other graph optimizing technique will be an interesting work to carry out in future.
References 1. Mall, R.: Fundamental of Software Engineering, 2nd edn. Prentice-Hall of India Private limited, New Delhi (2004) 2. Object Management group, UML Specification 1.5 (2000), http://www.omg.org/uml 3. Booch, G., Rambaugh, J., Jacobson, I.: The United Modeling Language User Guide. Addition-Weseley (2001) 4. Mall., R., Sarma, M.: Automatic Test case Generation from UML Models. In: The Proceeding of IEEE Conference on Software Maintenance (2007) 5. Wang, L., Yuan, J., Yu, X., Hu, J., Li, X., Zheng, G.: Generating Test cases from UML Activity Diagram based on Gray-box Method, National Natural Science Foundation of China. National Natural Science Foundation of China (2005) 6. McGregor, J.D., Sykes, D.A.: A practical guide to testing object-oriented software. Addition Wesley, NJ (2001) 7. Binder, R.V.: Testing Object-Oriented System Models, Patterns and Tools. AdditionWesley, NY (1999)
Test Case Generation Using Activity Diagram and Sequence Diagram
129
8. Coreman, T.H., Leiserson, C.E., Rivest, R.L., Stein, C.: Introduction to Algorithm, 2nd edn. The MIT Press. McGraw-Hill Book Company, Massachusetts, London 9. Kim, H., Kang, S., Baik, J.: Test Case Generation from UML Activity Diagram. In: Proceeding of 8th ACIS International Conference on Software Engineering, Artificial Intelligence, Networking and Parallel/Distributed Computing. IEEE Computer Society (2007)