Clinical Neurophysiology 115 (2004) 973–981 www.elsevier.com/locate/clinph
Altered response control and anterior cingulate function in attention-deficit/hyperactivity disorder boys Andreas J. Fallgattera,*, Ann-Christine Ehlisa, Juergen Seifertb, Werner Konrad Strikc, Peter Scheuerpflugb, Klaus Eckard Zillessend, Martin J. Herrmanna, Andreas Warnkeb a
Department for Psychiatry and Psychotherapy, University of Wuerzburg, University Hospital, Fuechsleinstrasse 15, 97080 Wuerzburg, Germany b Department for Child and Adolescent Psychiatry and Psychotherapy, University of Wuerzburg, Wuerzburg, Germany c Department for Psychiatry, University of Bern, Bern, Switzerland d Department for Child and Adolescence Medicine, Sophien- and Hufeland-Klinikum Weimar gGmbH, Weimar, Germany Accepted 28 November 2003
Abstract Objective: To investigate mechanisms and structures underlying prefrontal response control and inhibition in boys suffering from attention-deficit/hyperactivity disorder (ADHD). Methods: Sixteen boys with ADHD and 19 healthy controls were investigated electrophysiologically during performance of a visual Go-Nogo task (Continuous Performance Test, CPT). An electrophysiological source localization method was employed to further analyze the data. Results: The ADHD boys showed a significantly diminished central Nogo-P3, due to a lack of Nogo-related frontalization of the positive brain electrical field in this group. This two-dimensional effect was associated with a significantly reduced activation of the anterior cingulate cortex (ACC) in the ADHD boys in the Nogo condition of the CPT. Both groups did not significantly differ regarding the amplitude of the Nogo-N2. Conclusions: The results indicate deficits in prefrontal response control in unmedicated ADHD boys that do not seem to be specifically inhibitory in nature. A supposed dysfunction of the ACC in ADHD was confirmed. q 2004 International Federation of Clinical Neurophysiology. Published by Elsevier Ireland Ltd. All rights reserved. Keywords: Attention deficit/hyperactivity disorder; Anterior cingulate cortex; Prefrontal response control; Response inhibition
1. Introduction Attention-deficit/hyperactivity disorder (ADHD) is one of the most common childhood disabilities (Shaywitz et al., 1994) and is characterized by developmentally inappropriate symptoms of inattention, impulsivity and hyperactivity. It has been suggested that a core deficit in inhibitory control accounts for many deficits in executive function observed in ADHD that underlie most of the dysfunctional behaviors associated with this syndrome (Barkley, 1997). In accordance with this view, children suffering from ADHD very often exhibit deficits in response inhibition and perform poorly on tasks of inhibitory control such as the Stop-Signal Task or Go-Nogo paradigms * Corresponding author. E-mail address:
[email protected] (A.J. Fallgatter).
(Bayliss and Roodenrys, 2000; Konrad et al., 2000; Nigg, 1999; Rubia et al., 2001; Schachar and Logan, 1990; Schachar et al., 2000). In addition to these behavioral signs of disturbed mechanisms of response inhibition, electrophysiological data have also been interpreted as reflecting deficits in inhibitory control in ADHD. ADHD children were, for example, found to exhibit decreased right inferiorfrontal N200 amplitudes in a Stop-Signal Task (Pliszka et al., 2000), the N200 being interpreted as a neurophysiological correlate of response inhibition. Studies employing Go-Nogo tasks also partly reported decreased frontal N200 amplitudes in ADHD children, but mostly interpreted their findings in the light of a more general attentional deficit in ADHD children, not exclusively related to response inhibition. Yong-Liang et al. (2000), for example, observed a reduced N200 amplitude in ADHD children only when the Go-Nogo task was performed second, after
1388-2457/$30.00 q 2004 International Federation of Clinical Neurophysiology. Published by Elsevier Ireland Ltd. All rights reserved. doi:10.1016/j.clinph.2003.11.036
974
A.J. Fallgatter et al. / Clinical Neurophysiology 115 (2004) 973–981
a stimulus-response compatibility task. Overtoom et al. (1998) investigated ADHD children by means of a Continuous Performance Test (CPT) and found decreased N200 amplitudes only in a particular subgroup of ADHD children; for the group of ADHD children as a whole, the N200 component did not differentiate patients and control children. However, the ADHD children exhibited a reduced target P300, suggesting deficient attentional processes rather than specific disturbances in response inhibition. Brandeis et al. (2002) also employed the CPT to investigate children suffering from ADHD, and observed an impaired orientation to cues in these children. Furthermore, they reported an attenuation of several Nogo-related components (frontal N2, central P3, right posterior P300) linked to frontal functions. Functional imaging studies have provided further evidence for ADHD-related disturbances in processes and structures underlying inhibitory control. Functional magnetic resonance imaging (fMRI) during a Go-Nogo paradigm (Vaidya et al., 1998) showed atypical activation of frontal-striatal structures in ADHD children that was associated with deficits in inhibitory control. Also employing fMRI, Rubia et al. (1999) found a reduced activation of right-prefrontal areas in ADHD adolescents in a Stop-Signal Task, and Rubia et al. (2001) reported diminished rightprefrontal activation during higher level inhibition and delay management in addition to behavioral disturbances of response inhibition in ADHD adolescents. In contrast to these findings, Vaidya et al. (1998) observed enhanced frontal lobe activity bilaterally in ADHD children performing a Go-Nogo task, which was attributed to an increased inhibitory effort in these children. For the present study, the CPT (Rosvold et al., 1956) was used to further investigate neurophysiological mechanisms of inhibitory control in children suffering from ADHD. Electrophysiological studies employing Go-Nogo tasks such as the CPT usually report some characteristic differences in the event-related potentials (ERPs) following Go and Nogo stimuli. Firstly, in the Nogo ERPs a negative deflection with a frontocentral maximum occurs around 200 –400 ms after stimulus onset (Nogo-N2). This N2 has been suggested to reflect the inhibitory process associated with Nogo trials, although some contradictory findings have questioned this inhibition concept of the N2 (Falkenstein et al., 1995). The other characteristic difference between Go and Nogo ERPs concerns the topography of the P300 which is located more anterior (maximum typically at Cz) in Nogo as compared to Go (parietal maximum, typically at Pz) trials (e.g. Bokura et al., 2001). This effect has also been suggested to be associated with processes of response inhibition. A useful parameter quantifying this frontalization of the positive brain electrical field is the ‘Nogoanteriorization’ (NGA; Fallgatter et al., 1997, 2000; Fallgatter and Strik, 1999) that has been shown to be a highly reliable neurophysiological correlate of prefrontal/ cognitive response control (Fallgatter et al., 2001, 2002).
An electrophysiological source localization method (LORETA) (Pascual-Marqui et al., 1994) related the Nogo-evoked P300 activity to an activation of certain prefrontal structures, particularly the anterior cingulate cortex (ACC) (Fallgatter et al., 2002; Strik et al., 1998). The aim of the present study was to examine neurophysiological correlates of prefrontal response control in a group of children suffering from ADHD. The two major questions were if the electrophysiological data (N2, P3) would indicate a specific deficit in response inhibition in ADHD children and if these children would differ from healthy controls regarding the localization and/or strength of electrical activity underlying the scalp potentials.
2. Methods 2.1. Subjects A total of 18 boys suffering from uncomplicated attention deficit and hyperactivity disorder without any comorbidity (F90.0 according to ICD10) and a control sample of 19 healthy boys were investigated electrophysiologically after written informed consent was obtained. Due to an insufficient number of artifact-free EEG-epochs, two of the ADHD children had to be excluded from further analyses. The remaining 16 children (mean age ^ SD: 9.55 ^ 1.52 years; range: 7.17 – 11.67 years) were all patients at the Department of Child and Adolescent Psychiatry, University Hospital, Wuerzburg. They had no accompanying psychiatric or somatic disorders and no clinically reduced intelligence, and they did not receive any medication. Mean IQ was 106.5 ^ 9.8 (range: 90 –121) and mean body weight was 29.2 ^ 4.1 kg (range: 21.2– 38.8 kg). The control group consisted of 19 healthy boys matched for age, gender and handedness, who had no history of neurological or psychiatric illness and were free of medication (mean age: 9.9 years, range: 8.2 – 11.8 years; mean IQ: 111, range: 97 – 132). Patients and controls were all right-handed according to Oldfield (1971). Subjects, but not the focus of electrophysiological analyses, partly overlap with the studies of Zillessen et al. (2001) and Seifert et al. (2003). The electrophysiological investigation was approved by the Ethics Committee of the University of Wuerzburg and by the research conferences of both, the Department of Psychiatry and Psychotherapy and Child and Adolescent Psychiatry and Psychotherapy. 2.2. Electrophysiological paradigm The participants were investigated electrophysiologically in an electrically shielded, dimly lit room, sitting on a comfortable chair in front of a computer screen to perform an O-X version of the CPT (Rosvold et al., 1956). The CPT is a Go-Nogo task that demands the preparation and execution of responses to pre-defined target-stimuli
A.J. Fallgatter et al. / Clinical Neurophysiology 115 (2004) 973–981
(Go) as well as the inhibition of a prepared motor response following other stimuli (Nogo). This Nogo condition was of particular interest for the present investigation, since it involves the processes of response inhibition that have often been suggested to be impaired in ADHD (see above). During this task, letters were presented sequentially in a pseudo-randomized order and subjects were instructed to press a response button whenever the letter ‘O’ was directly followed by the letter ‘X’. The whole stimulus set consisted of 400 letters, with 80 primer conditions (O), 40 Go (O followed by X) and Nogo (O followed by any other letter) conditions and 240 distractors (other letters, or letter X without a preceding O). The letters were presented for 200 ms each, followed by an interstimulus interval of 1650 ms which resulted in an overall duration of this task of about 13 min. After a short training session, subjects performed this version of the CPT while the ongoing EEG was recorded. 2.3. EEG recording The EEG was recorded from 21 scalp electrodes which were placed according to the International 10 –20 system (Jasper, 1958) at Fp1, Fp2, F3, F4, F7, F8, T3, T4, C3, C4, T5, T6, P3, P4, O1, O2, FPz, Fz, Cz, Pz and Oz. Three additional electrodes (at the outer canthi of both eyes and below the right eye) were applied to register horizontal and vertical eye movements, and linked mastoids were used as the recording reference. Electrode impedances were constantly kept below 5 kV. The recording system involved a 32-channel DC amplifier (Brain Star System) and the Neuroscan data acquisition software, which was calibrated with an external 100 mV/10 Hz signal. The hardware filter was set to a bandpass of 0.3 –70 Hz; A/D rate was 256 Hz. 2.4. Data analysis First of all, data were re-referenced to the average reference before a computerized artifact rejection excluded all segments with amplitudes exceeding 98 mV in any of the EEG or EOG channels within the first 500 ms after stimulus onset. The remaining artifact-free EEG segments were then averaged to one Go and one Nogo ERP, whereby only trials with correct responses were included in the ERP analysis. Subjects with less than 20 artifact-free EEG epochs in one of the two target conditions were excluded from further analysis. Next, the N200 and P300 peaks were individually identified in the averaged Go- and Nogo-ERPs as the most negative/positive point within a certain time-frame that was determined on the basis of a visual inspection of the respective grand-average curves. The following timeframes were defined: Go-N2: 128 – 367 ms for both ADHD and control children; Nogo-N2 ADHD: 187 –398 ms; Nogo-N2 controls: 144 – 368 ms; Go-P3 ADHD: 250 – 527 ms; Go-P3 controls: 252 – 543 ms; Nogo-P3 ADHD: 254 –520 ms; Nogo-P3 controls: 254 – 504 ms.
975
For the peaks within these time windows, the individual amplitudes (mV) and latencies (ms) were calculated and exported. 2.5. LORETA method LORETA (Low-Resolution Electromagnetic Tomography; Pascual-Marqui et al., 1994) is one of the methods that have been developed to ‘solve’ the so-called ‘inverse problem’ by giving an approximation/estimation of the brain electrical sources underlying the scalp potential field ( ! 3-dimensional source localization method). The LORETA method was described in more detail elsewhere (Pascual-Marqui et al., 1994, 1999; Strik et al., 1998). In short, LORETA calculates the current density at each of 2394 voxels in the gray matter and the hippocampus of a reference brain (Brain Imaging Centre, Montreal Neurologic Institute; MNI305) as the linear, weighted sum of the scalp electric potentials, whereby the smoothest of all possible current density configurations throughout the brain volume is chosen by minimizing the total squared Laplacian of source strengths. In contrast to other source localization methods, LORETA does not make any assumptions about the number of sources contributing to the scalp potentials. The only pre-assumption that is made is that neighboring voxels have a maximally similar electrical activity. The version of LORETA employed in the present study uses a 3-shell spherical head model (Pascual-Marqui et al., 1994, 1999). Several studies investigated the properties of LORETA in localizing electrical sources of scalp potentials. In a simulation experiment, for example, LORETA was shown to localize sources more reliably than 4 other source localization techniques (Pascual-Marqui, 1999). Further studies showed that LORETA localizes activation in the same brain areas as other brain imaging techniques during simple acoustic and visual processes (Pascual-Marqui et al., 1994) as well as during performance of more complex cognitive tasks (Lehmann et al., 2001; Mulert et al., 2001; Strik et al., 1998; Winterer et al., 2001), confirming the validity of the LORETA source localization. In the present study, LORETA calculations were based on the individual latency of the P300 peak at Cz. These latencies ranged from 328 to 516 ms in the group of ADHD children and from 297 to 488 ms in the group of healthy controls. 2.6. Statistical analysis For statistical purpose, 2 £ 2 £ 3 analyses of variance (ANOVAs) for repeated measurements with the factors ‘diagnosis’ (ADHD versus control children), ‘condition’ (Go versus Nogo) and ‘electrode position’ (Fz, Cz, Pz) were calculated for the P3 amplitude and latency, 2 £ 2 £ 2 ANOVAs (‘diagnosis’: ADHD vs. controls £ ‘condition’: Go vs. Nogo £ ‘electrode position’: Fz vs. Cz) for the N2
976
A.J. Fallgatter et al. / Clinical Neurophysiology 115 (2004) 973–981
amplitude and latency. We did not include the Pz potentials in the analyses of the N2, since this component typically has a frontocentral maximum and could not be detected at Pz in the present study. Post hoc analyses were conducted by twotailed t tests for matched or independent samples. Equality of variances was tested by means of Levene’s test and corrections for inequality were performed whenever necessary. Reaction times for patients and controls were compared by means of Student’s t test for independent samples, whereas the numbers of omission and commission errors were not normally distributed and therefore compared by Mann-Whitney U tests. Additional exploratory statistical analyses of the latencies and amplitudes of earlier ERPcomponents (N1, P2) were also performed by means of t tests for independent samples. The LORETA analysis that compares the different groups or conditions statistically is based upon a bootstrap method with 5000 randomized samples (LORETA-Key-01 FreeBrainWare; Pascual-Marqui, 1999). This procedure results in the exact significance thresholds for significant differences between groups or conditions, regardless of nonnormality and corrected for multiple comparisons. The differences in localization between the group of patients and the control group were computed by voxel-by-voxel t tests for independent measures of the LORETA images, based on the power of the estimated electric current density.
3. Results 3.1. Reaction times and error rates The group of ADHD children exhibited significantly longer reaction times to target (Go) stimuli than the control group (493 ^ 75 vs. 429 ^ 64 ms; t33 ¼ 2:711, P , 0:05). Omission errors consisted of Go-stimuli subjects did not respond to, whereas commission errors occurred whenever subjects responded to a non-target stimulus (Nogo). MannWhitney U tests revealed that the ADHD group made significantly more omission errors than the control group (U ¼ 53:0, P , 0:001), whereas both groups did not differ Table 1 Behavioral data
n RT (ms) Om. errors Com. errors
ADHD
Controls
Test statistic
16 493 ^ 75 5.2 ^ 5.0 1.9 ^ 2.6
19 429 ^ 64 1.0 ^ 1.2 1.9 ^ 1.8
t33 ¼ 2:711* U ¼ 53:0*** U ¼ 137:5
Reaction time (RT), number of omission and number of commission errors (Om. and Com. errors) for the group of ADHD and control children (mean ^ standard deviation SD) with corresponding t value (RT) / U value (errors) for the comparison of ADHD versus control subjects. Statistically significant differences between the group of patients and the control group: *P , 0:05, ***P , 0:001.
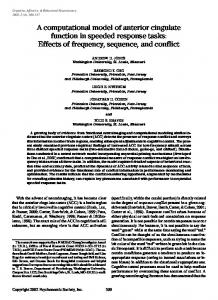
significantly regarding the mean number of commission errors (U ¼ 137:5, not significant (n.s.)) (Table 1). 3.2. Electrophysiological data To analyze amplitudes and latencies of the P300 component ANOVAs for repeated measurements were conducted with ‘diagnosis’ (ADHD children vs. controls) as the between-subjects factor and ‘condition’ (Go vs. Nogo) as well as ‘electrode position’ (Fz, Cz, Pz) as the repeated-measures factors. For the P300 amplitude, this analysis revealed a significant main effect of the factor ‘electrode position’ (F1;66 ¼ 91:5, P , 0:001), as well as significant interactions ‘condition £ diagnosis’ (F1;33 ¼ 7:2, P , 0:05), ‘condition £ position’ (F2;66 ¼ 41:1, P , 0:001) and ‘condition £ position £ diagnosis’ (F2;66 ¼ 4:7, P , 0:05). No other significant main effects or interactions occurred. Regarding the main effect, P300 amplitudes were found to be generally lowest at electrode position Fz, higher at Cz and highest at Pz, with significant differences between each of these positions as revealed by post hoc t tests (P , 0:001). Post hoc analyses of the 3-dimensional interaction ‘condition £ position £ diagnosis’ revealed that control children displayed the typically observed pattern of activation in Go-Nogo tasks, with significantly higher P3 amplitudes in Nogo as compared to Go trials at frontocentral electrode positions (Fz: t18 ¼ 3:93, P , 0:01; Cz: t18 ¼ 3:88, P , 0:01) and significantly higher amplitudes in Go as compared to Nogo trials at posterior sites (Pz: t18 ¼ 5:54, P , 0:001) (Fig. 1a). Children with ADHD, on the other hand, markedly differed from this pattern, exhibiting a tendency for higher amplitudes in Go as compared to Nogo trials at electrode position Cz (t15 ¼ 1:57, n.s.) (Fig. 1b), albeit with a similar pattern of activation at electrode position Fz (Nogo . Go: t15 ¼ 2:95, P , 0:05) and Pz (Go . Nogo: t15 ¼ 5:55, P , 0:001) (as compared to the control group). The ADHD group’s abnormal pattern at electrode position Cz also resulted in a significantly reduced P3 amplitude at Cz in these children (t33 ¼ 2:73, P , 0:05) as compared to the healthy controls. Two-dimensional maps of the scalp distribution of the ERP confirmed that the P300 group difference at the central electrode site was due to a less pronounced frontalization of the positive brain electrical field in children with ADHD as compared to healthy control children (Figs. 2 and 3a,b). For the P300 latency, significant main effects of the factors ‘diagnosis’ (F1;33 ¼ 7:89, P , 0:01), ‘condition’ (F1;33 ¼ 9:56, P , 0:01) and ‘electrode position’ (F2;66 ¼ 6:97, P , 0:01) were observed, whereas no significant interactions occurred. Generally, the ADHD children exhibited increased P300 latencies as compared to the control group (406.7 ^ 7.1 vs. 379.6 ^ 6.5 ms, P , 0:01), and latencies were longer for Nogo than for Go trials (406.2 ^ 6.6 vs. 380.0 ^ 6.3 ms). Furthermore, latencies were shortest at electrode position Pz (370.9 ^ 10.6 ms) and significantly longer at both Cz
A.J. Fallgatter et al. / Clinical Neurophysiology 115 (2004) 973–981
977
Fig. 1. Mean P300 amplitudes (mV) at Fz, Cz and Pz in (a) healthy children and (b) children suffering from ADHD for the CPT Go and Nogo condition. Standard deviations are indicated by vertical bars. Statistically significant differences between the conditions (Go vs. Nogo): ***P , 0:001, **P , 0:01, *P , 0:05.
(409.2 ^ 6.2, P , 0:01) and Fz (399.3 ^ 5.7 ms, P , 0:05). Regarding the N200 amplitude, similar ANOVAs for repeated measurements – the factor ‘electrode position’ only including Fz and Cz here – were calculated and revealed significant main effects for the factors ‘condition’ (F1;33 ¼ 43:92, P , 0:001) and ‘position’ (F1;33 ¼ 49:97, P , 0:001) as well as a significant interaction ‘condition £ position’ (F1;33 ¼ 17:46, P , 0:001). As for the main effects, N2 amplitudes were generally more negative for
Fig. 3. Grand average curves for the CPT Go (thin line) and Nogo (bold line) condition in (a) the control group and (b) the group of ADHD children. Two-dimensional maps indicate the distribution of the positive brain electrical field at the P300 peak for Go and Nogo trials.
Nogo than for Go trials and more negative at electrode position Fz than at Cz (Table 2). The significant interaction effect ‘condition £ position’ resulted from a significantly larger Go/Nogo difference at Cz (mean Go-Nogo difference ¼ 3:09) as compared to Fz (mean difference ¼ 1:16) (t34 ¼ 4:27, P , 0:001). For the N200 latency, the ANOVA only revealed a significant interaction ‘condition £ position £ diagnosis’ (F1;33 ¼ 5:63, P , 0:05), resulting from significantly longer Table 2 N200 amplitudes ADHD n Go Fz Cz Nogo Fz Cz
Fig. 2. Grand average curve of the ADHD children (bold line) and the control group (thin line) for CPT Nogo trials at Cz. Two-dimensional maps indicate the distribution of the positive brain electrical field at the P300 peak.
16
Controls
t value
19
23.20 ^ 2.46 0.31 ^ 1.85
24.54 ^ 2.19 20.12 ^ 2.62
t33 ¼ 1:70 t33 ¼ 0:55
24.26 ^ 2.76 22.56 ^ 2.32
25.79 ^ 1.98 23.38 ^ 3.28
t33 ¼ 1:91 t33 ¼ 0:84
N200 amplitude (mV) at electrode position Fz and Cz in the CPT Go and Nogo condition for ADHD children and healthy controls (mean ^ SD). The two groups were compared by means of t tests; t values are given. No significant differences (P , 0:05) were observed.
978
A.J. Fallgatter et al. / Clinical Neurophysiology 115 (2004) 973–981
Table 3 N1 and P2 amplitudes and latencies
N1-Go Fz Cz Pz N1-Ng Fz Cz Pz P2-Go Fz Cz Pz P2-Ng Fz Cz Pz
ADHD
Controls
t value
Amp Lat Amp Lat Amp Lat
22.3 ^ 1.7 122.8 ^ 33.2 23.0 ^ 1.7 101.8 ^ 16.4 22.1 ^ 1.4 93.0 ^ 19.0
22.7 ^ 1.5 125.4 ^ 20.5 21.4 ^ 1.8 96.2 ^ 19.4 20.9 ^ 1.5 92.3 ^ 25.2
t33 t24 t33 t33 t33 t33
¼ 0:64 ¼ 0:27 ¼ 2:66* ¼ 0:91 ¼ 2:52* ¼ 0:09
Amp Lat Amp Lat Amp Lat
21.7 ^ 1.0 109.4 ^ 22.7 22.6 ^ 1.5 112.5 ^ 31.0 22.3 ^ 1.5 104.5 ^ 34.5
22.6 ^ 1.5 122.5 ^ 24.4 22.0 ^ 1.5 106.3 ^ 21.0 21.5 ^ 1.3 88.4 ^ 14.1
t33 t33 t33 t33 t33 t19
¼ 2:06* ¼ 1:64 ¼ 1:17 ¼ 0:71 ¼ 1:64 ¼ 1:75
Amp Lat Amp Lat Amp Lat
4.0 ^ 2.0 212.4 ^ 23.6 5.0 ^ 2.3 222.4 ^ 21.3 6.1 ^ 3.2 263.0 ^ 25.7
2.6 ^ 2.2 201.7 ^ 19.8 5.4 ^ 1.8 206.6 ^ 23.1 7.9 ^ 2.6 252.9 ^ 34.9
t33 t33 t33 t33 t33 t33
¼ 1:98 ¼ 1:46 ¼ 0:64 ¼ 2:09* ¼ 1:80 ¼ 0:95
Amp Lat Amp Lat Amp Lat
3.1 ^ 1.8 201.9 ^ 29.2 4.0 ^ 1.4 220.0 ^ 20.7 4.3 ^ 2.6 238.8 ^ 35.9
1.7 ^ 1.9 188.7 ^ 28.4 4.0 ^ 1.7 196.5 ^ 23.0 5.6 ^ 1.4 231.1 ^ 46.3
t33 t33 t33 t33 t22 t33
¼ 2:23* ¼ 1:35 ¼ 0:16 ¼ 3:14** ¼ 1:85 ¼ 0:54
N1 and P2 amplitudes (mV) and latencies (ms) at electrode position Fz, Cz and Pz in the CPT Go and Nogo (Ng) condition for ADHD children and healthy controls (mean ^ SD). The two groups were compared by means of t tests; t values are given. Significant differences: *P , 0:05, **P , 0:01).
Nogo N2 latencies of the ADHD children at Cz (ADHD: 323.0 ^ 38.2 ms vs. controls: 287.2 ^ 28.2 ms, t33 ¼ 3:19, P , 0:01), with similar Nogo latencies at Fz (ADHD: 309.6 ^ 28.5 ms vs. 301.6 ^ 18.1 ms, t33 ¼ 1:00, n.s.) and
similar Go latencies at both electrode positions (Fz: ADHD 305.9 ^ 29.5 ms vs. controls 295.0 ^ 43.6 ms, t33 ¼ 0:85, n.s.; Cz: ADHD 294.2 ^ 38.8 ms vs. controls 306.9 ^ 44.6 ms, t33 ¼ 0:89, n.s.). Exploratory statistical analyses of the amplitudes and latencies of earlier ERP components (N1, P2) revealed a few statistically significant differences between groups (Table 3) that, however, did not withstand a Bonferroni correction (Pcorrected ¼ 0:05=24 ¼ 0:002). In summary, the ADHD children differed from the healthy control group in displaying significantly smaller P300 amplitudes at Cz in the CPT Nogo condition without the typically observed activation pattern for Go-Nogo tasks. Average topographic mapping of the scalp distribution of the Go and Nogo P3 confirmed that this was due to a less pronounced frontalization of the positive brain-electrical field in the group of ADHD children as compared to the healthy control group. P300 latencies were generally increased in the group of ADHD children. Regarding the N200, no pronounced differences between the two groups could be observed, except for significantly longer N2 Nogo latencies in the ADHD group at Cz only. 3.3. LORETA analysis With regard to the electrophysiological data presented above, the main finding of the present study is the lack of a Nogo-related frontalization of the P300 topography within the group of ADHD children, reflected by significantly diminished central Nogo P300 amplitudes in the ADHD group. This two-dimensional topographical effect was further analyzed by means of the LORETA source localization method, to examine if the ADHD group also differed from the controls regarding the activation of the electrical sources underlying the scalp potentials. First of all, we employed the LORETA voxel-by-voxel t test analysis to compare the Nogo-related activity of the two
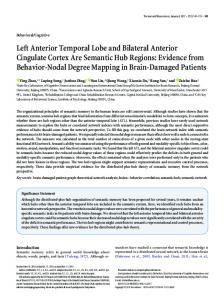
Fig. 4. Graphical representation of the LORETA t statistics comparing the Nogo-related activation of ADHD children and healthy controls. Blue color indicates the location of significantly reduced electrical activity in the brain of the ADHD children compared to the control group (left, axial; middle, sagittal; right, coronary slice through the reference brain). Black arrows indicate the center of the difference in activation in the ACC (Brodmann area 24).
A.J. Fallgatter et al. / Clinical Neurophysiology 115 (2004) 973–981
groups of children. This analysis revealed a significantly diminished electrical activity in the anterior cingulate (BA 24) of the ADHD group (t ¼ 23:54, P , 0:05), and in no other region of the brain (Fig. 4). For the Go ERPs, no significant group differences were observed. Comparing the Go- and the Nogo-related activity separately for each group, the ADHD children exhibited a significantly increased activation of the Precuneus in the Go condition, whereas the Nogo condition did not lead to a marked increase in activation in any region of the brain. The control children exhibited a markedly – though not significantly – increased activation of the anterior cingulate (BA 24) in the Nogo- as compared to the Go-condition (t ¼ 23:2703, P ¼ 0:1766), which is usually observed in healthy adults.
4. Discussion 4.1. Response control versus response inhibition The major finding of the present study is a diminished Nogo-related anteriorization of the P300 topography with reduced Cz amplitudes in ADHD boys that goes along with a significantly diminished Nogo-related activation of the anterior cingulate cortex (ACC) in these children as compared to a healthy control group. The highly significant increase of the P300 amplitude at frontal and central electrode positions (Fz, Cz) in CPT Nogo as compared to Go trials within the group of healthy children reflects the anteriorization of the positive brain electrical field under Nogo conditions (‘Nogo-anteriorization’, NGA) usually observed in healthy adults. This increase in frontocentral P300 amplitudes – and thus the anteriorization of the P300 topography – was not equally observed in ADHD children (Go . Nogo at electrode position Cz) (also compare maps in Figs. 2 and 3). As the NGA has been suggested to be a neurophysiological correlate of prefrontal response control (Fallgatter and Strik, 1999), the present findings indicate a deficit in mechanisms of prefrontal response control in ADHD children. In contrast to previous studies (Overtoom et al., 1998; Pliszka et al., 2000; Yong-Liang et al., 2000) we did not observe reduced N200 amplitudes in Nogo trials in the group of ADHD children, but rather a comparable increase in Nogo as compared to Go trials in both groups of children. As the Nogo-N2 has usually been suggested to reflect prefrontal processes of response inhibition, the ADHD group did not show electrophysiological signs of disturbances in inhibitory control. On a behavioral level, deficits in prefrontal response control did also not become apparent in our ADHD group, commission error rates being equally low in both groups of children. The only finding that might be interpreted in terms of a particular inhibitory dysfunction is the enhanced N2 latency at Cz in Nogo trials within the group of ADHD children, that might indicate a deficient
979
timing of response inhibition in ADHD without, however, behavioral consequences. However, this latency effect was not specific for the N2 component, since the ADHD children also exhibited significantly increased P3 latencies in the Nogo condition of the CPT. Looking at the electrophysiological investigations that reported decreased N2 amplitudes in ADHD children (see Section 1) in more detail, these findings do not really conflict with the present results since they either employed paradigms that markedly differed from the one used here regarding their demands on inhibitory control (Pliszka et al., 2000) or they observed reduced N2 amplitudes only in specific subgroups of ADHD children (Overtoom et al., 1998) not included in the present sample, or they employed very specific task settings (Yong-Liang et al., 2000). The dissociation between the present findings for the Nogo-N2 and the Nogo-P3 amplitudes indicates that both components reflect different cognitive processes. We assume that, while the N2 might be somewhat specific for inhibitory processes, the Nogo-P3 reflects more general processes of prefrontal response control - such as action and conflict monitoring (e.g. Carter et al., 2000), which are more demanding in Nogo than in Go trials. This concept goes well with the idea that the NGA is a correlate of prefrontal response control rather than a correlate of inhibition. Regarding the assumption that the Nogo-N2 reflects some sort of inhibitory process, this idea has been suggested and argued for by various authors (e.g. Jodo and Kayama, 1992; Kopp et al., 1996). Falkenstein at al. (1995), on the other hand, investigated effects of the stimulus modality on ERP components in Go-Nogo tasks and found that a Nogo-N2 was not present in an auditory task situation, which appears to be strong evidence against the response inhibition hypothesis of the N2. However, in a more recent work (Falkenstein et al., 1999) the same group further investigated this issue and now found evidence for an association between the N2 and inhibition, concluding that the NogoN2 “reflects the activity of a modality-specific inhibition process, that works on a pre-motor level.” Taking all this into account, the present findings suggest a deficit in prefrontal response control, but no specific inhibitory deficit, in unmedicated ADHD children. 4.2. Two- and 3-dimensional topography In healthy adults the Nogo-related anteriorization of the P300 brain electrical field is associated with a significant increase in ACC activation (Fallgatter et al., 2002). In the present study, the healthy children exhibited Nogo-related increases in P300 amplitude at Cz and Fz, reflecting the frontalization of the P300 field, whereas the ADHD children did not (at least not at Cz, where usually the largest increase in P300 amplitudes can be observed). Thus, the finding of a significantly diminished activation of the ACC in the group of ADHD children goes very well with the two-dimensional
980
A.J. Fallgatter et al. / Clinical Neurophysiology 115 (2004) 973–981
topographical difference between the two groups. Moreover, the observation of a functional deficit in ACC activation in ADHD is in accordance with recent fMRI findings that showed a significantly reduced activation of the ACC (cognitive division) during a counting Stroop task in unmedicated adults with ADHD as compared to a healthy control group (Bush et al., 1999). As for the pure ACC localization of the Nogo-related activity in healthy children, one might ask why other cerebral structures known to be involved in the generation of the P3 are not identified by the present LORETA source localization. However, LORETA always performs contrast analyses – in this case a contrast analysis of Nogo- versus Go-ERPs – thus only identifying differences between conditions rather than all the activation associated with a particular condition. Consequently, LORETA displayed Nogo-specific activation, which was located in the ACC of healthy children here, without detecting other P3 generators activated during both Go and Nogo trials.
5. Conclusions To sum up, the present findings indicate deficits in prefrontal response control in unmedicated ADHD children that are probably not specifically inhibitory in nature. Furthermore, a 3-dimensional source localization method (LORETA) confirmed a dysfunction of the anterior cingulate cortex (ACC) in ADHD during conditions demanding increased prefrontal response control. On a more general level, these results demonstrate that the applied electrophysiological methods are suitable to increase our knowledge about the specific brain processes underlying important symptoms of ADHD. A future perspective of this kind of research is to identify subsets of ADHD patients characterized by a specific brain dysfunction. These patients could be treated with an individually adjusted therapeutic intervention and the success of the therapy, in terms of an improved brain function, could be measured with the same methodology.
4.3. Behavioral performance and early ERP components Acknowledgements Regarding the behavioral performance, ADHD children did not perform worse than the control group in Nogo trials (low commission error rates in both groups), but they responded more slowly (increased reaction times) and less accurately (more omission errors) than the healthy controls. These findings are in line with previous studies that reported deficits in selective attention (Brodeur and Pond, 2001; Heinrich et al., 2001) and alertness (Lecendreux et al., 2000) in ADHD children, resulting in increased omission error rates and reaction times. Findings of an increased rate of false alarms (commission errors) in ADHD children (e.g. Yong-Liang et al., 2000) could not be replicated in the present study, as our ADHD children exhibiting equally low commission error rates as the healthy control group. This finding further supports the electrophysiological findings that do not indicate a specific inhibitory deficit in our sample of ADHD children. Regarding the amplitudes and latencies of earlier ERP components (N1, P2), some differences between groups were observed (Table 3). However, since we had no a priori hypotheses regarding these components and, moreover, the statistically significant differences did not withstand a Bonferroni correction, a replication of these differences is mandatory before a sound interpretation is possible. 4.4. Limitations The main limitation of the present study is the rather small sample sizes which hamper a detailed analysis with regard to subtypes of ADHD patients according to DSM-IV criteria. Moreover, the sample was limited to a small age range between 8 and 12 years and only boys were included. These factors limit the generalizability of the findings.
The authors would like to thank B. Neuhauser, Ch. Schwarz and I. Gro¨bner for skillful and dedicated technical support.
References Barkley RA. ADHD and the nature of self-control. New York: Guilford; 1997. Bayliss DM, Roodenrys S. Executive processing and attention deficit hyperactivity disorder: an application of the supervisory attentional system. Dev Neuropsychol 2000;17:161–80. Bokura H, Yamaguchi S, Kobayashi S. Electrophysiological correlates for response inhibition in a Go/NoGo task. Clin Neurophysiol 2001;112: 2224–32. Brandeis D, van Leeuwen TH, Steger J, Imhof K, Steinhausen HC. Mapping brain functions of ADHD children. In: Hirata K, Koga Y, Nagata K, Yamazaki K, editors. Recent advances in human brain mapping. Excerpta Medica international congress series, vol. 1232. Amsterdam: Elsevier; 2002. p. 649–54. Brodeur DA, Pond M. The development of selective attention in children with attention deficit hyperactivity disorder. J Abnorm Child Psychol 2001;29:229–39. Bush G, Frazier JA, Rauch SL, Seidman LJ, Whalen PJ, Jenike MA, Rosen BR, Biederman J. Anterior cingulate cortex dysfunction in attention deficit/hyperactivity disorder revealed by fMRI and the Counting Stroop. Biol Psychiatry 1999;45:1542 –52. Carter SC, Macdonald AM, Botvinick MM, Ross LL, Stenger VA, Noll D, Cohen JD. Parsing executive processes: strategic vs. evaluative functions of the anterior cingulate cortex. Proc Natl Acad Sci USA 2000;97:1944–8. Falkenstein M, Koshlykova NA, Kiroj VN, Hoormann J, Hohnsbein J. Late ERP components in visual and auditory Go/Nogo tasks. Electroenceph clin Neurophysiol 1995;96:36–43. Falkenstein M, Hoormann J, Hohnsbein J. ERP components in Go/Nogo tasks and their relation to inhibition. Acta Psychol 1999;101: 267 –91.
A.J. Fallgatter et al. / Clinical Neurophysiology 115 (2004) 973–981 Fallgatter AJ, Strik WK. The NoGo-anteriorisation as a neurophysiological standard-index for cognitive response control. Int J Psychophysiol 1999;32:115 –20. Fallgatter AJ, Brandeis D, Strik WK. A robust assessment of the NoGoanteriorisation of P300 microstates in a cued continuous performance test. Brain Topogr 1997;9:295– 302. Fallgatter AJ, Eisenack SS, Neuhauser B, Aranda D, Scheuerpflug P, Herrmann MJ. Stability of late event-related potentials: topographical descriptors of motor control compared with the P300 amplitude. Brain Topogr 2000;12:255–61. Fallgatter AJ, Bartsch AJ, Strik WK, Mueller TJ, Eisenack S, Neuhauser B, Aranda D, Herrmann MJ. Test-retest reliability of electrophysiological parameters related to cognitive motor control. Clin Neurophysiol 2001; 112:198–204. Fallgatter AJ, Bartsch AJ, Herrmann MJ. Electrophysiological measurements of anterior cingulate function. J Neural Transm 2002;109: 977–88. Heinrich H, Moll GH, Dickhaus H, Kolev V, Yordanova J, Rothenberger A. Time-on-task analysis using wavelet networks in an event-related potential study on attention-deficit hyperactivity disorder. Clin Neurophysiol 2001;112:1280–7. Jasper H. Report of committee on methods of clinical exam in EEG. Electroenceph clin Neurophysiol 1958;10:370 –5. Jodo E, Kayama Y. Relation of a negative ERP component to response inhibition in a Go/Nogo task. Electroenceph clin Neurophysiol 1992; 82:477–82. Konrad K, Gauggel S, Manz A, Scholl M. Inhibitory control in children with traumatic brain injury (TBI) and children with attention deficit/ hyperactivity disorder (ADHD). Brain Inj 2000;14:859–75. Kopp B, Mattler U, Goertz R, Rist F. N2, P3 and the lateralized readiness potential in a nogo task involving selective response priming. Electroenceph clin Neurophysiol 1996;99:19– 27. Lecendreux M, Konofal E, Bouvard M, Falissard B, Mouren-Simeoni MC. Sleep and alertness in children with ADHD. J Child Psychol Psychiatry 2000;41:803 –12. Lehmann D, Faber PL, Achermann P, Jeanmonod D, Gianotti LR, Pizzagalli D. Brain sources of EEG gamma frequency during volitionally medication-induced, altered states of consciousness, and experience of the self. Psychiatry Res 2001;108:111– 21. Mulert C, Gallinat J, Pascual-Marqui R, Dorn H, Frick K, Schlattmann P, Mientus S, Herrmann WM, Winterer G. Reduced event-related current density in the anterior cingulate cortex in schizophrenia. Neuroimage 2001;13:589 –600. Nigg JT. The ADHD response-inhibition deficit as measured by the stop task: replication with DSM-IV combined type, extension, and qualification. J Abnorm Child Psychol 1999;27:393–402. Oldfield RC. The assessment and analysis of handedness: the Edinburgh inventory. Neuropsychologia 1971;9:97–113. Overtoom CC, Verbaten MN, Kemner C, Kenemans JL, van Engeland H, Buitelaar JK, Camfferman G, Koelega HS. Associations between eventrelated potentials and measures of attention and inhibition in the Continuous Performance Task in children with ADHD and normal controls. J Am Acad Child Adolesc Psychiatry 1998;37:977 –85. Pascual-Marqui R. Review of methods for solving the EEG inverse problem. Int J Bioelectromagn 1999;1:75–86.
981
Pascual-Marqui RD, Michel CM, Lehmann D. Low resolution electromagnetic tomography, a new method for localizing electrical activity in the brain. Int J Psychophysiol 1994;18:49 –65. Pascual-Marqui RD, Lehmann D, Koenig T, Kochi K, Merlo MC, Hell D, Koukkou M. Low resolution brain electromagnetic tomography (LORETA) functional imaging in acute, neuroleptic-naive, firstepisode, productive schizophrenia. Psychiatry Res 1999;90:169–79. Pliszka SR, Liotti M, Woldorff MG. Inhibitory control in children with attention-deficit/hyperactivity disorder: event-related potentials identify the processing component and timing of an impaired right-frontal response-inhibition mechanism. Biol Psychiatry 2000;48:238–46. Rosvold HE, Mirsky A, Sarason I, Bransome Jr ED, Beck LH. A continuous performance test of brain damage. J Consult Psychol 1956;20:343–50. Rubia K, Overmeyer S, Taylor E, Brammer M, Williams SCR, Simmons A, Bullmore ET. Hypofrontality in attention deficit hyperactivity disorder during higher-order motor control: a study with functional MRI. Am J Psychiatry 1999;156:891–6. Rubia K, Tylor E, Smith AB, Oksanen H, Overmeyer S, Newman S, Oksannen H. Neuropsychological analyses of impulsiveness in childhood hyperactivity. Br J Psychiatry 2001;179:138 –43. Schachar R, Logan GD. Impulsivity and inhibitory control in normal development and childhood psychopathology. Dev Psychol 1990;26: 710– 20. Schachar R, Mota VL, Logan GD, Tannock R, Klim P. Confirmation of an inhibitory control deficit in attention-deficit/hyperactivity disorder. J Abnorm Child Psychol 2000;28:227–35. Seifert J, Scheuerpflug P, Zillessen KE, Fallgatter AJ, Warnke A. Electrophysiological investigation of the effectiveness of methylphenidate in children with and without ADHD. J Neural Transm 2003;110: 821– 9. Shaywitz SE, Fletcher JM, Shaywitz BA. Issues in definition and classification of attention deficit disorders. Top Lang Disord 1994;14: 1–25. Strik WK, Fallgatter AJ, Brandeis D, Pascual-Marqui R. Three dimensional tomography of event-related potentials during response inhibition: evidence for phasic frontal lobe activation. Electroenceph clin Neurophysiol 1998;108:406 –13. Vaidya CJ, Austin G, Kirkorian G, Ridlehuber HW, Desmond JE, Glover GH, Gabrieli JD. Selective effects of methylphenidate in attention deficit hyperactivity disorder: a functional magnetic resonance study. Proc Natl Acad Sci USA 1998;95:14494–9. Winterer G, Mulert C, Mientus S, Gallinat J, Schlattmann P, Dorn H, Herrmann WM. P300 and LORETA: comparison of normal subjects and schizophrenic patients. Brain Topogr 2001;13:299–313. Yong-Liang G, Robaey P, Karayanidis F, Bourassa M, Pelletier G, Geoffroy G. ERPs and behavioral inhibition in a Go/No-go task in children with attention-deficit hyperactivity disorder. Brain Cogn 2000; 43:215–20. Zillessen KE, Scheuerpflug P, Fallgatter AJ, Strik WK, Warnke A. Changes of the brain electrical fields during the continuous performance test in attention-deficit hyperactivity disorder-boys depending on methylphenidate medication. Clin Neurophysiol 2001; 112:1166–73.