Radiology
Computer Applications Anthony J. Sherbondy, MS Djamila Holmlund, BS Geoffrey D. Rubin, MD Pamela K. Schraedley, PhD Terry Winograd, PhD Sandy Napel, PhD Published online 10.1148/radiol.2342032017 Radiology 2005; 234:391–398 Abbreviations: PACS ⫽ picture archiving and communication system 3D ⫽ three-dimensional 2D ⫽ two-dimensional 1
From the Radiology 3D Laboratory, James H. Clark Center, Stanford University School of Medicine, 318 Campus Dr, Rm S323, Stanford, CA 94305-5450. From the 2002 RSNA Annual Meeting. Received December 15, 2003; revision requested February 23, 2004; revision received April 30; accepted May 24. Supported by the National Institutes of Health 1R01HL67194, the Lucas Foundation, the Packard Foundation, the Phil N. Allen Trust, and the Wallenberg Foundation. Address correspondence to A.J.S. (e-mail:
[email protected]). Authors stated no financial relationship to disclose.
Alternative Input Devices for Efficient Navigation of Large CT Angiography Data Sets1 PURPOSE: To compare devices for the task of navigating through large computed tomographic (CT) data sets at a picture archiving and communication system workstation. MATERIALS AND METHODS: The institutional review board approved this study, and all subjects provided informed consent. Five radiologists were asked to find 25 different vascular targets in three CT angiography data sets (average number of sections, 1025) by using several devices (trackball, tablet, jog-shuttle wheel, and mouse). For each trial, the total time to acquire the targets (T1) was recorded. A secondary study in which 13 nonradiologists performed seven trials with an artificial target inserted at a random location in the same image data was also performed. For each trial, the following items were recorded: time until first target sighting (t2), time to manipulate the device after seeing the target, sections traversed during t2 (d1), time from first sight to target acquisition (t4), sections traversed during t4 (d2), and total trial time. Statistical analysis involved repeated-measures analysis of variance (ANOVA) and pairwise comparisons. RESULTS: Repeated-measures ANOVA revealed that the device used had a significant (P ⬍ .05) effect on T1. Pairwise comparisons revealed that the trackball was significantly slower than the tablet (P ⬍ .05) and marginally slower than the jog-shuttle wheel (P ⬍ .10). Further repeated-measures ANOVA for each secondary outcome measure revealed significant differences between devices for all outcome measures (P ⬍ .005). Pairwise comparisons revealed the trackball to be significantly slower than the other devices in all measures (P ⬍ .05). The trackball was significantly (P ⬍ .05) more accurate than the other devices for d1 and d2. CONCLUSION: The trackball may not be the optimal device for navigation of large CT angiography data sets; the use of other existing devices may improve the efficiency of interpretation of these sets. ©
Author contributions: Guarantor of integrity of entire study, S.N.; study concepts and design, A.J.S., G.D.R., S.N., D.H., T.W.; literature research, T.W., D.H., A.J.S.; experimental studies, A.J.S., D.H., T.W., S.N., G.D.R.; data acquisition, A.J.S., D.H.; data analysis/interpretation, all authors; statistical analysis, P.K.S., S.N., A.J.S.; manuscript preparation and revision/review, all authors; manuscript definition of intellectual content, A.J.S., D.H., T.W., S.N.; manuscript editing, A.J.S., D.H., T.W., G.D.R., S.N.; manuscript final version approval, A.J.S., T.W., G.D.R., S.N. ©
RSNA, 2005
RSNA, 2005
As cross-sectional medical imaging modalities such as computed tomography (CT), magnetic resonance (MR) imaging, and ultrasonography become more sophisticated and as resolution improves, computer-based image review systems are rapidly replacing film or alternator systems for radiologic interpretation. Radiologists commonly use a picture archiving and communication system (PACS), which stores and displays sequences of two-dimensional (2D) images corresponding to sections in an imaging study. With section intervals that are less than 1 mm, many hundreds or even thousands of images are produced in a single examination, limiting the feasibility of traditional side-by-side examination of the images. Although the data are inherently three-dimensional (3D), today’s clinical radiologists rely primarily on reviewing stacks of 2D cross sections that are viewed sequentially. As a result, the third dimension (along the longitudinal axis of the scanner) is mapped onto time by giving the radiologist the ability to move a cutting plane along that axis while seeing a single section at a time on a 2D screen. Skilled radiologists develop the ability to “scroll” rapidly through the images to produce a mental 3D understanding of the structures while being able to see the full detail of each 391
Radiology
individual section. A typical interpretation session involves a good deal of scrolling back and forth over points of interest, as well as larger continuous motions for moving between areas of interest. A typical PACS workstation has one or more electronic monitors, a keyboard, and a trackball that is used as a cursor control and also for controlling the scrolling. The trackball generally has a large diameter (approximately 6 cm) and buttons around the base that are activated for controls. In some implementations, one of the buttons is held down to activate the scrolling mode, in which only one of the trackball’s two degrees of freedom is used, so that the displayed section in the sequence is linearly controlled. As an initial part of a larger study of the integration of 2D and 3D imaging for radiologic analysis of vascular structures, we observed the use of current equipment by radiologists at a major university (Stanford University) teaching hospital. One of our immediate findings was a widespread complaint about repetitive stress to the hand and wrist owing to the constant back-and-forth motion involved in using the trackball. Results of previous studies have shown that a trackball performs more poorly than mouse or stylus devices for other kinds of tasks, such as pointing and dragging (1), but the trade-off of using devices other than a trackball is a complex interaction of device, device parameters, and task (2). Thus, the purpose of our study was to compare devices for the task of navigating through large CT data sets at a PACS workstation.
MATERIALS AND METHODS Workstation To integrate multiple devices into a viewing station, as well as to enable us to take sensitive time measurements of the users’ progress, we designed our own display workstation. For all devices, the workstation consisted of a dual-processor 1-GHz Pentium processor (Intel, Santa Clara, Calif) with 2 GB of main memory, an NVIDIA GeForce 3 graphics card (Nvidia, Santa Clara, Calif) with 64 MB of memory, and Windows NT software (Microsoft, Redmond, Wash). The images were displayed on a Viewsonic VG175 flat panel (Viewsonic, Walnut, Calif). We simulated clinical PACS viewing software that allowed the users to scroll through transverse CT sections with ap392
䡠
Radiology
䡠
February 2005
propriate transfer functions for each of the tested input devices. The viewing station software was developed with C⫹⫹ and OpenGL. The data sets were loaded into memory before the start of each experiment to limit the time required to draw each requested cross section. The cross sections were magnified to a spatial resolution of 1024 ⫻ 1024 pixels within 5 msec of a device event. To achieve consistency in the task, alternative visualizations involving multiplanar reformation or 3D rendering were not used for the image analysis. Regarding the users’ performance, the software was also responsible for making sensitive time measurements of up to 1 msec in significance.
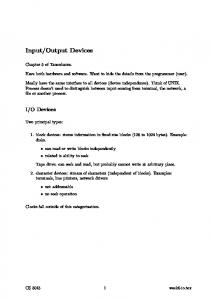
Navigation Devices Figure 1 shows the four devices that we used in the study. They were used in position-control (trackball) and mixed-control (mouse, jog-shuttle wheel, tablet) modes. Position-control is defined in this context as a situation in which the device movement is mapped to the position of the desired cross section in the stack of cross sections comprising the volume. For example, the trackball maps degree rotations into the position of the desired cross section in the stack. A rate-control transfer function relates the device parameter, such as a joystick’s displacement from the neutral position, to the rate at which the cross section moves through the volume. Finally, mixed-control devices provide both control modes. The effectiveness of a control device can be strongly affected by the transfer function that maps control motion and force to display effect (3–5). Although we could not explore the full space or systematically optimize the mappings, we performed an informal initial test of all devices with 13 subjects to identify an acceptable mapping function for each device. The following paragraphs describe the devices and the mappings we used for this study. Trackball (position-control mode).—The transfer function was a linear mapping from rotational position in the forward or backward scroll direction to position in the stack. In addition, the user was required to hold down the left mouse button to activate stack scrolling. Mouse (mixed-control mode).—The ScrollPoint mouse combines a standard mouse with an additional finger-actuated joystick, which is similar to the TrackPoint stick (IBM) found on many laptops. Forward/ backward pressure on the joystick provided rate-controlled motion through the stack.
Figure 1. Navigation devices used in this study. Clockwise from upper left: Graphire pen tablet (Wacom Technology, Vancouver, Wash), trackball (Macally, Irwindale, Calif), ShuttlePro jog-shuttle wheel (Contour Design, Windham, NH), and ScrollPoint mouse (IBM, White Plains, NY).
In addition, the mouse position along the forward/backward direction was mapped linearly to position in the stack. The rate control had a 10% dead zone and a 35% zone of constant two-sections-per-second velocity, with the remaining pressure values mapped linearly from two to 400 sections per second. An approximately linear mechanical force feedback was produced by the springiness of the joystick. Jog-shuttle wheel (mixed-control mode).— The ShuttlePro jog-shuttle wheel is designed for video editing and allows one to view image sequences both in motion and frame-by-frame. The inner jog wheel rotates freely with detents every 36°, advancing the image one frame per detent in the corresponding direction (position map). The outer wheel can be rotated continuously 90° in either direction from a starting position. We mapped the displacement of the outer wheel (in terms of its rotation from 0°) to control the rate of continuous scrolling with seven linearly increasing increments from eight to 400 sections per second (velocity map). A spring provided a force feedback proportional to the displacement. Because the spring actively forces the wheel back to the zero position when no force is applied, it was not necessary to have a dead zone. Tablet and stylus (mixed-control mode).— The Graphire pen tablet provides a 2D surface with a tracked stylus. The stylus also has a sensor for pressure on the tip of the pen; this sensor was not used in our Sherbondy et al
TABLE 1 Anatomic Targets in Each of Three CT Angiography Data Sets Target Length (No. of Sections)
Radiology
Data Set and Anatomic Target Data set 1* Origin of left renal artery Origin of right anterior tibial artery Left dorsalis pedis artery Origin of inferior mesenteric artery Origin of superior mesenteric artery Bifurcation of left tibioperoneal trunk Origin of left superior geniculate artery Origin of left inferior epigastric artery Origin of right superior gluteal artery Right seminal vesicle Data set 2† Right coronary artery pseudoaneurysm Origin of left gastric artery Origin of right inferior epigastric artery Origin of right renal artery Origin of inferior mesenteric artery Origin of median sacral artery Bifurcation of proper hepatic artery Intimal flap within right carotid artery Origin of right medial circumflex femoral artery Left adrenal gland Data set 3‡ Origin of left circumflex coronary artery bypass graft Left external carotid artery Origin of right anterior tibial artery Point of left superficial femoral artery occlusion Right adrenal gland
7 5 2 3 5 3 6 5 4 7 8 3 3 2 3 2 3 19 2 36 3 3 3 4 18
* Data set consisted of 1006 CT angiographic sections obtained in patient with advanced peripheral vascular disease. † Data set consisted of 891 CT angiographic sections obtained in patient with aortic dissection. ‡ Data set consisted of 1177 CT angiographic sections obtained in patient with abdominal aortic aneurysm.
experiments. This device was the most different from the trackball commonly used for this task, and we explored a variety of possibilities for the control mapping. We used two mappings in which the left and the right sides (from a fixed center line) of the tablet had different behaviors, thus creating two distinct “input devices” for assessment. Tablet 1 mapping provided rate control on the right side with a “flick” motion in which the velocity of the pen at the time of liftoff from the tablet controlled scrolling rate. Touching the pen to the left side stopped all motion, and subsequent motions in the Y coordinate controlled position linearly. The goal of tablet 1 mapping was to facilitate rapid scrolling through large distances by means of velocity control, while allowing high precision locally. Tablet 2 mapping provided absolute position control on the right side, with the vertical extent of the tablet mapped onto the longitudinal dimension of the stack. A scaled orthographic volume rendering of the results of a CT angiography study was printed on paper and attached Volume 234
䡠
Number 2
to the right-side tablet area so that touching a position on the rendering moved the viewer to an image close to the corresponding location. As in the first mapping, the left side provided fine-grained relative position control. The goal of tablet 2 mapping was to provide an alternative means of rapid distance traversal by using an absolute position reference instead of velocity control, while maintaining the high local precision yielded by tablet 1 mapping.
Experimental Design Before the experiment, a cardiovascular radiologist (G.D.R.) with 12 years of CT angiography experience selected 25 vascular targets (Table 1) in three CT angiography data sets. These targets were specifically chosen to be targets of clinical relevance to physicians searching for vascular disease. The same radiologist documented the specific images in which the targets appeared. The images had been acquired with an eight– detector row CT scanner and were reconstructed with 1.25-mm section thickness at
0.8-mm increments. One thousand six sections had been obtained in a patient with advanced peripheral vascular disease, 891 sections had been obtained in a patient with aortic dissection, and 1177 sections had been obtained in a patient with an abdominal aortic aneurysm. The targets ranged from one to 45 images in longitudinal (through-plane) extent. Figure 2 shows two targets that the users were asked to find in the data set obtained in the patient with peripheral vascular disease. As required by our institutional review board, which also approved this study, all radiologist subjects signed an informed consent form. In addition, retrospective access to patient images in which all identifiers had been removed was provided, with waiver of informed consent, in a protocol approved by our institutional review board. Each of five radiologists (one woman, four men), who had 5, 5, 3, 3, and 3 years of experience with CT angiography, was seated at the workstation with the images displayed on a 27.7 ⫻ 34.5-cm (1280 ⫻ 1024 resolution) flat-panel display screen and with all of the input devices sitting on the table in front of the screen. The radiologists were made aware that the purpose of the study was to measure their performance with the devices and were instructed to be as efficient and accurate as possible. After undergoing training and becoming familiar with the five input devices, each radiologist performed five trials— one trial per device. Device order was randomized so that each radiologist used the devices in a unique order. This served to control for both the order in which devices were used and the order in which anatomic targets and devices were paired. Each trial involved identifying five anatomic targets from one of the CT angiographic data sets; therefore, each radiologist identified each of the 25 anatomic targets (Table 1) exactly once—five targets per device. Because each target was acquired only once, the order of the anatomic targets was fixed, and case memory was not an issue, so each radiologist could complete the five trials in a single sitting. The radiologists were given 5 minutes to rest between the use of each device. The target identity (eg, “origin of right renal artery”) was spoken by the tester (A.J.S.) to cue the radiologist to find each target. Successful location of a target required that the subject stop at any image that fell within the target’s documented extent. The total time required to acquire the target was automatically Alternative Input Devices
䡠
393
Radiology
quantified as the time from device initiation, as actuated by the radiologist, until a stop button indicating target acquisition was pressed. In addition to measuring the performance of the radiologists using the devices, we also issued a questionnaire to assess the users’ qualitative experience. On the questionnaire, the users were asked to rate the strain and fatigue relating to use of the device on a five-point scale (where a score of 0 meant no fatigue and a score of 5, most fatigue), the usefulness of the device for accomplishing the task, the physical effort demanded by the device, and whether the device felt comfortable in the hand. The users were also asked additional open-ended questions regarding their background with the device and advanced input devices in general, as well as being asked to provide more qualitative descriptions of the characteristics of the devices that they liked and disliked. These additional questions asked about the user’s prior experience with the device, what type of problems they encountered with the device, what part of the tasks they felt could not be accomplished with the device, in what particular part of the body they felt the most strain, and why the device did not help them locate the target.
Secondary (Artificial Target) Test Procedure To gain further insights into the quantitative performance properties of the devices, we designed an additional trial by using a single artificial test target that could be repeatedly assessed in a variety of locations. The goal of this trial was to analyze the sequential search components of navigation, target recognition, and target acquisition. The complexity of understanding and recording these features during the experiment discussed above precluded the measurement of these features with the anatomic targets. Given the same physical setup described above, 13 nonradiologist observers (11 men and two women) between the ages of 22 and 50 who had no previous experience in using a PACS system were asked to locate the center of a 3D polyhedral target that was approximately 2 ⫻ 4 cm in size and embedded in a stack of 769 cross-sectional images produced at a CT examination of the normal abdomen (Fig 3). All voxels in the target were white, except for a central triangular cross section, which was red. The target was oriented so that this red triangle lay in a single plane of the originally ac394
䡠
Radiology
䡠
February 2005
Figure 2. Thin-slab maximum intensity projections from the CT angiography data set obtained in the patient with advanced peripheral vascular disease show two of the 25 anatomic targets used in this study. (a) Thirty-voxel-thick anteroposterior view centered on origin of right anterior tibial artery (three-section extent). (b) Eighty-eight-voxel–thick view midway between anteroposterior and left-right views centered on point of left superficial femoral artery occlusion (four-section extent). Note that readers were asked to find anatomic targets by navigating through transverse image stacks and did not see these or any other type of processed views. The vascular targets are circled in yellow, and the range of acceptable transverse sections is located between the red lines.
quired CT sections. As the participant scrolled through the volume and encountered the target, he or she first saw a small white triangle growing in size until it reached its maximum size and turned red. The triangle then turned white again, shrinking in size until it vanished. After a familiarization trial with each device, the observers performed a sequence of seven trials with that device in which they tried to locate the target as rapidly as possible. Each trial involved the same CT data set, with the location of the target randomly selected for each trial. After they completed the trial for each device, participants were presented with the same written questionnaire that had been presented to the primary test subjects. In addition to the “total time” measurement described above, the software automatically recorded several other measurements for the secondary test: 1. Time to first sight: The time from the start of the trial until the subject reached an image containing any part of the target. 2. Acquisition time: The time from the first sight until the subject first stopped or reversed direction. This is an approxi-
mate measure of the time it took for the subject to react and the computer to register a reaction. 3. Overshoot time: The total time minus the time to first sight. 4. Overshoot distance: The distance from the point at which the subject reversed direction (because he or she had seen the target) until the subject stopped at the target. Distances (in numbers of sections) were calculated as the unsigned sum of all forward and backward motions.
Statistical Analysis For both experiments, we performed a repeated-measures analysis of variance for each outcome measure to determine whether there was an overall effect of the device on that outcome measure, across all devices. When this analysis yielded significant results (P ⬍ .05), it was followed by pairwise comparisons to determine significant differences between devices. Because the outcome measures were not normally distributed, we used logarithmically transformed outcome data for all statistical analyses. The statistical analysis was performed by P.K.S., Sherbondy et al
Secondary Questionnaire Data
Radiology
Regarding responses to a yes or no question about whether there were any overall problems with using a device, pairwise comparisons (Table 5) revealed that use of the jog-shuttle wheel was reported to involve fewer problems than use of the trackball or the mouse. In addition, the trackball scored significantly worse than all other devices in terms of user fatigue, while the mouse scored worse than the jog-shuttle wheel and the tablet (with tablet 1 mapping for all secondary results). Finally, in terms of its assistance to the user performing the task, the trackball was rated significantly better than the mouse, while the jogshuttle wheel was rated better than the mouse and tablet and the mouse was rated significantly worse than the tablet. Figure 3. Location of artificial target in secondary experiment. (a) Front view of 3D target. The polyhedron has a central triangular section with a base of 2 cm and a height of 1.2 cm (display dimensions), and the smaller triangles linearly interpolate to zero in 20 sections on either side of the central triangle. (b) Side view of 3D target (showing every other section). (c, d) Images from abdominal CT angiography data set show target (white triangle in c, red triangle in d) embedded near center of images.
who used SPSS for Windows 11.0.1 (SPSS, Chicago, Ill); all data collection was performed by A.J.S. and D.H.
RESULTS Performance Data A repeated-measures analyses of variance in which the effect of device on total time— collapsed across all targets— was examined yielded a significant overall effect for the device used (F ⫽ 4.31, df ⫽ 4, 16; P ⬍ .05) (Table 2). Pairwise comparisons revealed that the trackball device was marginally slower (P ⬍ .10) than the jog-shuttle wheel and the tablet with tablet 1 mapping and significantly slower (P ⬍ .05) than the tablet with tablet 2 (alternative) mapping. In addition, the mouse was marginally slower than the tablet with tablet 1 mapping. There were no other significant differences among the devices.
Secondary Performance Data Analyses of variance for each of the five outcome measures revealed significant differences in performance between devices (Table 3). Pairwise comparisons revealed a similar pattern of results, in which the trackball was slower than the Volume 234
䡠
Number 2
other four devices, for total time and acquisition time. Overshoot distance and overshoot time showed the opposite pattern of results: Use of the trackball device led to smaller overshoot distance and time than use of the other four devices. The trackball was slower in time to first sight than the mouse. In addition, the mouse had a significantly greater overshoot time than the jog-shuttle wheel and trackball devices. There were no other significant differences among the devices.
Questionnaire Data Pairwise comparisons revealed that the trackball device was reported to cause significantly more strain and fatigue than all other devices (Table 4). The mouse caused more fatigue than either the tablet with tablet 1 mapping or the tablet with tablet 2 mapping. Pairwise comparisons also revealed that in terms of usefulness for accomplishing the task, the mouse was rated as worse than the jogshuttle wheel, the tablet with tablet 1 mapping, and the tablet with tablet 2 mapping, while the trackball scored worse only in comparison with the tablet with tablet 2 mapping.
DISCUSSION Radiologists are spending larger portions of their workday in front of a computer screen, navigating and interpreting data sets of unprecedented size. Although many investigations have focused on image display and interpretation during soft-copy image interpretation, to our knowledge, this is the first investigation to focus on the control aspect of the radiologist-computer interface. Indeed, it is curious that in a world filled with specialized input devices for general computer control, computer gaming, video production, and graphics production (to name a few), vendors of PACS workstations invariably offer either a standard trackball or a three-button mouse for control of increasingly sophisticated CT and MR image navigation systems. Anecdotally, our experience in a busy university practice has resulted in a number of complaints among radiologists of wrist, forearm, and hand soreness when using the trackball. This study was motivated by our desire to make the process of analyzing large cross-sectional data sets both more efficient and more comfortable. In the years since the initial development of the graphical user interface, a number of investigations have explored the relative merits of different input devices for a variety of tasks, including pointing (target acquisition) (4 –7), dragging (1,7), trajectory following (5,7,8), scrolling the contents of a window (9,10), and freehand drawing (7). Other researchers (3,5) have explored the effect of different control-display mappings on speed and accuracy. The dominating theoretic structure behind these investigaAlternative Input Devices
䡠
395
Radiology
tions has been Fitts law (11), which allows one to predict human motion on the basis of target size in a task that involves rapid, aimed movement. Specifically, Fitts found that the total time to acquire the target was logarithmically related to distance when the target size was fixed and logarithmically related to target size when the distance was fixed, and this law has been shown to be applicable not only to the hand-eye ballistic target acquisition task explored by Fitts but also to a variety of other tasks such as scrolling in a document window (9). Although generalizations such as Fitts law apply across devices, they do not provide guidance as to the choice of specific devices. Study results show that there are interactions between device choice, device mapping functions, and task structure. For example, two studies of window scrolling for browsing (9,10) yielded conflicting results on the relative effectiveness of the WheelMouse (Microsoft) and the ScrollPoint mouse (IBM) owing to differences in the transfer function for the wheel and in the specific task characteristics, such as average distance of scrolling. As another example, although variable control-display gain does not improve performance on pointing tasks with a position-control device such as a mouse (4), it has been shown to play a key role in the effectiveness of pointing with a rate-control device such as a TrackPoint stick (3,5) The radiologic scrolling task differs from pointing and trajectory-based tasks because the target is not visible at the beginning of the trial. It is relatively similar to the window-scrolling task but is not identical. First, it differs from standard scrolling (though not from the use of devices such as the WheelMouse and ScrollPoint mouse) in that it does not use a control area (scroll bar) that is acquired by pointing. Second, the relationship between control and screen contents is different in that the screen contains a series of distinct images in which the X-Y location remains fixed and the Z location changes. This is experientially different from an Internet browser window, in which the controller scrolls the contents in the X or Y dimension. Relating the uniqueness of the radiologic scrolling task to the findings of this study, we hypothesize that use of a hybrid device, which integrates a physicalfeedback scrolling device (one that uses, for example, detents or audible “clicks”) with a tablet device would improve the reader’s efficiency and comfort. As the tablet 2 mapping evaluated in this study 396
䡠
Radiology
䡠
February 2005
does, this device would project a volumerendered view acquired in the current patient onto a tablet to facilitate course localization while allowing fine movements with an embedded scrolling wheel, for example. Such a device would relocate many of the movements that would be strenuous with the scrolling wheel (eg, traversing large longitudinal distances) to the “see and touch” interface of the tablet 2 mapping design but would also retain the precision and controllability of the scrolling wheel interface for the fine movements. To be effective, the scrolling wheel would need to be located on the pointing device for the tablet (eg, the pen); alternatively, the pointing device that is currently required would need to be eliminated in favor of a finger tap system. In the meantime, radiologists need to cope with the limitations of existing viewing stations by limiting large-scale movements with the trackball as much as possible. Until dedicated devices are designed, radiologists may find that an alternative commercially available navigation device may be preferable to the one that was supplied with their PACS workstation. Because the majority of these devices interface with the universal serial bus, they are easily swapped with standard devices on a Windows-based PACS workstation. For radiologists to fully benefit from the customization features of some of these devices, some cooperation with the PACS vendor may be required for installing and configuring the specialized drivers that are typically included with these devices. The preliminary results of this study indicate that the currently used device (the trackball) is not a preferable device. In fact, it was the worst of the devices tested, ranking last or next-to-last in speed and subjective measures. This may be due in part to the way in which the trackball is conventionally used, which requires holding down a button while rotating the ball. It is possible that a different interaction design that did not require the button might substantially improve the ratings of the trackball. However, we suspect that a considerable drawback for the trackball is that, as compared with the other devices tested, it requires the user to perform rapid, large, and repetitive motions to traverse large numbers of sections. It is important to note that the trackball’s superiority in precision could be one of the main reasons for its overwhelming presence on viewing stations; however, our study results show it has disadvantages as well,
TABLE 2 Total Time with Each Device Device
Total Time
Trackball* ScrollPoint mouse ShuttlePro jog-shuttle wheel Tablet with tablet 1 mapping Tablet with tablet 2 mapping*
9.96 ⫾ 0.24† 9.79 ⫾ 0.26‡ 9.67 ⫾ 0.21§ 8.99 ⫾ 0.79㛳 9.58 ⫾ 0.14#
Note.—Data are mean total log times (in log seconds) ⫾ standard deviations. * Values for two given devices significantly different (P ⬍ .05) from each other. † Values minimally different from those for ScrollPoint mouse but at least marginally different from those for ShuttlePro jog-shuttle wheel, Tablet with tablet 2 mapping, and Tablet with tablet 1 mapping. ‡ Values minimally different from those for trackball, ShuttlePro jog-shuttle wheel, and Tablet with tablet 2 mapping but at least marginally different (P ⬍ .10) from those for Tablet with tablet 1 mapping. § Values minimally different from those for ScrollPoint mouse, Tablet with tablet 2 mapping, and Tablet with tablet 1 mapping but at least marginally different (P ⬍ .10) from those for trackball. 㛳 Values minimally different from those for ScrollPoint mouse, ShuttlePro jog-shuttle wheel, and Tablet with tablet 1 mapping but at least marginally different (P ⬍ .10) from those for trackball. # Values minimally different from those for ShuttlePro jog-shuttle wheel and Tablet with tablet 2 mapping but at least marginally different (P ⬍ .10) from those for trackball and ScrollPoint mouse.
including the possibility of causing strain during large repetitive motions. As in many studies of human-computer interaction, objective performance measures do not fully correlate with subjective measures. The ScrollPoint mouse had the best times, but was one of the two lowest-rated devices in terms of both assessments of physical effort and subjective performance. This was apparently due to the frustration with overshooting, since the isometric finger joystick is hard to control, and the fact that subjects were not comfortable switching from fine finger movements to larger arm movements in order to switch from rate to position control. On the other hand, the ShuttlePro jog-shuttle wheel ranked highest in the subjective ratings and was among the set of fastest devices (the devices in that set were not significantly faster than one another). It is likely that the ease of accurate positioning with the inner wheel, which led to the lowest overshoot distances, was a key factor in the ease and satisfaction with this device. On the basis of the verbal questionnaire responses, we hypothesize that posSherbondy et al
TABLE 3 Performance Measurements for Each Device in Secondary (Artificial Target) Study
Radiology
Parameter time†
Total Time to first sight§ Acquisition time† Overshoot time** Overshoot distance†
Trackball
ScrollPoint Mouse
ShuttlePro Jog-Shuttle Wheel
Tablet
F Value*
9.93 ⫾ 0.2 9.67 ⫾ 0.3 7.63 ⫾ 0.3 3.01 ⫾ 0.1 ⫺0.66 ⫾ 1.4
9.30 ⫾ 0.2 8.13 ⫾ 0.4 6.76 ⫾ 0.3 3.97 ⫾ 0.3 3.85 ⫾ 1.1
9.43 ⫾ 0.2 8.77 ⫾ 0.3 6.94 ⫾ 0.3 3.60 ⫾ 0.4 2.99 ⫾ 1.1
9.49 ⫾ 0.2 8.62 ⫾ 0.3 6.84 ⫾ 0.1 3.97 ⫾ 0.1 4.07 ⫾ 0.4
5.54‡ 3.83㛳 20.87# 23.27# 32.97#
Note.—Unless otherwise specified, data are mean values (in log seconds) ⫾ standard deviations. * df ⫽ 4, 20 for all. † For total time, acquisition time, and overshoot distance, values for trackball significantly different (P ⬍ .05) from those for other three devices. ‡ P ⬍ .01. § Values for trackball significantly different (P ⬍ .05) from those for ScrollPoint mouse. 㛳 P ⬍ .05. # P ⬍ .001. ** Differences in values between any two devices among trackball, ScrollPoint mouse, and ShuttlePro jog-shuttle wheel were significantly different (P ⬍ .05). Differences in values between trackball and Tablet devices also were significantly different (P ⬍ .05).
TABLE 4 Selected Questionnaire Results Parameter or Question
Trackball
ScrollPoint Mouse
ShuttlePro Jog-Shuttle Wheel
Tablet with Tablet 1 Mapping
Tablet with Tablet 2 Mapping
F Value*
Strain and/or fatigue experienced while using the device† Is device usable for accomplishing task?‡
4.8 ⫾ 0.4 1 (20)
2.8 ⫾ 1.3 0
1.6 ⫾ 1.7 4 (80)
0.6 ⫾ 0.9 4 (80)
0.4 ⫾ 0.5 5 (100)
29.10 8.17
* df ⫽ 4, 16 and P ⬍ .001 for both values. † Data are mean grades (on a scale from 0 to 5, where 0 means no fatigue and 5 means most fatigue) ⫾ standard deviations. Differences between ScrollPoint mouse and all other devices except trackball were significant (P ⬍ .05). Differences between trackball and Tablet with tablet 2 mapping also were significant (P ⬍ .05). ‡ Data are numbers of five radiologists answering “yes.” Data in parentheses are percentages. Differences between any two devices among trackball, Tablet with tablet 1 mapping, and Scrollpoint mouse were significant (P ⬍ .05). Differences between trackball and ShuttlePro jog-shuttle wheel, between trackball and Tablet with tablet 2 mapping, and between ScrollPoint mouse and Tablet with tablet 2 mapping also were significant (P ⬍ .05).
TABLE 5 Selected Secondary Questionnaire Results Question or Parameter
Trackball
ScrollPoint Mouse
ShuttlePro Jog-Shuttle Wheel
Tablet
Any problems overall?*† Strain and/or fatigue experienced while using the device§ Is device usable for accomplishing task?*#
84.6
92.3
38.5
76.9
3.6 ⫾ 1.3 85
2.1 ⫾ 1.6 31
1.2 ⫾ 1.0 100
0.7 ⫾ 0.8 69
F Value 4.77 (df ⫽ 4, 48) ‡ 11.33 (df ⫽ 4, 36) 㛳 7.71 (df ⫽ 4, 48) 㛳
* Data are percentages of respondents answering “yes.” † Differences between ShuttlePro jog-shuttle wheel and both trackball and ScrollPoint mouse devices were significant. ‡ P ⬍ .01. § Data are mean grades (on a scale from 0 to 5, where 0 means no fatigue and 5 means most fatigue) ⫾ standard deviations. The following differences were significant: between trackball and all other devices, between ScrollPoint mouse and all other devices, between ShuttlePro jog-shuttle wheel and all other devices except Tablet, and between Tablet and all other devices except ShuttlePro jog-shuttle wheel. 㛳 P ⬍ .001. # The following differences were significant: between ScrollPoint mouse and all other devices, between ShuttlePro jog-shuttle wheel and Tablet, and between Tablet and all other devices except trackball.
itive subjective measures are correlated with a sense of “controllability” (a feeling that the device is doing what the user wants), which is only loosely correlated with the measured speed and precision. Given the high ranking of the jogshuttle wheel, we hypothesize that for this kind of task, velocity control together with fine position control is a betVolume 234
䡠
Number 2
ter combination than either type of control alone. The fact that haptic feedback (with spring force for velocity and detents for position) is provided appears to be a part of its success. Further experiments could better isolate the importance of this feedback. The tablet appears to have potential, but there are many more degrees of free-
dom in the mapping, from stylus position and motion to control of the scan. Subjects exhibited very different strategies for using the two components we provided, and we suspect that their performance and satisfaction with the tablet device were strongly affected by their choice of strategies. One interface method that we proposed that was well accepted Alternative Input Devices
䡠
397
Radiology
by the radiologists was the volume-rendering navigation glyph. This scaled glyph allowed the users quick access to cross sections in the stack on the basis of anatomic knowledge. The glyph was judged to be extremely helpful in providing anatomic navigation of the data while also allowing the user to perform fine movements without lifting the stylus. To compare the tablet more fully with the other devices, it will be necessary to further evaluate different ways to map it. In considering the limitations of our study, we are not able to give definitive arguments as to which devices are best for radiologic image analysis. First, so that we could perform a controlled study with a feasible amount of resources, we chose artificial tasks rather than actual radiologic analyses. In general, radiologic interpretation requires the use of additional and possibly different strategies, depending on the specific questions that need to be answered for each particular patient. For example, in addition to the kinds of location tasks we explored, radiologists often perform less-structured scanning for items of interest. In addition, to enable each radiologist to complete his or her tasks in one sitting, we did not require them to use the same device for each anatomic target. As a result of this, however, we were not able to compare results of the radiologists’ use of a given device on the same targets. Second, we used a setup that duplicated only the scrolling function of the PACS workstation, without addressing all of the additional tools that are part of actual radiographic interfaces (eg, patient care, image brightness and contrast control, measuring tools, the ability to locate and compare a previously acquired image with a current one). Although our study results show that efficiency and ergonomics can be improved for the tasks we studied, the effect on the entire interpretive process of replacing (or adding) particular devices would need to be evaluated. Third, we measured speed and precision relative to a fixed target, rather than performing results-oriented measurements
398
䡠
Radiology
䡠
February 2005
of the effectiveness of a radiologic examination. Medically meaningful measures are much more difficult to validate and to apply in controlled studies. In the secondary (artificial target) study, in which quantitative performance measures for target acquisition were derived, we examined device performance in a nonmedical task so that we could use non–medically trained subjects, whose time was more accessible. Finally, we did not explore a wide variety of mappings from device interaction to effect, and this might have had substantial effects on both performance and satisfaction. In addition, we chose to implement a trackball scrolling system that was similar to that used with Centricity PACS workstations (GE Medical Systems, Milwaukee, Wis) because these workstations were the most familiar to our readers. This system requires the user to hold down the left button while scrolling with the trackball and has advantages when it come to switching between scrolling and pointing with a cursor. Although it is possible that removing this requirement would reduce discomfort for a “scrolling only” task, we wanted to compare alternative devices in the emulation of an existing, familiar one. In conclusion, our study results suggest that the trackball, which is used with virtually every viewing station today, may not be the optimal device for navigation of large CT angiography data sets and that other existing devices may be more efficient. Our longer-term goals are to measure and improve the effectiveness of display and control technologies in practice. This will require substantial numbers of trials involving radiologists performing realistic tasks and outcome measures that are based on medically relevant goals. From a broader point of view, this research is part of a project to investigate displays and input devices that integrate 2D and 3D visualization. The scrolling task that now dominates the analysis of volumetric scan data will be augmented (though probably not completely replaced) by the real-time control of 3D renderings. Further studies will be based on the design of these inte-
grated systems and the incorporation of devices into them. Acknowledgments: We thank Shumin Zhai for advice and help. We also thank Terry Desser, MD, and Larry Chow.
References 1. MacKenzie I, Sellen A, Buxton W. A comparison of input devices in elemental pointing and dragging tasks. In: Proceedings of the 1991 SIGCHI Conference on Human Factors in Computing Systems. New Orleans, La: SIGCHI, 1991; 161–166. 2. Card S, Mackinlay J, Robertson G. A morphological analysis of the design space of input devices. ACM Trans Inf Syst 1991; 9:99 –122. 3. Barrett R, Selker E, Rutledge J, Olyha R. The negative inertia: a dynamic pointing function. In: Proceedings of the 1995 SIGCHI Conference on Human Factors in Computing Systems. Denver, Colo: SIGCHI, 1995; 316 –317. 4. Jellinek H, Card S. Powermice and user performance. In: Proceedings of the 1990 SIGCHI Conference on Human Factors in Computing Systems. Seattle, Wash: SIGCHI, 1990; 213–220. 5. Rutledge J, Selker E. Force-to-motion functions for pointing. IFIP Interact 1990; 701–706. 6. Card S, English W, Burr B. Evaluation of mouse, rate-controlled isometric joystick, step keys, and text keys for text selection on a CRT. Ergonomics 1978; 21:601– 613. 7. Douglas S, Kirkpatrick A, MacKenzie J. Testing pointing device performance and user assessment with the ISO 9241. In: Part 9 Standard Proceedings of the 1999 SIGCHI Conference on Human Factors in Computing Systems. Pittsburgh, Pa: SIGCHI, 1999; 215–222. 8. Accot J, Zhai S. Beyond Fitts’ law: models for trajectory-based HCI tasks. In: Proceedings of the 1997 SIGCHI Conference on Human Factors in Computing Systems. Atlanta, Ga: SIGCHI, 1997; 295– 302. 9. Hinckley K, Cutrell E, Bathiche S, Muss T. Quantitative analysis of scrolling techniques. In: Proceedings of the 2002 SIGCHI Conference on Human Factors in Computing Systems. Minneapolis, Minn: SIGCHI, 2002; 65–72. 10. Zhai S, Smith B, Selker E. Improving browsing performance: a study of four input devices for scrolling and pointing tasks. IFIP Interact 1997; 286 –292. 11. MacKenzie I. Fitts’ law as a research and design tool in human-computer interaction. Human-Computer Interaction 1992; 7:91–139.
Sherbondy et al