Research
AMASS: Software for Automatically Validating the Quality of MS/MS Spectrum from SEQUEST Results*□ S
Wei Sun‡§¶, Fuxin Li储, Jue Wang储, Dexian Zheng‡§, and Youhe Gao‡§¶ Time-consuming and experience-dependent manual validations of tandem mass spectra are usually applied to SEQUEST results. This inefficient method has become a significant bottleneck for MS/MS data processing. Here we introduce a program AMASS (advanced mass spectrum screener), which can filter the tandem mass spectra of SEQUEST results by measuring the match percentage of high-abundant ions and the continuity of matched fragment ions in b, y series. Compared with Xcorr and DeltaCn filter, AMASS can increase the number of positives and reduce the number of negatives in 22 datasets generated from 18 known protein mixtures. It effectively removed most noisy spectra, false interpretations, and about half of poor fragmentation spectra, and AMASS can work synergistically with Rscore filter. We believe the use of AMASS and Rscore can result in a more accurate identification of peptide MS/MS spectra and reduce the time and energy for manual validation. Molecular & Cellular Proteomics 3:1194 –1199, 2004.
With the development of proteomics, MS/MS has been used to determine the protein components of complex mixtures (1– 4). In such an approach, proteins are digested into peptides by enzymes and subjected to reverse-phase LC. Then eluted peptides are ionized and mainly fragmented into b and y ions. Tandem mass spectra produced by mass spectrometer can be used for peptide identifications. A common way for peptide identifications is to search tandem mass spectra against a sequence database to find the best matching peptide in the database (5). Several database search programs such as SEQUEST (6), Mascot (7), MS-tag (8), and Sonar (9) have been introduced to assign peptides to MS/MS spectra. These programs use various scoring schemes to distinguish correct identifications from false positives (FP),1 From the ‡Proteomics Research Center, §National Key Laboratory of Medical Molecular, Biology, Institute of Basic Medical Sciences, Chinese Academy of Medical, Sciences/ Peking Union Medical College, Beijing, People’s Republic of China 100005; and 储Institute of Automation, Chinese Academy of Sciences, Beijing, People’s Republic of China 100080 Received, September 3, 2004, and in revised form, October 12, 2004 Published, MCP Papers in Press, October 15, 2004, DOI 10.1074/mcp.M400120-MCP200 1 The abbreviations used are: FP, false positives; AMASS, advanced mass spectrum screener; TP, true positives.
1194
Molecular & Cellular Proteomics 3.12
but they are known to produce a significant number of incorrect peptide assignments (10). The process of validating peptide assignments often relies on time-consuming and experience-dependent manual verification. Recently, several groups applied different algorithms to evaluate SEQUEST database search results (11–15). Moore et al. described a probabilistic algorithm called Qscore (11), which was based on a probability model. It included the expected number of matches from a given database, the effective database size, a correction for indistinguishable peptides, and a measurement of match quality. Anderson et al. (12) applied the support vector machine learning algorithm to distinguish between correctly and incorrectly identified peptides by using a vector of parameters describing each peptide identification including SEQUEST output, considering observed data (peptide mass, precursor ion intensity) and SEQUEST-calculated statistics (such as the parameters Xcorr, DeltaCn, Sp, and RSp). Keller et al. (13, 14) employed another machine learning algorithm, the expectation maximization algorithm. It incorporated four SEQUEST scores plus the number of tryptic peptide termini present in the matched peptides to estimate a peptide probability. Probabilities of the peptides with correct assignments are combined together to estimate the probability of the corresponding protein. More recently, Razumovskaya et al. (15) developed another method, which combines a neural network and a statistical model, for normalizing SEQUEST scores, and also for providing a reliability estimate for each SEQUEST hit. The above methods can improve the separation between correct and incorrect peptides and reduced the number of SEQUEST protein identifications that have to be validated manually. The above approaches are based on different algorithms. Here we address the same problem using a different approach. Manual validation of a peptide match often makes use of various spectral properties to discriminate positives from negatives (16, 17). We put manual validation rules into a computer program and to filter SEQUEST outputs automatically. Two rules are important for manual validation: the fragment ions should be clearly above baseline noise and the spectrum should have continuous b or y ion matches (16). Facts underlying in these rules are “highly abundant fragment ions are more likely to be signals” and “the MS/MS spectrum of an optimally fragmented peptide should theoretically contain continuous fragment ions of b or y series.” Based on
© 2004 by The American Society for Biochemistry and Molecular Biology, Inc. This paper is available on line at http://www.mcponline.org
AMASS Automatically Validate SEQUEST Results
TABLE I Protein components of control mixtures A and B used in the experiments (10) Protein
Source
Sequence accession no.
Concentration in A (nM)
Concentration in B (nM)
1. Bovine -casein 2. Bovine carbonic anydrase 3. Bovine cytochrome c 4. Bovine -lactoglobulin 5. Bovine ␣-lactalbumin 6. Bovine serum albumin 7. Chick ovalbumin 8. Bovine transferrin 9. Rabbit GAPDH 10. Rabbit phosphorylase b 11. E. coli -galactosidase 12. Bovine ␥-actin 13. Bovine catalase 14. Rabbit myosin (heavy and light chains) 15. E. coli alkaline phosphatase 16. Horse myoglobin 17. B. lichenformis ␣-amylase 18. S. cerevisiae phosphomannose isomerase
Sigma C6905 Sigma C2522 Sigma C2037 Sigma L0130 Sigma L6010 Sigma A3059 Sigma A2512 Sigma T0178 Sigma G2267 Prozyme Prozyme Sigma A3653 Sigma C40 Prozyme Prozyme Sigma M0630 Sigma A4551 Prozyme
P02666 P00921 P00006 P02754 P00711 P02769 P01012 Q29443 P46406 P00489 P00722 ATBOG P00432 P02562a P00634 P02188 Q04977 P29952
1,000 1,000 400 200 100 400 4 100 20 10 4 2 20 2 200 40 40 10
100 100 120 1,000 300 120 12 300 6 100 12 20 6 20 1,000 4 4 100
a
Additional accession numbers for rabbit myosin heavy and light chains: P02603, P02602, P24732, Q28641, P04460, P04461, P35748, and Q99105.
these two facts, two functions were programmed to calculate the match percentage of high-abundance fragment ions and continuity of b or y ion series in AMASS (advanced mass spectrum screener) software. Tandem mass spectra datasets of known protein mixtures searched with SEQUEST were filtered by AMASS with relaxed Xcorr and DeltaCn settings, and the result was compared with that of using common Xcorr and DeltaCn settings alone (17). EXPERIMENTAL PROCEDURES
Experimental Dataset—The experimental datasets were obtained as in Ref. 10. The datasets were produced by analyzing a mixture of 18 proteins by LC-MS/MS. Two mixtures, A and B, were obtained by mixing together 18 purified proteins of different physicochemical properties (Sigma, St. Louis, MO; Prozyme, San Leandro, CA) in the indicated relative molar amounts (Table I). The complex peptide mixtures were analyzed by LC-MS using an electron ionization ion trap mass spectrometer (ThermoFinnigan, San Jose, CA) using a standard top-down data-dependent ion selection approach, wherein the mostabundant peak above background level is selected and a concurrent 3 min of dynamic exclusion is employed to prevent reselection of previously selected ions. Peptides were eluted by an ACN gradient (10 –35% over 60 min) across a 10-cm 100-mm C18 column while the ion trap mass spectrometer continuously selected peptides for CID via alternating MS and MS/MS modes. To increase duty cycle, the zoom scan function capable of determining charge state was not employed. In total, 14 LC/MS/MS runs were performed on mixture A, using 10 ml (A1), 5 ml (A2), 1 ml (A3), or 2.5 ml (A4 –14) of 1:5 diluted mixture. Eight LC/MS/MS runs were performed on mixture B, using 1 ml (B1–2), 2 ml (B3– 4), 5 ml (B5– 6), or 7.5 ml (B7– 8) of 1:20 diluted mixture. SEQUEST Search and Xcorr filter—The 22 raw files were searched against the protein database with Bioworks 3.1 from ThermoFinnigan. The protein database was composed of 88,374 proteins including the
Swiss-Prot human protein database and 18 proteins in the mixture. Tryptic cleavages at only Lys or Arg and up to two missed internal cleavage sites in a peptide were allowed. The maximal allowed uncertainty in the precursor ion mass was m/z 1.4. Peptides from m/z 400 to 4,500 and precursor charge states of ⫹1, ⫹2, and ⫹3 were allowed. The minimum total ion current required for precursor ion fragmentation was 1.0 ⫻ 105 and the minimum number of ions was 25. Altogether, 47,907 spectra were searched against database. The output files were filtered by Xcorr filter (Xcorr⫹DeltaCn). The following value of XCorr and DeltaCn were as common setting (17): DeltaCn ⱖ 0.1, Xcorr: Xcorr ⱖ1.9 for ⫹1 charged peptides, with fully tryptic ends Xcorr ⱖ2.2 for ⫹2 charged peptides, with partially and fully tryptic ends Xcorr ⱖ3.75 for ⫹3 charged peptides, with partially and fully tryptic ends XCorr filters used were derived from the common setting with constant DeltaCn. For example, an 80% XCorr filter meant 0.8⫻ (common setting). Thus the filter was actually: XCorr ⱖ 0.8 ⫻ 1.9 ⫽ 1.52 for ⫹1 charge peptides, and so forth. The XCorr filters examined in the analysis were 0 –120%, in a step of 10%. Positive and Negative Peptides—Positive and negative peptides were selected according to the rule that whether it was one part of 18 known proteins. Only the first scoring peptide was used to judge the presence of one particular protein. If the peptide passing above the Xcorr filter was a part of the 18 known proteins, it was counted as a positive peptide. Otherwise, it was counted as a negative peptide. In calculating the number of positives, common contaminants were not included, which decreased the number of positives. In our experiments such a conserved strategy was adopted because we only wanted to prove AMASS parameters’ effect in the most conservative settings. Computer Programs: AMASS—The following rules are commonly applied in the manual validation of mass spectra (16): 1) the MS/MS spectrum must be of good quality with fragment ions clearly above baseline noise; and 2) there must be some continuity to the b or y ion series.
Molecular & Cellular Proteomics 3.12
1195
AMASS Automatically Validate SEQUEST Results
Based on these rules, we proposed two functions. 1. Match percentage, MatchPct: MatchPct ⫽ [number of matched daughter ions with relative abundance higher than RACutoff/number of total daughter ions with relative abundance higher than RACutoff] ⫻ 100% RACutoff (Relative Abundance Cutoff) was a number between 0 and 100 serving as a relative abundance cutoff point in MS/MS spectra. For example, when RACutoff was 20, the ions with relative abundance higher than 20 were included in the calculation of MatchPct. When a lower RACutoff value was used, more fragment ions were included in the calculation. A higher MatchPct value means that more fragments ions above a certain RACutoff were matched. Commonly, the higher the value of MatchPct, the better the quality of the identification. 2. Continuity, Cont:
冘 l
Cont ⫽
共b共i兲 ⫹ y共i兲 ⫹ f共i兲兲
i⫽1
/
共l ⫺ 1兲2 ⫹ l ⴱ 100,
where f(i) ⫽ 1 if the i b or y series ion is matched, 0 otherwise; b(i) ⫽ n2 if the (i ⫹ 1)th b series ion is not matched and n ⫽ the number of continuously matched b ions immediately before the ith (including the ith ion), 0 otherwise; y(i) ⫽ n2 if the (i ⫹ 1)th y series ion is not matched and n ⫽ the number of continuously matched y ions immediately before the ith (including the ith ion), 0 otherwise; and l ⫽ the amino acid number of the peptide. Cont adds up the number of continuously matched b series and y series ions to the second degree and the total number of matched ions, and is then normalized by dividing the maximum possible value of the addition and multiplying 100. A higher Cont value means more continuous matching fragment ions. When calculating MatchPct and Cont, all matched daughter ions under different charge state were taken into account. In order to determine the distinguishing value of AMASS on the number of positive and negative peptides, the values of RACutoff, MatchPct, and Cont were ranged from 0 to 90 and applied to SEQUEST results as a secondary filter besides corresponding Xcorr filter with incremental steps of 10. The proper values of parameters should maximize the number of positive peptide without sacrificing the rate of positive. The values of AMASS parameters, RACutoff, MatchPct, and Cont, were estimated experimentally as 20, 60, and 40, respectively (data are shown in supplement 1). th
RESULTS
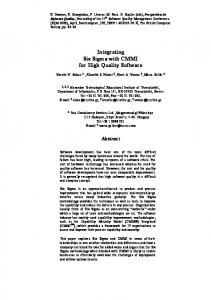
The Effect of AMASS—Fig. 1 shows the result of the total number of positives and negatives with four different filters: 1) Xcorr filter, 2) MatchPct⫹Xcorr filter, 3) Cont⫹Xcorr filter, and 4) AMASS(MatchPct⫹Cont)⫹Xcorr filter and Xcorr filter ranged from 70 to 120% of the common setting. When lowering the Xcorr filter, the number of negatives increased dramatically and the positive rate decreased. But when MatchPct, Cont, or both were used, more positives and a higher positive rate could be achieved with almost the same number of negatives even with lower common Xcorr filter settings. For example, the number of positives and negatives were 1,429 and 99 with common settings and increased to 2,034 and 341 with an 80% Xcorr filter. When AMASS was employed (the values for RACutoff, MatchPct, and Cont were 20, 60, and 40, respectively), the number of positives was 1,725 with the similar number of negatives (94) as with common settings.
1196
Molecular & Cellular Proteomics 3.12
FIG. 1. The comparision of XCorr filter and XcorrⴙAMASS filter under different proportions of common XCorr filter settings (70 – 120%). With a similar number of negatives (94 and 99 for AMASS and common setting, respectively) as the common setting, AMASS can achieve more positives with 80% common setting (1,725 and 1,429 for AMASS and common setting, respectively). The values of AMASS parameter RACutoff, MatchPct, and Cont are 20, 60, and 40, respectively.
Fig. 1 also shows that the effects of MatchPct and Cont were similar and the combination of them—AMASS— had even better effect, which indicated that the MatchPct and Cont remove different type of false identifications. The Effect of Each AMASS Parameter—The above result was based on the hypothesis that all the peptides belonging to 18 known proteins were positives. However, positives with poor quality should be considered as FP with manual validation. So in order to further prove the effect of AMASS on manual validation result, all of the 22 datasets under common Xcorr filter settings were manually assigned as true positives (TP) or FP according to above manual validation rules (16). If a tandem mass spectrum assigned to a peptide meets manual validation rules, the peptide was considered as TP, otherwise it was considered as FP. In order to evaluate different effects of each AMASS parameter, according our experience the tandem mass spectra assigned to FP were classified into three categories. The first category was poor fragmentation, with much of the ion current in few major peaks. The second one was noisy spectra, which had low signal-to-noise ratio. The third one was false interpretation, which had major peaks and good signal-tonoise ratio, but most of matched ions were noises. The final list of TP assignments consisted of 1,295 peptides, confidently identified in the mixture. The list of FP assignments contains 233 peptide hits by SEQUEST (73, 81, and 79 to the third category negatives, respectively). We assigned a fewer number of TP peptide identifications than Keller’s result (10). The reason was that they assigned all the outputs to peptide identification without any filter, while we only assigned the peptides passing the common Xcorr filter.
AMASS Automatically Validate SEQUEST Results
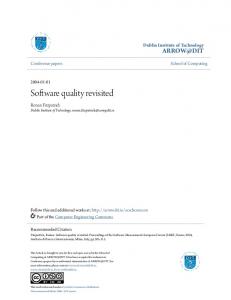
Fig. 2A shows the number of TP and FP under different filters, which indicated that AMASS could decrease the number of FP at little cost of TP. Fig. 2B shows the different effect of AMASS parameters on the three categories of FP. Cont and MatchPct filtered out most of noisy and false interpretation FP, but only about half of the poor fragmentation ones. The signal-to-noise ratio in noisy MS/MS spectra was low, so most of ions were of high abundance. While the number of match ions was relative few, the values of MatchPct were lower than in TP and such FP could be effectively removed. For false interpretation spectra, because most of matched ions were noise, the MatchPct was very low and could also be filtered out by AMASS. Some of the above two types of FP might be filtered out by Cont because of poor continuity. But for some poor fragmentation spectra, if a few high-abundance ions were matched, the value of MatchPct might be higher than 80. Moreover, due to random match the continuity might also be up to 60 or even higher. Therefore, such poor fragmentation spectra were difficult for AMASS to filter out. Combining MatchPct and Cont, more FP, most of noisy and false interpretation, and about half of poor fragmentation FP were filtered out, which proved that effects of those parameters were different. Combination of AMASS and Rscore—Our previous work, Rscore (18), was a score evaluating the relative quality in cross-correlation and matched intensity percentage. The notion underlying RScore was that TP peptide identifications should be better than other randomly generated identifications. In this sense, for poor fragmentation spectra, the few high-abundance ions were likely to be matched in both the first and the second scoring peptide. In this way, the relative quality difference of them would be little and could be filtered out by Rscore. Because AMASS works best in the other two kinds of FP, AMASS and Rscore should be complementary to each other. Fig. 3 shows that when the two filters were used, the Xcorr filter could be lowered to 70% of common settings and more positives (1,790) could be achieved with a similar number of negatives (102) compared with common settings (99). This result was better than that of using each filter singly. DISCUSSION
Different SEQUEST parameters, different algorithms (11– 15), and new parameters (12) were used to evaluate the quality of SEQUEST results. But up to now how to remove maximal negatives while keeping as many as possible positives was still a problem. AMASS was proposed based on the two manual validation rules. In our results, AMASS could dramatically increase the number of positives and the positive rate with lower than common Xcorr filter settings. Manual validation results showed that it can filter out most noisy MS/MS spectra, false interpretation, and about half of poor fragmentation FP at low cost of TP. When AMASS and Rscore were both applied, more positives could be achieved with similar number of
FIG. 2. The effect of different filters on the TP and FP. A, the number of TP and FP under different filters. B, the number of three kinds of FP under different filters. The value of the Xcorr filter is the common setting and the value of Cont and MatchPct is 40 and 60, respectively. The AMASS setting is the combination of MatchPct and Cont with above values.
negatives. Such result proved that high-quality positive identification could be achieved with AMASS, but it also failed to completely separate TP from FP. AMASS made use of a threshold model. We chose the threshold model because we would want TP results to satisfy all the AMASS criteria. AMASS criteria are independent such that a high value in one parameter cannot compensate for the deficit in other parameters (for instance, a perfect Cont score would not guarantee the matched ions are signals). A linear model does not have this property. Other models may also be used in tackling this problem. A quadratic model would be able to approximate it, but we decided to preserve the simplicity of the model, because a simple model would have better generalization ability (19) (supplement 2). To our knowledge, none of present parameters or algorithms can completely distinguish positives from negatives. The possible reason is that the search results may not be a binary yes or no answer (11). Because many peptide matches
Molecular & Cellular Proteomics 3.12
1197
AMASS Automatically Validate SEQUEST Results
Some notices should be mentioned here. First, our result were based on 18 known protein datasets, but the proteomic research result of tissue or protein complex was much more complex than 18 known protein mixture, and whether our result can be applied to complex result or not should be further proved. Second, different Xcorr are used with the different charge state and length of precursor ion, so there are different settings about them (16 –18, 20). The one used in our article was the one producing a relatively higher positive rate (10), but other setting may have better performance than the one. Last, the database we used was only the human database and not Swiss-Prot and the nonredundant NCBI, which may produce more random matches. CONCLUSION
FIG. 3. Comparision of XCorr filter, XcorrⴙAMASS filter, XcorrⴙRscore filter, and Xcorrⴙ AMASSⴙRscore filter under different proportions of common XCorr filter settings (70 –120%). With a similar number of negatives (102 and 99 for AMASS⫹Rscore and common setting, respectively) compared with common settings, AMASS⫹Rscore can achieve more positives with 70% common setting (1,790 and 1,429 for AMASS⫹Rscore and common setting, respectively). The values of RACutoff, MatchPct, Cont, and Rscore were 20, 60, 40, and 2.7, respectively.
are of intermediate quality, using score cutoffs and/or algorithms to force intermediate quality results into positive or negative categories actually interferes with the goal of maximizing the data extracted from the system. Even with different perfect evaluation parameters of the detailed information of tandem mass spectra, peptide sequence, database, etc. and various algorithms, it is of great possibility not to completely distinguish positives from negatives. Because the final aim of proteomics research is the identification of proteins, the probability of proteins correctly identified is more important than that of peptide. Therefore, several steps may be applied to the problem. First, new parameters and algorithms are still necessary to be proposed to improve the distinguishing efficiency. Second, the probability of protein identifications can be estimated based on peptide evaluations, as has been done by Keller’s and Razumovskaya’s groups (14, 15). Third, with present parameters and algorithms, in order to achieve high-creditability protein identification, one approach is to use relatively stringent filters, such as higher Xcorr filter setting (17), two or more peptides for one protein identification (11), or a combination of different algorithms. The other is that the protein identification should be reproducible during multiple experiments for a conclusive result. There are two other rules for manual validation (16): the y ions that correspond to a proline residue should be intense ions, and unidentified, intense fragment ions correspond to the loss of one or two amino acids from one of the ends of the peptide. Because the two rules were difficult to be quantified using functions as MatchPct and Cont, they were not considered in the present AMASS program. Our future work will take them into account.
1198
Molecular & Cellular Proteomics 3.12
We programmed manual validation rules into AMASS to distinguish positives from negatives of SEQUEST results. Our results from known protein mixture datasets show that AMASS can reduce the number of negative identifications and improve the positive rate and it works synergistically with Rscore filter. We believe that AMASS can reduce the time and energy for manual validation. AMASS can be freely requested via E-mail (
[email protected]) for nonprofit users. Acknowledgments—We thank Andrew Keller of Washington University for offering the datasets and database. * This work was partially supported by grants from Key Project for International Corporation (no. 2002AA229031), Pilot Study for Key Basic Research Project (no. 2002CCA04100), National Basic Research Program (no. 2004CB520804), and National Natural Science Foundation (nos. 30270657 and 30230150). The costs of publication of this article were defrayed in part by the payment of page charges. This article must therefore be hereby marked “advertisement” in accordance with 18 U.S.C. Section 1734 solely to indicate this fact. □ S The on-line version of this manuscript (available at http://www. mcponline.org) contains supplemental material. ¶ To whom correspondence should be addressed: 5 Dong Dan San Tiao, Institute of Basic Medical Sciences, Chinese Academy of Medical Sciences/Peking Union Medical College, Beijing, People’s Republic of China 100005. Tel.: 086-010-6787-2251-206; Fax: 086010-6787-2251-201; E-mail:
[email protected], sunwei1018@ hotmail.com. REFERENCES 1. Gavin, A., Bosche, M., Krause, R., Grandi, P., Marzioch, M., Bauer, A., Schultz, J., Rick, J. M., Michon, A. M., Cruciat, C. M., Remor, M., Hofert, C., Schelder, M., Brajenovic, M., Ruffner, H., Merino, A., Klein, K., Hudak, M., Dickson, D., Rudi, T., Gnau, V., Bauch, A., Bastuck, S., Huhse, B., Leutwein, C., Heurtier, M. A., Copley, R. R., Edelmann, A., Querfurth, E., Rybin, V., Drewes, G., Raida, M., Bouwmeester, T., Bork, P., Seraphin, B., Kuster, B., Neubauer, G., and Superti-Furga, G. (2002) Functional organization of the yeast proteome by systematic analysis of protein complexes. Nature 415, 141–147 2. Ho, Y., Gruhler, A., Heilbut, A., Moore, L., Adams, S. L., Millar, A., Taylor, P., Bennett, K., Boutilier, K., Yang, L., Wolting, C., Donaldson, I., Schandorff, S., Shewnarane, J., Vo, M., Taggart, J., Goudreault, M., Muskat, B., Alfarano, C., Dewar, D., Lin, Z., Michalickova, K., Willems, A. R., Sassi, H., Nielsen, P. A., Rasmussen, K. J., Andersen, J. R., Johansen, L. E., Hansen, L. H., Jespersen, H., Podtelejnikov, A., Nielsen, E., Crawford, J., Poulsen, V., Sorensen, B. D., Matthiesen, J., Hendrickson, R. C., Gleeson, F., Pawson, T., Moran, M. F., Durocher, D., Mann, M., Hogue, C. W.,
AMASS Automatically Validate SEQUEST Results
3.
4.
5. 6.
7.
8.
9.
10.
11.
Figeys, D., and Tyers, M. (2002) Systematic identification of protein complexes in Saccharomyces cerevisiae by mass spectrometry. Nature 415, 180 –183 Blagoev, B., Kratchmarova, I., Ong, S. E., Nielsen, M., Foster, L. J., and Mann, M. (2003) A proteomics strategy to elucidate functional proteinprotein interactions applied to EGF signaling. Nat. Biotechnol. 21, 315–318 Taylor, S. W., Fahy, E., Zhang, B., Glenn, G. M., Warnock, D. E., Wiley, S., Murphy, A. N., Gaucher, S. P., Capaldi, R. A., Gibson, B. W., and Ghosh, S. S. (2003) Characterization of the human heart mitochondrial proteome. Nat. Biotechnol. 21, 281–286 Fenyo, D. (2000) Identifying the proteome: Software tools. Curr. Opin. Biotechnol. 11, 391–395 Eng, J. K., McCormack, A. L., and Yates, J. R., III (1994) An approach to correlate tandem mass spectral data of peptides with amino acid sequences in a protein database. J. Am. Soc. Mass Spectrom. 5, 976 –989 Perkins, D. N., Pappin, D. J. C., Creasy, D. M., and Cottrell, J. S. (1999) Probability-based protein identification by searching sequence databases using mass spectrometry data. Electrophoresis 20, 3551–3567 Clauser, K. R., Baker, P., and Burlingame, A. L. (1999) Role of accurate mass measurement (⫾10 ppm) in protein identification strategies employing MS or MS/MS and database searching. Anal. Chem, 71, 2871–2882 Field, H. I., Fenyo, D., and Beavis, R. C. (2002) RADARS, a bioinformatics solution that automates proteome mass spectral analysis, optimises protein identification, and archives data in a relational database. Proteomics 2, 36 – 47 Keller, A. D., Purvine, S., Nesvizhskii, A. I., Stolyar, S., Goodlett, D. R., and Kolker, E. (2002) Experimental protein mixture for validating tandem mass spectral analysis. Omics 6, 207–212 Moore, R., Young, M., and Lee, T. (2002) Qscore: An algorithm for evalu-
12.
13.
14.
15.
16.
17.
18.
19. 20.
ating SEQUEST database search results. J. Am. Soc. Mass Spectrom. 13, 378 –386 Anderson, D. C., Li, W. Q., Payan, D. G., and Noble, W. S. (2003) A new algorithm for the evaluation of shotgun peptide sequencing in proteomics: Support vector machine classification of peptide MS/MS spectra and SEQUEST scores. J. Proteome Res. 2, 137–146 Keller, A., Nesvizhskii, A., Kolker, E., and Aebersold, R. (2002) Empirical statistical model to estimate the accuracy of peptide identifications made by MS/MS and database search. Anal. Chem. 74, 5383–5392 Nesvizhskii, A., Keller, A., Kolker, E., and Aebersold, R. (2003) A statistical model for identifying proteins by tandem mass spectrometry. Anal. Chem. 75, 4646 – 4658 Razumovskaya, J., Olman, V., Xu, D., Uberbacher, E. C., VerBerkmoes, N. C., Hettich, R. L., and Xu, Y. (2004) A computational method for assessing peptide-identification reliability in tandem mass spectrometry analysis with SEQUEST. Proteomics 4, 961–969 Link, A. J., Eng, J., Schieltz, D. M., Carmack, E., Mize, G. J., Morris, D. R., Garvik, B. M., and Yates, J. R. 3rd. (1999) Direct analysis of protein complexes using mass spectrometry. Nat. Biotechnol. 17, 676 – 682 Washburn, M. P., Wolters, D., and Yates, J. R., 3rd (2001) Large-scale analysis of the yeast proteome by multidimensional protein identification technology. Nat. Biotechnol. 19, 242–247 Li, F. X., Sun, W., Gao, Y. H., and Wang, J. (2004) Rscore: A peptide randomicity score for evaluating tandem mass spectra. Rapid Commun Mass Spectrom, 18, 1655–1659 Vapnik, V. N. (1995) The Nature of Statistical Learning Theory. SpringerVerlag, Berlin. Peng, J. M., Elias, J. E., Thoreen, C. C., Licklider, L. J., and Gygi, S. P. (2003) Evaluation of multidimensional chromatography coupled with tandem mass spectrometry (LC/LC-MS/MS) for large-scale protein analysis: The yeast proteome. J. Proteome Res. 2, 43–50
Molecular & Cellular Proteomics 3.12
1199