minerals Article
Ambient Temperature Flotation of Sedimentary Phosphate Ore Using Cottonseed Oil as a Collector Yaoyang Ruan 1 , Zeqiang Zhang 2 , Huihua Luo 2 , Chunqiao Xiao 3 , Fang Zhou 3 and Ruan Chi 1,3, * 1 2 3
*
School of Minerals Processing and Bioengineering, Central South University, Changsha 410083, China;
[email protected] School of Resource and Civil Engineering, Wuhan Institute of Technology, Wuhan 430073, China;
[email protected] (Z.Z.);
[email protected] (H.L.) School of Chemical Engineering and Pharmacy, Wuhan Institute of Technology, Wuhan 430073, China;
[email protected] (C.X.);
[email protected] (F.Z.) Correspondence:
[email protected]; Tel.: +86-27-8919-5682
Academic Editor: Massimiliano Zanin Received: 17 March 2017; Accepted: 18 April 2017; Published: 26 April 2017
Abstract: The mid-low grade sedimentary phosphate ore, abundant in silicate and carbonate gangue minerals, exhibits a poor processability. It is conventionally enriched using high temperature flotation to remove silicate gangues with fatty acid as a collector. Cottonseed oil has been proved to be an efficient collector for achieving ambient temperature flotation of the sedimentary phosphate ore used in this study. Flotation kinetics was investigated to ascertain the excellent collecting performance of cottonseed oil, as compared with oleic acid, and the phosphate flotation fitted well with the first-order flotation model. Based on the analysis of flotation reagent effect on the direct flotation process using the response surface methodology (RSM), a closed circuit of direct-reverse flotation for stepwise removing silicate and carbonate gangues from the sedimentary phosphate ore was established. Consequently, a required high quality of phosphate concentrate containing 30.16% P2 O5 was obtained, with a recovery of 90.90%. Scanning electron microscopy (SEM) and X-ray diffraction analysis (XRD) of the flotation products confirmed that the majority of silicate and carbonate gangues were effectively removed from the concentrate products. Keywords: cottonseed oil; sedimentary phosphate ore; flotation; ambient temperature
1. Introduction Phosphate ore is a vital nonrenewable and strategic resource widely used in manufacturing fertilizers, detergents, pesticides, animal fodder, and other phosphorous-based chemicals [1]. More than 75% of the phosphate resources in the world are distributed as sedimentary deposits [2]. Among these, the majority is a sedimentary phosphate ore characterized by a mid-low grade and a cryptocrystalline structure. They coexist with silicate and carbonate gangues such as quartz, dolomite, calcite, etc., and thus have a poor processability [3]. Therefore, the beneficiation and upgrade of this kind of sedimentary phosphate ore is of great significance to meet the marketable requirements of the phosphate industry and to further alleviate the resource scarcity in the world. Froth flotation is considered as the most effective process for the beneficiation of the sedimentary phosphate ore, due to the high efficiency of removing silicate and carbonate gangue minerals [4,5]. Reverse flotation is effective and is usually applied to remove carbonate gangues from phosphate ores with sulfuric acid, with phosphoric acid being used as a pH regulator and depressant [6,7]. In the meantime, there are two typical flotation processes for the removal of silicate gangues from phosphate ores with different types of collectors. A reverse flotation process with cationic collectors is used to Minerals 2017, 7, 65; doi:10.3390/min7050065
www.mdpi.com/journal/minerals
Minerals 2017, 7, 65
2 of 14
float silicate gangue minerals, while the phosphate minerals are depressed in a weak acidic medium environment [8]. However, this method always generates a froth concentrate with a high viscosity caused by the common cationic collectors, resulting in the difficulty of filtrating the float products [9,10]. Therefore, efforts have been paid to the direct flotation process with anionic collectors, which can overcome the disadvantages of the reverse flotation process and which displays a better filtration performance of the corresponding froth products. Fatty acids are the main traditional anionic collectors used for the flotation of non-sulphide ores [11]. However, their application suffers from sensitivity to slimes and ions, an increased collector price, relatively high consumption due to their very low solubility in water, and a high temperature requirement [12]. Flotation operations are generally carried out at room temperatures, or at temperatures less than 30 ◦ C. An increasing operation temperature would incur expensive flotation separation, especially for the separation of silicate gangues in the direct flotation process of sedimentary phosphate ores [13]. Therefore, searching for collectors which can achieve the ambient flotation of phosphate ores is a future direction for improving the flotation separation efficiency of phosphate ores. Vegetable oils have recently been investigated as an economically and environmentally friendly alternative collector in selective flotation. Such vegetable oils include soybean oil [14,15], canola and palm oils [16], jojoba oil [17], etc. Cottonseed oil has an advantage of containing a relatively high level of unsaturated compounds, especially polyunsaturated fatty acids (linoleic acid and linolenic acid). This unique feature of cottonseed oil results in an excellent solubility in pulp, without the need to raise the flotation temperature. This study aimed to investigate the potential application of cottonseed oil as an alternative collector in the ambient temperature flotation of sedimentary phosphate ore. A flotation kinetics study was conducted to elucidate the more advantageous properties of cottonseed oil compared to that of oleic acid, thereby establishing the most suitable flotation model. Then, batch flotation experiments were performed to probe the effects of flotation reagents on the beneficiation efficiency and to obtain the proper flotation conditions by a response surface methodology and factorial experimental analysis. Consequently, a direct-reverse flotation closed circuit has been established to simulate the actual industrial flotation process. The goal was to reach the target of the content and recovery of P2 O5 in a flotation concentrate, with values above 30% and 90%, respectively. To understand the fundamental mechanisms of the process, the changes in the mineral phases and surface morphology of the phosphate ore before and after the flotation process were examined by scanning electron microscopy (SEM) and X-ray diffraction (XRD) analysis. 2. Materials and Methods 2.1. Materials 2.1.1. Sedimentary Phosphate Ore The sedimentary phosphate ore was derived from Yichang, Hubei province, in China, and its main chemical and mineral compositions are presented in Tables 1 and 2, respectively. Table 1 showed that the raw ore was a typical calcareous and siliceous phosphate ore characterized by a middle grade of 23.34% P2 O5 , with a relatively high content of SiO2 (22.15%) and MgO (2.50%). As shown in Table 2, hydroxyapatite was the main phosphate mineral, with a content of more than 67%, while muscovite, quartz, dolomite, and feldspar were the major gangue minerals accounting for about 26% of the ore. The size distribution and chemical analysis of the sedimentary phosphate ore are summarized in Table 3. The results showed that P2 O5 was distributed almost uniformly in different size fractions, instead of being enriched in any particular fractions. Because of this reason, the sedimentary phosphate ore cannot be selectively beneficiated through physical classification, and needs further processing.
Minerals 2017, 7, 65
3 of 14
Table 1. The chemical compositions of the phosphate ore by X-ray fluorescence analysis (wt %). Component
P2 O5
MgO
SiO2
CaO
Fe2 O3
Content
23.34
2.50
22.15
32.13
1.43
Component
Al2 O3
Na2 O
K2 O
F
LOI a
Content
4.42
0.47
1.61
1.46
10.49
LOI a : Loss on ignition.
Table 2. The modal mineralogy of the phosphate ore by mineral liberation analysis (wt %). Mineral
Hydroxyapatite
Muscovite
Quartz
Dolomite
Feldspar
Content
67.64
9.45
5.72
4.48
5.82
Mineral
Calcite
Albite
Hematite
Whitlockite
Others
Content
1.22
1.72
0.79
0.74
2.42
Note: Other components include pyrite, barite, kyanite, diopside, and wollastonite.
Table 3. The size distribution and chemical analysis of the phosphate ore. Fraction (µm)
Yield (%)
Grade (%P2 O5 )
Distributions (%)
+74 −74 + 47 −47 + 38 −38 + 30 −30 Total
19.24 20.35 18.15 3.76 38.50 100.00
26.93 26.02 24.01 24.46 20.02 23.46
22.09 22.57 18.58 3.92 32.84 100.00
2.1.2. Reagents Sodium carbonate (Na2 CO3 ) and sulfuric acid (H2 SO4 ) were used as pH regulators, while sodium silicate (Na2 SiO3 ) and citric acid were used as depressants of silicate and phosphate minerals, respectively. Cottonseed oil (iodine value 135) was purchased from the local market. Its components were analyzed by gas chromatography and are listed in Table 4. The main components of cottonseed oil were oleic acid and linoleic acid, with a combined content of over 85%. After having been saponified by sodium hydroxide, cottonseed oil soap was used as a collector for the flotation experiments in this study. All of the reagents except the cottonseed oil were analytical grade. Table 4. The main components of cottonseed oil (wt %). Components
Palmitic Acid
Stearic Acid
Oleic Acid
Linoleic Acid
Linolenic Acid
Content
3.55
8.45
27.92
57.32
2.61
2.2. Flotation Experiments The samples used in the flotation were ground to about 80%, passing 74 µm. The flotation experiments were carried out in a 0.5 L laboratory flotation cell with a pulp density of about 36% solid, at a temperature of 25 ◦ C. The pulp was conditioned at a rotor speed of 2000 rpm, and a conditioning time of 2 min was used for each reagent (pH regulator, depressant, cottonseed oil soap). Flotation continued for 5 min. The collected concentrate and tailings were filtered, dried, and weighed. Then, the representative samples obtained from each product by quartering techniques were analyzed for the phosphate and magnesium content (to calculate the removal ratio of the carbonate minerals) by X-ray fluorescence analysis. The grade and recovery of the valuable minerals have usually been used to evaluate the selectivity and efficiency of the separation process. However, this was not sufficient for determining the optimum
Minerals 2017, 7, 65
4 of 14
Minerals 2017, 7, 65
4 of 14
conditions, due to the inverse relationship between them. In order to investigate the flotation efficiency effectively, the overall beneficiation efficiency ε −was γ calculated by the Hancock formula, which is E = × 100% (1) given below. ε max ε −-γ γ 0 E= × 100% (1) ε max − γ where ε and γ were the recovery of P2O5 and the yield0 of the phosphate concentrate, respectively. εmax where and γ were the recovery of P2of O5Pand thethe yield of the phosphate respectively. was theεtheoretical maximum recovery 2O5 for phosphate ore and γ0concentrate, was the theoretical yield ε was the theoretical maximum recovery of P O for the phosphate ore and γ was the theoretical 2 5 0 ofmax the flotation concentrate. yieldSubstituting of the flotation concentrate. equations ε = β·γ/α and εmax = β0·γ0/α into Equation (1), obtained an expression for Substituting equations ε β·γ/α and εmax = β0 ·γ0 /α into Equation (1), obtained an expression for the beneficiation efficiency, as=follows: the beneficiation efficiency, as follows:
(β − α )γ ( β − α)γ × 100% E =(β 0 - α )γ 0× 100%
E =
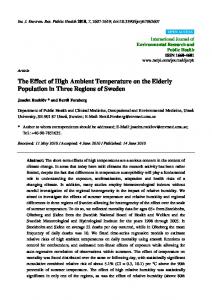
(2) (2) ( β 0 − α)γ0 where α and β were the grade of the raw ore and the flotation concentrate, respectively, and β0 was where α and β were the grade of the raw ore and the flotation concentrate, respectively, and β0 was the the theoretical grade of the apatite (41.36 wt % P2O5 by the chemical assaying of a single pure mineral). theoretical grade of the apatite (41.36 wt % P2 O5 by the chemical assaying of a single pure mineral). The theoretical yield of concentrate γ0 could be calculated by the equation γ0 = α/β0. The theoretical yield of concentrate γ0 could be calculated by the equation γ0 = α/β0 . 2.3. 2.3. Mineralogical Mineralogical Analysis Analysis Mineralogical Mineralogical analysis analysis for for the the samples samples including including the the raw raw material material and and flotation flotation concentrate concentrate was was conducted by coupling X-ray diffraction (XRD, D8 ADVANCE, Bruker, Karlsruhe, Germany) with conducted by coupling X-ray diffraction (XRD, D8 ADVANCE, Bruker, Karlsruhe, Germany) with scanning scanning electron electronmicroscopy microscopy(SEM, (SEM,JSM-5510LV, JSM-5510LV, Japan JapanElectron ElectronOptics OpticsLaboratory, Laboratory,Tokyo, Tokyo,Japan). Japan). SEM was used to investigate the surface morphology of solid samples, and XRD was applied for SEM was used to investigate the surface morphology of solid samples, and XRD was applied for the the mineral mineral phase phase analysis. analysis. 3. 3. Results Results and and Discussion Discussion 3.1. 3.1. Flotation Flotation Kinetics Kinetics of of Sedimentary Sedimentary Phosphate Phosphate Ore Ore The The results results of of the the phosphate phosphate flotation flotation as as the the function function of of the the sodium sodium oleate oleate and and cottonseed cottonseed oil oil concentration in Figure Figure 1. 1. ItIt can can be beconcluded concludedthat thatthe theequilibrium equilibriumtime timewas wasabout about4 4min min. concentration are shown in at ◦ C), at ambient temperature °C), regardless collector type and dosage. This value increased ambient temperature (25(25 regardless of of thethe collector type and itsits dosage. This value increased to to 6 min. as the pulp temperature rose to ◦40 6 min as the pulp temperature rose to 40 C.°C.
Figure Figure1. 1.Flotation Flotationkinetics kineticsof ofsedimentary sedimentaryphosphate phosphate ore ore under under different different conditions. conditions.
As can be seen from Figure 1, the recovery of P2O5 in the concentrate increased sharply with the As can be seen from Figure 1, the recovery of P2 O5 in the concentrate increased sharply with the increase of the collector dosage and pulp temperature in the first 3–4 min of flotation. The recovery, increase of the collector dosage and pulp temperature in the first 3–4 min of flotation. The recovery, using cottonseed oil soap at a dosage of 1 kg/t and a pulp temperature of 25 °C, was much higher than that of sodium oleate under the same condition. It approached a recovery using a sodium oleate dosage of 2 kg/t at 25 °C, or sodium oleate dosage of 1 kg/t at 40 °C. It was evident that the cottonseed
Minerals 2017, 7, 65
5 of 14
using cottonseed oil soap at a dosage of 1 kg/t and a pulp temperature of 25 ◦ C, was much higher than that of sodium oleate under the same condition. It approached a recovery using a sodium oleate dosage of 2 kg/t at 25 ◦ C, or sodium oleate dosage of 1 kg/t at 40 ◦ C. It was evident that the cottonseed oil soap had a more satisfactory collecting performance at ambient temperature than sodium oleate when studying the phosphate flotation. This was probably attributed to a higher unsaturation degree of the cottonseed oil (iodine value 135) when compared with the oleic acid (iodine value 85~89), leading to a faster solubility and dispersion in the pulp. In order to elucidate the relationship between the various parameters, the viz. collector type, pulp temperature, collector dosage, and the recovery of P2 O5 in the phosphate flotation process, the data shown in Figure 1 was fitted to different flotation models, including a classical first-order model, fully mixed reactor model, and second-order kinetic model [18–20]. The statistical program Statgraphics Centurion (Statpoint Technologies, The Plains, VA, USA) was used to correlate data for the non-linear regression of each kinetic model [21]. Table 5 presents the results of the first-order model for each flotation condition, and the corresponding fitting curves of the models are also shown in Figure 1. According to the values of the correlation coefficient (R2 ) of each kinetics model in Table 5, the classical first-order model demonstrated a good fit to the experimental data, especially for the condition of using cottonseed oil soap as the collector. It should be pointed out that the model for sodium oleate (40 ◦ C, 1 kg/t) was established when R∞ was predetermined by 100%, because the value of R∞ obtained by non-linear regression had exceeded 100%. Table 5. Classical first-order model (r = R∞ × [1 − exp(−kt)]) for various conditions. No.
Flotation Conditions
Formula
R2
1 2 3 4
cottonseed oil soap, 25 ◦ C, 1 kg/t sodium oleate, 25 ◦ C, 1 kg/t sodium oleate, 25 ◦ C, 2 kg/t sodium oleate, 40 ◦ C, 1 kg/t
r = 94.95 × [1 − exp(−0.6251t)] r = 75.97 × [1 − exp(−0.4997t)] r = 96.03 × [1 − exp(−0.6711t)] r = 100 × [1 − exp(−0.4178t)]
0.9968 0.9861 0.9870 0.9839
Note: r is P2 O5 recovery of concentrate, R∞ represents the ultimate recovery; k is the flotation rate constant and R2 is the correlation coefficient.
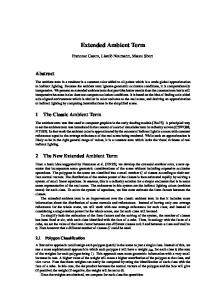
The results in Table 5 also show that increasing the collector dosage and pulp temperature contributed to the enhancement of the ultimate recovery of P2 O5 . The flotation rate of constant k at a pulp temperature of 25 ◦ C was in this order: 2 kg/t sodium oleate > 1 kg/t cottonseed oil soap > 1 kg/t sodium oleate, which was identical to the flotation results shown in Figure 1. It is worth noting that the flotation rate constant at 25 ◦ C, 1 kg/t (k = 0.4994) for oleate, was higher than that at 40 ◦ C, 1 kg/t (k = 0.4178), as shown in Table 5. This was verified and explained in the previous literature [13], by the fact that increasing the temperature would reduce the viscosity of water and enhance the elutriation of the gangues back to the pulp, and thus caused the decrease of the flotation rate with the augment of temperature. The grade and recovery of the phosphate concentrate in the function of sodium oleate and cottonseed oil under different conditions are shown in Figure 2. When sodium oleate was used as a collector in the phosphate flotation, the P2 O5 grade of the flotation concentrate decreased gradually with the increase of the pulp temperature and collector dosage. However, the recovery of P2 O5 increased dramatically, to more than 93% (Figure 2c,d), which is much higher than the 73% value seen for the dosage of 1 kg/t at ambient temperature (Figure 2b). However, a more desirable phosphate concentrate (Figure 2a) was obtained with the grade of 27.63% and recovery of 91.62%, when using cottonseed oil soap as a collector at a low dosage of 1 kg/t and a pulp temperature of 25 ◦ C. Thus, cottonseed oil would be considered as an ideal alternative collector in the phosphate industry due to its excellent flotation performance and selectivity, even at ambient temperature.
Minerals 2017, 7, 65
6 of 14
Minerals 2017, 7, 65
6 of 14
Figure 2. Grade and P2O5 recovery of phosphate concentrates for sedimentary phosphate ore under
Figure 2. Grade and P2 O5 recovery of phosphate concentrates for sedimentary phosphate ore under different conditions (a) cottonseed oil soap, 25 °C, 1 kg/t; (b) sodium oleate, 25 °C, 1 kg/t; (c) sodium different conditions (a) cottonseed oil soap, 25 ◦ C, 1 kg/t; (b) sodium oleate, 25 ◦ C, 1 kg/t; (c) sodium oleate, 25 °C, 2 kg/t; (d) sodium oleate, 40 °C, 1 kg/t. oleate, 25 ◦ C, 2 kg/t; (d) sodium oleate, 40 ◦ C, 1 kg/t.
3.2. The Direct Flotation of Sedimentary Phosphate Ore
3.2. The Direct Flotation of Sedimentary Phosphate Ore As seen from the above section, cottonseed oil soap has a better flotation performance than the sodium theabove flotation of the cottonseed sedimentaryoil phosphate Thus,flotation the cottonseed oil soap was As seenoleate fromin the section, soap hasores. a better performance than the applied in the direct flotation process aiming at removing the silicate gangues from the sedimentary sodium oleate in the flotation of the sedimentary phosphate ores. Thus, the cottonseed oil soap was phosphate ore. applied in the direct flotation process aiming at removing the silicate gangues from the sedimentary phosphate ore. 3.2.1. Response Surface Methodology Analysis Using aSurface responseMethodology surface methodology (RSM) to design the experiments, the optimum flotation 3.2.1. Response Analysis parameters can be obtained by the minimum number of experiments compared with the traditional Using a experiments, response surface to design the optimum factorial whichmethodology demanded an (RSM) investigation of allthe theexperiments, possible combinations [22,23].flotation In parameters can be obtained of experiments compared witha the the direct flotation processby ofthe the minimum phosphate number ore, especially the fine-particle sized one, hightraditional pulp factorial experiments, whichtodemanded an investigation of allenergy the possible combinations [22,23]. temperature was required improve the solubility and activation of the reagents. In this case, the reagent dosage became the most significant factor for the removal of silicate minerals from the In the direct flotation process of the phosphate ore, especially the fine-particle sized one, a high pulp sedimentary when thethe pulp temperature determined at 25of°C. three-factor temperature wasphosphate required ore to improve solubility andwas activation energy theAreagents. In this three-level Box-Behnken design based on the RSM was performed, and its experimental scheme and from case, the reagent dosage became the most significant factor for the removal of silicate minerals corresponding flotation results are shown in Table 6. ◦
the sedimentary phosphate ore when the pulp temperature was determined at 25 C. A three-factor three-level Box-Behnken design based on the RSM was performed, and its experimental scheme and Table 6. Experimental scheme and flotation results. corresponding flotation results are shown in Table 6. No.
Na2CO3 (kg/t)
1 2 3 No. 4 5 16 27 38 49 5 10 6 11 7 12 8 13 9 14 10 15 11 16 12 17
5 7 7 Na2 CO 7 3 (kg/t) 5 75 77 77 77 95 77 7 9 7 7 7 9 9 9 7 5 9 5
Yield Grade Recovery (%) (%) (%) Table 6. Experimental scheme flotation results. 4 1.0 78.19 and 26.44 88.24 7 1.0 70.56 28.40 84.46 10 1.5 76.86 28.18 91.67 Yield Grade Recovery Na2 SiO Collector (kg/t) 85.09 4 3 (kg/t) 1.5 26.62 96.81 (%) (%) (%) 7 1.5 79.40 27.26 92.67 78.19 28.31 26.44 88.24 7 4 1.0 1.0 69.74 83.71 70.56 26.43 28.40 84.46 4 7 0.5 1.0 54.04 60.30 28.18 91.67 10 10 0.5 1.5 5.8876.86 18.38 4.57 85.09 28.14 26.62 96.81 7 4 1.0 1.5 72.26 87.24 79.40 27.33 27.26 92.67 4 7 1.0 1.5 81.62 93.60 69.74 28.15 28.31 83.71 7 7 1.0 1.0 70.94 84.24 4 0.5 54.04 26.43 60.30 7 0.5 51.67 28.46 61.67 10 0.5 5.88 18.38 4.57 7 1.0 69.86 28.75 83.72 7 1.0 72.26 28.14 87.24 10 1.0 57.89 28.22 69.87 4 1.0 81.62 27.33 93.60 7 1.5 77.33 27.76 91.58 7 1.0 70.94 28.15 84.24 7 0.5 23.42 24.41 24.08 7 0.5 51.67 28.46 61.67 10 1.0 18.37 20.12 15.68
Na2SiO3 (kg/t)
Collector (kg/t)
Beneficiation Efficiency (%) 23.19 32.59 34.56 Beneficiation Efficiency 27.00 (%) 30.49 23.19 32.50 32.59 14.65 34.56 −3.07 27.00 34.33 30.49 28.27 32.50 31.15 14.65 23.62 −3.07 33.00 34.33 27.56 28.27 32.88 31.15 1.54 23.62 −6.26
13 7 7 1.0 69.86 28.75 83.72 33.00 14 9 10 1.0 57.89 28.22 69.87 27.56 15 To verify 9 7 1.5 77.33the 27.76 91.58 32.88(Na2CO3 the mathematical relationship between three independent variables 16 5 7 0.5 23.42 24.41 24.08 1.54 dosage, Na2SiO 3 dosage, collector dosage) and the response of the beneficiation efficiency, a quadratic 17 5 10 1.0 18.37 20.12 15.68 −6.26
model was established on the basis of the data in Table 6.
To verify the mathematical relationship between the three independent variables (Na2 CO3 dosage, Na2 SiO3 dosage, collector dosage) and the response of the beneficiation efficiency, a quadratic model was established on the basis of the data in Table 6.
Minerals 2017, 7, 65
7 of 14
Minerals E, 2017, % 7,=65−87.96 + 19.18A + 0.01 × B + 68.96 × C + 1.20 × A × B − 4.92 × A × C 7 of 14
+4.21 × B × C − 1.33 × A2 − 1.02 × B2 − 20.97 × C2
E, % = −87.96 + 19.18A + 0.01 × B + 68.96 × C + 1.20 × A × B − 4.92 × A × C 2 − 20.97 × C2 + 4.21 × BA, × CB,−and 1.33C×represented A2 − 1.02 × Bthe where E was the beneficiation efficiency; linear effects of sodium carbonate, where E was efficiency; A, B, AC, and and C represented theinteraction linear effects of sodium sodium silicate, andthe thebeneficiation collector, respectively; AB, BC were the effects of the three 2 2 2 carbonate, sodium silicate, and the collector, respectively; AB, AC, and BC were the interaction effects corresponding factors; and A , B , and C were the quadratic effects of each factor. 2, B2, and C2 were the quadratic effects of each factor. of the three corresponding factors; and A For the estimation of the significance of the model, the analysis of variance (ANOVA) [24] was For the estimation of the of the theare analysis of in variance (ANOVA) [24] wasof the applied using Design-Expert 8.0significance software and themodel, results shown Table 7. The accuracy applied using Design-Expert 8.0 software and the results are shown in Table 7. The accuracy of the model was found to be excellent, with an R-square value of 0.9659 [25]. The Model F-value of 22.05 model was found to be excellent, with an R-square value of 0.9659 [25]. The Model F-value of 22.05 implied that the model was significant, as the value of “Prob. > F” was less than 0.05, indicating that implied that the model was significant, as the value of “Prob. > F” was less than 0.05, indicating that the model terms were significant. This mainand andinteraction interaction effects ofof allthe of above the above the model terms were significant. Thismeant meantthat that the the main effects of all variables havehave a great influence onon the flotation variables a great influence the flotationprocess. process. Table 7. Analysis ofofthe ofthe thequadratic quadratic model. Table 7. Analysis thevariance variance (ANOVA) (ANOVA) of model. Source Sum of Squares Sum of Squares Model 2793.96 Model A 2793.96 501.97 A 501.97203.21 B B 203.21 C 972.18 C 972.18 AB AB 206.50206.50 AC AC 96.92 96.92 BC BC 159.77159.77 A2 119.99119.99 A2 B2 355.28355.28 B2 115.75115.75 C2 C2 Residual 98.55 98.55 Residual Lack ofLack fit of fit 93.34 93.34 Pure error 5.20 5.20 Pure error Corrected total 2892.51 Corrected total 2892.51 Source
df df 9 91 11 1 1 1 11 11 11 11 11 11 77 33 44 16 16
Mean Square F Value Prob. > F Mean Square F Value Prob. > F 310.44 22.05 0.0002 significant 310.44 significant 501.97 35.6622.05 0.00060.0002 501.97 203.21 14.4335.66 0.00670.0006 203.21 14.43 0.0067 972.18 69.06