Amplitude modulation sensitivity as a mechanism for increment detectiona) Frederick J. Gallunb兲 and Ervin R. Hafter Department of Psychology, University of California, Berkeley, California 94720-1650
共Received 12 April 2005; revised 4 April 2006; accepted 4 April 2006兲 Detectability of a tonal signal added to a tonal masker increases with increasing duration 共“temporal integration”兲, up to some maximum duration. Initially assumed to be some form of energy integration over time, this phenomenon is now often described as the result of a statistical “multiple looks” process. For continuous maskers, listeners may also use a mechanism sensitive to changes in stimulus intensity, possibly a result of inherent sensitivity to amplitude modulation 共AM兲. In order to examine this hypothesis, change detection was investigated in the presence of AM maskers presented at either the same carrier frequency as the target signal or at a distant frequency. The results are compatible with the hypothesis that listeners detect intensity increments by using change-detection mechanisms 共modeled here as the outputs of a bank of modulation filters兲 sensitive to envelope modulation at both low 共4 – 16 Hz兲 and high 共around 100 Hz兲 rates. AM masking occurred even when the masker was at a carrier frequency more than two octaves above that of the signal to be detected. This finding is also compatible with the hypothesis that similar mechanisms underlie sensitivity to AM 共where across-frequency masking is commonly shown兲 and detection of intensity increments. © 2006 Acoustical Society of America. 关DOI: 10.1121/1.2200136兴 PACS number共s兲: 43.66.Ba, 43.66.Dc, 43.66.Mk 关AJO兴
I. INTRODUCTION
This study examines the detection of a tonal signal added to an ongoing tonal pedestal in terms of two cues. One is the energy added by presentation of the signal. The other is amplitude modulation of the pedestal plus signal, i.e., change in the stimulus envelope. The cue based on energy is commonly thought to reflect the integration of some neural correlate of signal amplitude over time 共“temporal integration”兲. Hughes 共1946兲 was one of the first to report that as the duration of an auditory signal increases, the peak intensity required for detecting its presence decreases, to some maximum duration 关for modern reviews, see Gerken et al. 共1990兲 and Moore et al. 共1999兲兴. This relationship can be demonstrated in animals 关e.g., Dooling 共1979兲 and Tougaard 共1999兲兴 and is also found for vision 共Bartlett, 1965兲. One common method of expressing the relationship between intensity and detectability across various conditions is by defining “threshold” as that change in intensity required to reach a given level of performance, usually a d⬘ of 1. For the purposes of this discussion, threshold will always be expressed in decibels as 10 log ⌬I / I, where ⌬I is the change in peak intensity relative to I, the peak intensity of a no-signal trial. For a discussion of alternative measures, see Green 共1993兲. In backgrounds of wideband noise, it is generally found that, for durations between 10 and 250 ms, the threshold for detecting a tonal signal is halved for every doubling a兲
Parts of this research were presented at the 26th meeting of the Association for Research in Otolaryngology, the 143rd meeting of the Acoustical Society of America and the 13th International Symposium on Hearing. The data were also presented in F.J.G.’s doctoral dissertation. b兲 Present address: Hearing Research Center, 635 Commonwealth Ave., Boston University, Boston, MA 02215. Electronic mail:
[email protected] J. Acoust. Soc. Am. 119 共6兲, June 2006
Pages: 3919–3930
of signal duration 共Hughes, 1946; Garner and Miller, 1947; Green et al., 1957兲. Such a rate of decrease is also found for tonal signals presented in quiet 共Garner and Miller 1947; Dallos and Olsen, 1964兲. This relationship can be expressed by plotting threshold versus the logarithm of duration. This provides a slope of −10 dB/ decade. The mechanism implied by this temporal integration is one in which all of the input that falls within some fixed time window is summed. As the duration of the signal increases, the signal-to-noise ratio increases and performance improves. Once the signal duration exceeds the window duration, increases in signal duration no longer improve performance. For a tone in quiet, the noise is assumed to be internal. An alternative to the fixed integration-time model is the proposal that the listener is able to use a temporal window matched to the signal duration 共Green and Swets, 1966; Viemeister, 1988; Dau et al. 1997a, b兲. In this case, increasing signal duration results in the availability of additional samples of information, thus decreasing sampling error. With an adjustable window matched to the signal duration, performance should be linearly related to the square-root of duration and thus the slope of the function should be −5 dB/ decade. This relationship describes those data that show temporal integration when the signal is a tone added to a tonal pedestal 共Leshowitz and Wightman, 1971; Green et al., 1979; Viemeister, 1988; Oxenham 1997; 1998; Moore et al., 1999兲. A further elaboration of this model 共Viemeister and Wakefield, 1991兲 suggests that listeners are not obligated to use a single window to integrate information, but instead are free to take samples from any portion of the stimulus in which the signal is present. This “multiple-looks” method also predicts a −5 dB/ decade slope due to reduction of variance.
0001-4966/2006/119共6兲/3919/12/$22.50
© 2006 Acoustical Society of America
3919
Either form of the energy model 共fixed or adjustable window兲 runs into difficulties, however, when detection of increments is compared with identification of changes— distinguishing an increment from a decrement 共Macmillan, 1971; Bonnel and Hafter, 1998; Hafter et al., 1998a兲. Using a tonal signal that is either added to or subtracted from a tonal pedestal, listeners are asked to either detect the increment when a signal is added to a pedestal or, in a separate condition, to identify signals as either added or subtracted. The prediction, if listeners base their decision on stimulus energy alone, is that performance on the identification task should be better than on the detection task. That is because the difference in energy between an increment and a decrement 共the steady-state portions of the stimuli in identification兲 is greater than the difference between an increment and the pedestal alone 共the stimuli in detection兲. For short signals 共less than 100 ms兲, the results are the opposite 共Macmillan, 1971; Bonnel and Hafter, 1998; Hafter et al., 1998a兲, with performance in detection exceeding that in identification. These results are consistent with the idea that listeners detect changes in the envelope of the pedestal rather than the energy per se. One frequently discussed cue to changes in envelope is the presence of off-frequency energy 共“spectral splatter”兲. It is impossible to change the intensity of a tone without generating some off-frequency energy 共Leshowitz and Wightman, 1971兲, but the amount of energy depends on the rate at which the intensity changes rather than on signal duration. If the change is sufficiently rapid, a listener using spectral splatter as the sole cue to the presence of a signal might show no change in performance with increasing duration—a slope of 0 dB/ decade. Remarkably, this result was obtained by Leshowitz and Wightman 共1971兲 when using “rectangularly gated” signals. From this perspective, the presence of background noise reduces the influence of spectral splatter by decreasing the signal-to-noise ratio in auditory filters adjacent to that containing the signal, thus restoring the improvement in performance expected with increasing duration, whether from energy or multiple looks. If this interpretation of the results is correct, then the influence of spectral splatter should also be reduced by band-pass filtering the stimuli to be detected prior to presentation—and this is exactly what Leshowitz and Wightman 共1971兲 report. Another method of reducing spectral splatter as a cue involves raising the carrier frequency of the signal such that the signal falls in an auditory filter that is wide enough that the energy spilling into adjacent filters is minimized. This method is similar to adding background noise, for then listening in those adjacent filters becomes less informative. Perhaps the most common method used to reduce spectral splatter is gating the signals with gradual onsets and offsets. For signals with carrier frequencies of 400 Hz or greater, 5 ms onset and offset ramps are sufficient to reduce splatter 共Moore et al., 1999兲, whereas a 3 kHz or higher carrier-frequency permits onsets and offsets as rapid as 1 ms without creating a spectral-splatter cue 共Oxenham, 1998兲. As the studies of detection versus identification 共Macmillan, 1971; 1973; Bonnel and Hafter, 1998; Hafter et al., 1998a兲 all used ramps of at least 10 ms, spectral splatter is 3920
J. Acoust. Soc. Am., Vol. 119, No. 6, June 2006
unlikely to be the cue that listeners were using. Macmillan 共1973兲 and Hafter et al. 共1998b兲 showed essentially the same result using a noise-signal added to a noise carrier. Oxenham 共1998兲, having explored the detection of brief increments and decrements, presented modeling suggesting that listeners are making use of “amplitude modulation energy” in detecting rapid changes in the intensity of a pedestal. Amplitude modulation 共AM兲 refers to fluctuations in the amplitude envelope of the signal and the modulation energy is measured by performing a frequency analysis on the envelope. The work of Houtgast 共1989兲 and Bacon and Grantham 共1989兲 suggest that modulation energy is a quantity to which listeners are sensitive and that it is detected by band-limited filters tuned in modulation frequency. A model based on such a bank of filters has been shown to predict modulationdetection sensitivity quite successfully 共Dau et al., 1997a, b; Dau and Verhey, 1999兲. Using a variation on Dau’s model consisting of a single modulation filter tuned to detect the presence of energy in the modulation frequencies between 80 and 150 Hz, Oxenham 共1998兲 successfully predicted performance not predicted by a model based on signal energy alone. Since Oxenham’s stimuli were at frequencies of 4 kHz or greater and onsets and offsets were never less than 1 ms, it is unlikely that this modulation energy was detectable as spectral splatter. In addition, Oxenham presented a low-level background noise in order to mask any small changes in energy outside the critical band. Wojtczak and Viemeister 共1999兲 found that listeners’ thresholds in a modulationdetection experiment can be predicted from their thresholds in an increment detection experiment, supporting Oxenham’s 共1998兲 suggestion that listeners are using both modulation sensitivity and signal energy to detect increments. This study is a further examination of the possibility that, for ongoing tones, listeners are able to detect changes in intensity by using a cue based on the output of a mechanism that can be modeled as a bank of filters acting in the envelope-frequency domain. By assessing the basic temporal integration performance of a set of listeners and comparing this performance to changes in the output of a bank of modulation filters, the first experiment examined whether the output of a bank of modulation filters can predict the relationship observed between the detectability of intensity increments and the duration of those increments. The second and third experiments were designed to test the hypothesis that envelope modulations provide a cue to increment detection from a masking perspective. Thus, modulated and unmodulated maskers were presented along with the signals to be detected. By varying the rates of modulation, the importance of energy in different envelope frequency regions could be assessed. In addition, the carrier frequency of the masker was either identical to that of the signal to be detected 共experiment 2兲 or was more than two octaves above that of the signal 共experiment 3兲. The rationale for varying the carrier frequency of the masker is that while energy detection is a phenomenon that should be limited by the energy falling within a critical band 共Green and Swets, 1966兲, there is extensive evidence that interference in the modulation-frequency domain occurs whether or not the tar-
F. J. Gallun and E. R. Hafter: Modulation sensitivity and increment detection
get and masker fall in the same critical band 共Yost and Sheft, 1989, 1990; Bacon and Konrad, 1993; Bacon and Moore, 1993; Oxenham and Dau, 2001; Gockel et al. 2002兲. II. EXPERIMENT 1: TEMPORAL INTEGRATION
Listeners were asked to detect brief increments 共“signals”兲 in the intensity of ongoing 477 Hz tones 共“pedestals”兲. The duration of the increment was varied and changes in threshold were measured in the manner described in the following. Predictions of the changes in threshold that should accompany changes in duration were generated based on the output of a bank of modulation filters as well as two versions of an energy-detector model. Model predictions were compared to the performance of human listeners. A. General Procedures
The following procedures were followed for all experiments described in this paper. The listener’s task was to detect a signal that was present on 50% of the trials. The specific signals to be detected and maskers 共if any兲 are described at the appropriate points below. Sounds were generated digitally in a PC and transformed through locally constructed 16-bit digital-to-analog converters with a sampling rate of 50 kHz and a low-pass reconstruction filter set to 20 kHz. Stimuli were presented monaurally over the left channel of Stax SR-5 electrostatic headphones to subjects seated in a sound-attenuated booth. Individual conditions were run in blocks of 50 trials that lasted approximately 3 min, with 25 trials presenting the pedestal alone and 25 the pedestal plus signal. Listeners responded by using a mouse to place the cursor on a computer screen either on the word “change” or on “no change” and pressing a button. Trial-by-trial feedback showed the correct response and then the listener started the next trial, also with a mouse click. Extensive training preceded each experiment and a listener’s performance was judged to be stable before collection commenced on the data presented below. Post-training data from each subject for each condition were included in separate calculations of the detection index, d⬘ 共Green and Swets, 1966兲. B. Methods
Five undergraduate students aged 18–24 were listeners in this experiment. Before testing, all completed a hearing test for detection of tones between 125 Hz and 4 kHz. All listeners were found to have hearing thresholds within 10 dB of published norms in the test ear. Listeners were paid for their participation. Pedestals were 1000 ms tones with a carrier-frequency of 477 Hz, gated on and off in sine phase with 10-ms onsets and 10-ms offsets in the form of raised-cosine ramps. Pedestals were presented at a peak level of 60 dB SPL. Signals were also tones with a carrier-frequency of 477 Hz, gated on and off with 10-ms, raised-cosine ramps and added to the pedestal in phase. Three signal durations 共ramps plus steady portions兲 were tested:20, 50, and 85 ms. For ease of comparison with experiments 2 and 3, duration is expressed as the half-amplitude duration, which is the duration of the signal calculated between the half-amplitude points of the onset J. Acoust. Soc. Am., Vol. 119, No. 6, June 2006
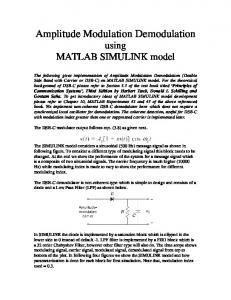
and offset ramps. This yields values of 10, 40, and 75 ms for the three durations tested. The amplitude envelopes of the pedestal-alone stimulus and the three signal-plus-pedestal stimuli are represented in column A of Fig. 1. Column B shows the output produced when each of these envelopes is transformed by a second-order band-pass modulation filter with a center frequency of 4 Hz. Column C shows the changes in output between the pedestal-alone stimulus and each of the three signal-plus-pedestal stimuli for a bank of modulation filters with center frequencies of 4, 8, 16, 32, 64, and 128 Hz. The modulation filters and the method by which changes were calculated are discussed in more detail in Sec. II D. Signals were delayed such that the temporal midpoints of pedestal and signal coincided. Individual signal levels were set such that adding signal and pedestal in phase resulted in effective signals that, when expressed as 10 log10共⌬I / I兲, ranged from −9.16 to − 3.85 dB. These values correspond to pedestal-plus-signal sound pressure levels ranging from 60.5 to 61.5 dB SPL 共i.e., values of ⌬L between 0.5 and 1.5 dB兲. Only one signal level was presented in a block and a minimum of four blocks were obtained with that level. Five signal levels were presented to each listener for each of the three durations and linear fits were made to psychometric functions plotting 10 log10共d⬘兲 against 10 log10共⌬I / I兲. If the average d⬘ value was below 0.2 or above 3.5, the value was not included in the estimate of the psychometric function. This restricts the fitting procedure to the portion of the data that is actually linear. A threshold for each listener was defined as the level associated with a d⬘ of 1.00 on that listener’s psychometric function.1 The slope of the temporal integration function was calculated by computing the change in threshold as a function of 10 log10共D兲, where D is the half-amplitude duration. C. Results
Performance was analyzed by comparing threshold for each subject in each condition. Average thresholds and standard deviations across listeners are plotted in Fig. 2. The main effect of duration was reliable 共F2,14 = 20.360, p ⬍ 0.001兲. A planned-comparison between the three durations found no reliable difference between the 40- and 75-ms conditions, but the 10-ms condition was different from both at a level of p ⬍ 0.001. The slope of the temporal integration function plotted against half-amplitude duration is well fitted by a value of −3.9 dB/ decade. This slope value is less than the −5 dB/ decade reported in the past, but if the slope is calculated versus total duration 共i.e., from onset to offset兲, the result is −5.6 dB/ decade, which is similar to what previous investigators have found 共Leshowitz and Wightman, 1971; Green et al., 1979; Viemeister, 1988; Oxenham 1997; 1998; Moore et al., 1999兲. Half-amplitude duration was used in order to allow comparison with the results of experiments 2 and 3, in which total duration is a less useful metric. D. Modulation-based modeling
Ewert and Dau 共2000兲 showed that differences in the output of filters tuned in envelope frequency can be used to
F. J. Gallun and E. R. Hafter: Modulation sensitivity and increment detection
3921
FIG. 1. The amplitude envelopes of the signals and pedestals presented in experiment 1. 共A兲 Plots of the envelopes as a function of time. 共B兲 Plots of the output of a 4-Hz modulation filter for the stimuli in 共A兲. 共C兲 The amount of change 共dB兲 that occurs in the output of modulation filters of various center frequencies when each of the signals is added to the pedestal 共see Sec. II D for details on the filter shapes and the temporal windows across which the changes were measured兲.
accurately predict performance in an AM detection task. In that model, performance is predicted to be based on the output of a modulation filter tuned to the AM rate to be detected. When a signal is added, the output of this filter increases relative to when no signal is present. Threshold is predicted to occur at the signal level that leads to a 1 dB change in output. A similar analysis can be applied to the duration data of experiment 1. Unlike with AM detection, however, adding
FIG. 2. Average threshold values 共see the text兲 for five listeners as a function of increment duration. Error bars indicate ±1 standard deviation. 3922
J. Acoust. Soc. Am., Vol. 119, No. 6, June 2006
a brief signal introduces variations in the output of a range of modulation filters 共see Fig. 1, column C兲. In addition, the filter output varies over time in accordance with the duration of the signal 共see Fig. 1, column B兲. In order to capture this variation over time and across modulation filters, several modifications of the model were required. In general, however, the model was kept as close to that of Ewert and Dau 共2000兲 as possible. In particular, the filters are second-order band-pass filters with a Q value of 1. The center frequencies are 4, 8, 16, 32, 64, and 128 Hz. The output of each modulation filter was obtained for each of the envelopes of the signals used in experiment 1 by using Matlab code made available by Ewert and Dau and corresponding to the filters used in Ewert and Dau 共2000兲. Column B of Fig. 1 represents the output of a 4-Hz modulation filter to the signal envelopes shown in column A. In order to predict listener performance from this output, a temporal window was used to integrate the output over time. In order to simulate internal noise, a constant small amplitude value 共0.04 relative to a maximum of 1兲 was added to each sample 共of which there were 20,000 in each one-second stimulus兲. Various window sizes were examined and the best fit to the data 共considering all three experiments兲 was obtained with a variable-duration window. The temporal center of the window was aligned with the temporal center of the signal and the duration of the integration window was adjusted to be that of the signal plus 10 ms. The change in dB
F. J. Gallun and E. R. Hafter: Modulation sensitivity and increment detection
of the stimulus gives the traditional 10 dB/ decade slope but the values are much higher than were obtained in this study. E. Discussion
FIG. 3. Model predictions 共lines兲 for the threshold data 共black circles兲 from experiment 1. Solid black line: modulation filter-bank model. Gray line: unfiltered envelope model with a temporal integration window matched to signal duration. Dashed black line: unfiltered envelope model with no window limiting temporal integration.
was calculated as the ratio of the integrated values of the signal-plus-pedestal and pedestal-alone outputs. Column C of Fig. 1 shows the dB change associated with 4, 8, 16, 32, 64, and 128 Hz filters for the three signal durations used in the first experiment 共all input signals had a ⌬L of 1.5 dB兲. The output of the model for a given signal was the maximum difference in dB that occurred at the output of any filter. As can be seen in column C of Fig. 1, the maximum change was at lower frequencies for longer signals. Ewert and Dau 共2000兲 used an adaptive tracking simulation to obtain the signal level that resulted in a 1 dB change in the output. A second modification made for the modeling reported here is that, since the listeners in experiment 1 performed the task at five different levels from which a threshold was estimated by linear interpolation, linear interpolation was used in the modeling as well. In order to match the method used in experiment 1, signal level was varied across the same five values 共⌬L of 0.5– 1.5 dB兲, resulting in a set of output values for each signal duration. The output values were then integrated across the window duration and transformed into changes in dB on the basis of the ratio of the signal-present output to the signal-absent output. These changes in dB were then plotted against the signal level expressed as the logarithm of ⌬I / I. Linear regression was used to obtain predictions of which ⌬I / I value resulted in a 1 dB change in the integrated output. These 10 log10共⌬I / I兲 values appear as the solid black line plotted in Fig. 3. For comparison, the thresholds predicted by using the same matched integration window directly on the stimulus envelopes with no modulation filtering 共i.e., matched-window energy integration兲 is plotted as a solid grey line. Threshold predicted on the basis of the entire duration of the stimuli with no filtering are plotted as a dashed black line 共energy integration, no window兲. As can be seen, the slopes of the two matchedwindow functions are similar but the function based on the outputs of the modulation filters gives a much more accurate fit to the data. Energy integration based on the entire duration J. Acoust. Soc. Am., Vol. 119, No. 6, June 2006
The fit to the data shown in Fig. 3 is quite good for the modulation filters with a matched window. Given that Oxenham 共1998兲 achieved similar success by using modulation frequencies between 80 and 150 Hz it is perhaps surprising that the filters with the greatest change in output for these stimuli were between 4 and 16 Hz 共see Fig. 1, column C兲. One potential reason for the difference between the modeling results is that it was the short duration 共2 – 20 ms兲 signals in Oxenham’s study that were well fit by a modulation-based model. Detectability of signals longer than 20 ms required resorting to an “energy” mechanism. As the duration of the signal is inversely related to the spread of energy to distant frequencies, both in the carrier frequency domain 共“spectral splatter”兲 and in the envelope frequency domain, it is not surprising that very short signals were detected on the basis of modulation-energy at higher frequencies. In addition, it is significant that the signal values needed by Oxenham’s 共1998兲 listeners to reach threshold performance at the longer durations were well above those found in this study 共⌬L of 3 – 5 dB兲. The reason for this is may be the introduction of low-level background noise in all conditions. The distribution of the modulation-energy in broadband noise stretches from 0 to ⌬f, where ⌬f is the bandwidth, with an energy distribution that decreases with increasing modulation frequency 关c.f., Ewert and Dau 共2000兲兴. For this reason, the degree of modulation masking from broadband noise is greatest at the lowest frequencies. As the distribution of modulation energy in signals of varying durations is dependent on the duration of the signal 共see Fig. 1兲 it is possible that the longer signals were not detectable on the basis of modulation energy. Similar threshold levels to those of Oxenham 共1998兲 have been reported by Leshowitz and Raab 共1967兲 who also used a low-level background noise. On the other hand, Viemeister 共1988兲, Leshowitz and Wightman 共1971兲, and Jeffress 共1975兲, none of whom used background noise, reported similar threshold values to those found in this study 共⌬L of 0.2– 2 dB for durations between 10 and 200 ms兲. In accordance with this analysis, Oxenham 共1997兲 reported elevated thresholds for a variety of on and offfrequency noise maskers relative to thresholds in quiet. Those results were not well described either by the masking of spectral splatter or upward spread of masking. The main result of this modeling is to suggest that if listeners are provided with a sufficiently long-duration pedestal with very little modulation energy and with no background noise, then the output of a bank of modulation filters could provide an effective cue to the presence of increments. Furthermore, it seems to be the case that, for signals with durations greater than 10– 20 ms, the output of modulation filters tuned to low-frequencies provide a more effective cue than the output of filters tuned to high-frequency modulation. Experiment 2 was designed to further examine the relative importance of modulation energy in different frequency regions by introducing modulation masking.
F. J. Gallun and E. R. Hafter: Modulation sensitivity and increment detection
3923
III. EXPERIMENT 2: MODULATION MASKING, SAME CARRIER FREQUENCY
B. Results
Experiment 2 examined the relative masking caused by the presence of AM chosen to selectively interfere with the signal-to-masker ratios present in the modulation filters used in the modeling of the results of experiment 1. To investigate whether rise-fall time interacts with the rate of AM, two different ramps were used. The main difference between the first and second experiments was the introduction of a masker at the same carrier frequency as the pedestal 共477 Hz兲. The masker was either unmodulated 共“0 Hz”兲 or was modulated at 4, 48, or 96 Hz. The peak level of the unmodulated masker was set to be the same as the peak levels of the modulated maskers so that masker energy was always decreased by the addition of modulation. Thus, a strictly energy-based model would predict better performance in the presence of modulation whereas an AM-based model would predict worse. A. Methods
All five listeners from experiment 1 participated. The peak level of the pedestal was set to the 60 dB level that was used for the pedestals in the first experiment. Pedestals and signals were tones with 477-Hz carrier frequencies. Pedestals were 1000-ms in duration and had peak levels of 60 dB SPL. The increase in the levels of the stimulus when the signal was present 共relative to the peak level of the pedestal alone兲 were 10 log10共⌬I / I兲 = −2.33, −1.09, or 0 dB 共overall levels of 62, 62.5, or 63 dB, or ⌬L’s of 2 – 3 dB兲. Listeners completed all conditions at two of the three signal levels. The signal with a half-amplitude duration of 10 ms had a 20 ms total duration with onset and offset ramps that were each 10 ms. The signal with a half-amplitude duration of 45 ms had a total duration of 85 ms and ramps that were each 40 ms. Signals were delayed such that the temporal centers of the pedestal and signal envelopes coincided. Signals were added in phase. Maskers were also 477-Hz tones with the same duration and phase as the pedestals. All maskers 共modulated or unmodulated兲 had a peak level of 60 dB SPL. Modulated maskers were sinusoidally amplitude-modulated at rates of 4, 48 or 96 Hz. Modulation was at a depth of 80% 共corresponding to minima of 41 dB SPL and maxima of 60 dB SPL兲. AM rate was always a multiple of two so that there was a maximum at the temporal center of both pedestal and signal. The equation for the AM maskers 共Y m兲 is the following, where X共t兲 is the function that defines the temporal envelope of the pedestal, m = 0.08, = 0, f = 477 Hz, and f m takes on one of the following values: 0 共unmodulated兲, 4, 48, or 96 Hz: Y m共t兲 = 关X共t兲sin 2 ft兴兵1 + m关cos共2 f mt + 兲兴其.
共1兲
The envelopes of a 4-Hz modulated masker added to the pedestal alone and a 4-Hz modulated masker added to a pedestal with each of the two signal types are shown in column A of Fig. 4. The output of a 4-Hz modulation filter for those envelopes are shown in column B. Column C shows the outputs for a 16-Hz modulation filter. 3924
J. Acoust. Soc. Am., Vol. 119, No. 6, June 2006
The results of this experiment, averaged across listeners and signal levels, are shown in Fig. 5 and the full data set appears in Table I. Because each listener had completed all conditions, a repeated-measures analysis of variance was conducted.2 The signal levels were treated as a covariate for the analysis. A main effect of AM rate was found for the 10-ms increment 共F3,21 = 13.869, p ⬍ 0.001兲 and there was no interaction with signal level. Planned-comparison t-tests showed that for all 4, 64, and 96 Hz AM, levels of performance were significantly different from that found with the unmodulated masker 共p ⬍ 0.001兲. A main effect of AM rate 共F3,24 = 25.022, p ⬍ 0.001兲 was also found for the 45-ms increment. In this case, however, planned -comparison t-tests showed that although 4 Hz is significantly different from the unmodulated condition 共p ⬍ 0.001兲, the higher rates are not 共p ⬎ 0.05兲. The results indicate that 共1兲 envelope modulation is an important cue for increment detection and 共2兲 the duration 共or perhaps the onset/offset ramps兲 of the signal can effect which envelope frequencies are weighted the most heavily in the listener’s decision process. C. Model predictions
As in experiment 1, the envelopes of the signals presented to the listeners were processed by a bank of secondorder band-pass modulation filters. Signal levels were chosen to be representative of those used in the experiment 共signalplus-pedestal level of 62.5 dB for the 10-ms signal and 62 dB for the 45-ms signal兲. As in the modeling for experiment 1, the changes in the outputs of the modulation filters were used to generate model predictions. In this case, the maximum change in dB across filters was used to directly predict listener performance expressed as d⬘. This is similar to the assumption made in experiment 1 that threshold 共d⬘ = 1兲 corresponds to a change in the filter output of 1 dB. It is also similar to the assumption made in Ewert and Dau 共2000兲 that the threshold signal level is that which results in a 1 dB change in the output of a filter tuned to the modulation frequency being detected. In all cases, the same temporal integration windows were used as in experiment 1. For comparison, the unfiltered envelope 共with the same temporally matched filter兲 was also used to predict the listener data. Figure 6 contains the data from Fig. 5 as well as predictions from the no-filter condition 共an energy model兲 and the predictions from the modulation filter-bank model. The abscissa plots the modulation rate and the ordinate plots d⬘ for the data and the largest change in dB for the modeling. The most obvious result is that although the energy model fails to predict the appropriate changes in performance with modulation rate, the modulation filter-bank does quite well at capturing the relative levels of performance. The absolute levels predicted for the 10-ms signal are too high, however. D. Discussion
From the perspective of purely energetic masking, the greater energy in the unmodulated masker would be expected to produce more masking, and yet it did not. These results are in accord with previous reports 共Macmillan, 1971; 1973;
F. J. Gallun and E. R. Hafter: Modulation sensitivity and increment detection
FIG. 4. 共A兲 The amplitude envelopes of the pedestal alone 共amplitude modulated at 4 Hz兲 and the 4-Hz modulated pedestal plus the two signals presented in experiment 2. 共B兲 Plots of the output of a modulation filter centered at 4 Hz for the stimuli in 共A兲. 共C兲 Similar plots for the output of a 16-Hz modulation filter.
Bonnel and Hafter, 1998; Hafter et al., 1998a; Oxenham, 1998兲, suggesting that listeners detect changes in the intensity of an ongoing pedestal by using information beyond that obtained by estimating stimulus energy at various points in time. These results are consistent with the hypothesis that listeners are using sensitivity to the output of a bank of modulation filters to detect changes. In addition, the difference in the masking patterns for the two signal types 共10 and 45 ms兲 is also predicted by the differences in the output patterns of the modulation filters. The shorter-duration signal
adds energy to higher modulation frequencies, while the longer-duration signal adds modulation energy primarily in the low-frequency region. Consequently, the short-duration signal is masked equally by all three AM rates whereas the long-duration signal is effectively masked by the 4-Hz masker but not by the others. One alternative explanation for the difference between the masking patterns for the short and long-duration signals is that listeners were detecting spectral splatter for the shorter signal. Since 96-Hz AM generates sidebands that fall outside the critical band centered on 477 Hz 共the width is approximately 70 Hz兲, it is plausible to imagine that the masking observed at the highest masker modulation rate was caused by energetic masking in the carrier-frequency domain rendering the spectral splatter undetectable. Experiment 3, by removing the modulation masking from the carrier-frequency region of the signal, removed this possibility. IV. EXPERIMENT 3: OFF-FREQUENCY MODULATION MASKING
FIG. 5. Average performance values for the listeners in Experiment 2. Error bars indicate ⫾ one standard deviation across listeners. J. Acoust. Soc. Am., Vol. 119, No. 6, June 2006
The results of experiments 1 and 2 are clear indications that modulation sensitivity can be usefully considered to be part of the information listeners use to detect increments added to long-duration ongoing tonal pedestals. Experiment 3 extended the results by testing more modulation rates as
F. J. Gallun and E. R. Hafter: Modulation sensitivity and increment detection
3925
TABLE I. Listener performance for the two conditions in Experiment 2 共477-Hz masker兲. The listener data for which no unmodulated masker performance could be calculated 共250 trials with no errors兲 are indicated by an asterisk. Masker modulation rate Listener
⌬I / I 共dB兲
0
4
48
96
20 ms signal, 10 ms ramps L1 0 L1 −1.09 L2 0 L2 −1.09 L3 0 L3 −1.09 L4 0 L4 −1.09 L5 −1.09 L5 −2.33 Mean Std. Dev.
1.36 1.16 2.83 1.79 3.93 2.07 3.61 2.40 3.80 2.53 2.55 0.99
1.08 0.39 0.46 0.37 2.16 1.65 0.71 0.00 1.59 1.44 0.99 0.70
0.95 0.61 1.48 0.74 2.32 1.78 1.48 0.25 2.64 1.17 1.34 0.76
0.48 0.18 1.63 0.25 2.21 0.41 1.73 0.10 2.25 1.16 1.04 0.86
85 ms signal, 40 ms ramps L1 −1.09 L1 −2.33 L2 −1.09 L2 −2.33 L3 −1.09 L3 −2.33 L4 −1.09 L4 −2.33 L5 −1.09 L5 −2.33 Mean Std. Dev.
2.51 1.81 2.90 3.15 ¯ 3.23 3.81 2.56 3.39 2.66 2.889 0.59
1.79 1.02 1.21 1.52 0.89 0.61 0.38 0.40 0.94 0.96 0.98 0.48
2.07 1.39 3.16 2.23 3.97 1.93 3.53 2.30 3.23 3.11 2.55 0.73
1.84 1.38 3.80 2.81 4.38 2.61 3.44 3.88 3.39 2.42 2.84 0.87
well as adding a third signal: one with a long duration but with short onset/offset ramps. This signal allows a comparison between a short overall signal and one that simply has short onsets and offsets. In addition, the pedestal remained at 477 Hz, but the modulation was imposed on a masking tone presented more than two octaves away, at 2013 Hz. Any masking observed in experiment 3 provides additional evidence that increment-detection is a phenomenon that seems to occur in the same domain as the detection of amplitude modulation.
A. Methods
The same five listeners participated as in experiment 2, with two additional listeners for some conditions. Three signals were used, two of 85 ms total duration and one of 20 ms, all with a carrier frequency of 477 Hz. The short signal and one of the long signals had raised-cosine onset and offset ramps of 10 ms. The remaining long signal had raised-cosine onset and offset ramps of 40 ms. This resulted in three values of half-amplitude duration: 10, 45, and 75 ms. These signals correspond to the signals with these halfamplitude durations in the previous experiments. All were delayed and added in phase such that they produced increments that were temporally centered in a 1000-ms long pedestal with a carrier-frequency of 477 Hz. The maskers were sinusoidally amplitude-modulated 关see Eq. 共1兲兴 tones of 1000-ms duration, with a carrier-frequency of 2013 Hz, summed with the pedestals prior to presentation. Modulation frequencies were 0, 4, 8, 12, 24, 32, 48, 64, and 96 Hz. Data were also collected in a condition in which no masker was present. Once the signals had been added to the pedestal, the peak intensities of the signal-plus-pedestal stimulus, relative to the pedestal intensity alone, were 10 log10共⌬I / I兲 = −5.86, −3.85, or −2.33 共producing peak signal-plus-pedestal levels of 61, 61.5, or 62 dB兲. As in experiment 2, signal levels were set individually and kept constant across conditions. Again some listeners completed full sets of conditions at multiple levels 共see Table II兲. B. Results
Results averaged across listeners are plotted for all three signal types in Fig. 7 and the data appear in Table II. A repeated-measures analysis of variance was performed on the data, with each listener at each signal level entered independently. For the 10-ms signal, since three different signal levels were used, signal level was added as a covariate. The main effect of AM rate was significant 共F10,90 = 7.337, p = ⬍ 0.001兲 and there was no interaction with signal level. Planned-comparison t-tests revealed no difference between the performance obtained in the unmasked and 0 Hz 共unmodulated兲 masker conditions 共p ⬎ 0.05兲. This shows that the addition of an unmodulated pedestal at 2013 Hz did not affect performance, which is what would be predicted by an energy-based model in which energy was estimated indepen-
FIG. 6. Model predictions for the performance data 共left panel兲 from experiment 2. For ease of presentation, performance and predictions for the unmodulated masker are plotted at the “0-Hz” point. Modulation filter model predictions are the maximal change in output across a bank of modulation filters. Energy model predictions are the overall change in output across the temporal integration window used in the modulation model. See the text for details. 3926
J. Acoust. Soc. Am., Vol. 119, No. 6, June 2006
F. J. Gallun and E. R. Hafter: Modulation sensitivity and increment detection
TABLE II. Listener performance for the three conditions in experiment 3 共2013-Hz masker兲 Masker modulation rate Listener
⌬I / I 共dB兲
No masker
0
4
8
12
16
24
32
48
64
96
20 ms signal, 10 ms ramps L1 −2.33 L1 −3.85 L2 −2.33 L2 −3.85 L3 −3.85 L3 −5.87 L4 −3.85 L5 −3.85 L5 −5.87 L6 −5.87 Mean Std. Dev.
2.75 1.20 2.56 1.23 2.21 1.78 2.04 2.60 1.57 1.79 1.97 0.56
1.88 1.04 1.77 1.09 2.77 1.64 1.99 2.39 1.77 2.08 1.84 0.53
1.54 1.02 1.00 0.10 1.70 1.81 1.18 1.46 0.81 0.22 1.08 0.58
1.17 0.67 0.82 0.75 2.15 2.11 1.73 0.72 0.37 1.11 1.16 0.63
1.62 0.58 1.04 0.94 2.51 2.10 1.33 1.68 0.91 1.40 1.41 0.59
1.49 1.37 1.27 0.54 2.47 2.57 1.51 1.56 0.67 1.03 1.45 0.66
2.04 1.03 1.74 1.00 2.48 2.30 2.33 2.30 1.18 1.30 1.77 0.59
1.98 1.34 2.64 1.27 1.83 1.79 2.16 2.19 1.32 1.13 1.76 0.49
1.35 1.64 1.06 0.65 2.43 1.58 2.56 2.28 1.32 0.97 1.58 0.65
1.93 1.11 1.28 1.02 2.69 1.61 1.80 2.70 1.69 1.35 1.72 0.59
1.16 0.99 1.09 0.12 1.70 0.79 1.95 1.47 1.21 0.79 1.13 0.52
85 ms signal, 10 ms ramps L1 −5.87 L2 −5.87 L3 −5.87 L4 −5.87 L5 −5.87 L7 −3.85 Mean Std. Dev.
2.26 3.03 3.06 3.36 2.14 2.56 2.73 0.49
1.55 2.36 2.07 3.68 1.65 2.58 2.31 0.78
1.54 0.39 1.04 0.83 0.05 0.20 0.67 0.57
1.56 2.36 1.63 2.96 0.80 0.88 1.70 0.84
2.48 2.92 2.96 3.31 1.15 1.53 2.39 0.86
1.90 2.51 2.49 2.44 0.94 2.26 2.09 0.61
2.31 2.37 2.60 1.90 1.14 1.77 2.01 0.53
2.09 2.38 2.48 2.42 1.08 1.86 2.05 0.53
2.29 2.14 2.35 2.93 1.25 2.24 2.20 0.54
1.93 2.73 1.93 2.78 1.20 2.33 2.15 0.59
2.12 2.01 2.01 2.81 0.79 1.91 1.94 0.65
85 ms signal, 40 ms ramps L1 −5.87 L2 −5.87 L3 −5.87 L4 −5.87 L5 −5.87 Mean Std. Dev.
1.56 1.62 1.56 1.19 2.78 1.74 0.61
1.54 1.81 1.89 1.22 2.53 1.80 0.49
0.58 0.39 0.50 0.24 1.04 0.55 0.30
1.02 0.80 1.17 0.55 1.93 1.09 0.52
0.87 1.83 1.69 0.70 1.96 1.41 0.58
1.17 1.95 1.78 0.94 2.13 1.59 0.51
1.31 2.03 1.89 0.83 1.77 1.56 0.49
1.10 1.69 1.54 1.14 1.77 1.45 0.31
1.66 1.88 1.82 0.50 1.95 1.56 0.60
1.46 1.42 1.39 0.93 1.83 1.41 0.32
1.86 1.37 0.92 0.80 2.03 1.40 0.55
dently for each critical band. Further planned-comparison t-tests showed that the 4, 8, 12, and 96 Hz AM produced performance reliably different from the 0 Hz 共unmodulated兲 masker 共p ⬍ 0.01兲, but performance with the 16, 24, 32, 48, and 64 Hz AM maskers did not 共p ⬎ 0.05兲. As was found in experiment 2, this shows that the 10-ms signal is detected based on a combination of high and low envelope frequencies. For the 45-ms signal 共an 85-ms signal with 40-ms ramps兲, the main effect of AM rate was significant 共F10,40
FIG. 7. Average performance values for the listeners in experiment 3. Error bars indicate ⫾ one standard deviation across listeners. J. Acoust. Soc. Am., Vol. 119, No. 6, June 2006
= 7.816, p ⬍ 0.001兲. Planned-comparison t-tests showed that the difference between the unmasked and 0 Hz 共unmodulated兲 masker conditions was not statistically reliable 共p ⬎ 0.05兲. In this case, however, the differences between the unmodulated masker and the 4, 8, 12, 32, and 64 Hz modulated masking conditions were all reliable 共4 and 8 Hz, p ⬍ 0.01; 12, 32, and 64 Hz, p ⬍ 0.05兲. Interestingly, this suggests that listeners are capable of using a range of envelope frequencies to perform the task. These results are not the same as those obtained in experiment 2, in which only the lowest modulation frequencies produced substantial masking for the 45-ms signal. For the 75-ms signal 共an 85-ms signal with 10-ms ramps兲, the main effect of AM rate was significant 共F10,50 = 10.836, p ⬍ 0.001兲. Planned-comparison t-tests showed that the difference between the unmasked and unmodulated masker conditions was not statistically reliable 共p ⬎ 0.05兲. In fact, the only difference that reached significance was that between the unmodulated and the 4 Hz 共p = 0.011兲. These results are in agreement with the pattern seen in experiment 2, but are at odds with the findings for the 45-ms signal in this experiment. Examination of the patterns displayed by the individual listeners 共as can be seen in Table II兲 suggests that
F. J. Gallun and E. R. Hafter: Modulation sensitivity and increment detection
3927
FIG. 8. Model predictions for a subset of the performance data 共left panel兲 from experiment 3. The grey bars indicate detection performance 共or predictions兲 for the three signal durations when no masker was present. The black bars indicate performance 共or predictions兲 when the masker was an unmodulated tone presented at a carrier frequency of 2013 Hz. The models are the same as those plotted in Fig. 6.
there may be differences between listeners that contribute to the variability of masking patterns across the different signal durations.
the energy-integration model fails to predict any change in performance with modulation rate, the modulation filter-bank captures the drop in performance in the presence of 4-Hz AM and the subsequent recovery at higher rates.
C. Model predictions
The model predictions were generated in the same manner as for experiment 2. Central to the success of the model is the fact that modulation information is combined across carrier frequencies as suggested by the modeling of Dau and Verhey 共1999兲 and Chi et al. 共1999兲. This model structure is also supported by the psychophysical results on studies of AM masking across carrier frequency 共e.g., Yost and Sheft, 1989兲. Figure 8 compares the predictions of the modulation model and the energy model to the listener data for the no masker condition and the unmodulated masker condition. As is clear, the no filter 共energy兲 model predicts a substantial effect of the unmodulated masker. The reason for this is that the predictions are based on a summation of the envelopes despite the fact that they are presented at distant carrier frequencies. Despite this fact, the modulation filter-bank predicts no difference whatsoever. The listener data resemble the prediction of the modulation filters much more closely than they do the prediction of the energy model. The standard deviations shown in Fig. 7 and the individual data presented in Table II make it clear that the apparent variations with masker for the listener data are due to variability across listeners. The various individual listeners were as likely to perform better with no masker as with an unmodulated masker at 2013 Hz. The model predictions for the off-frequency modulation maskers appear in Fig. 9. These data are a strong indication of the value of considering a model based on a bank of modulation filters as an explanation for these data. Although
D. Discussion
The finding that AM maskers can interfere with increment detection at a distant carrier frequency suggests that whatever mechanism underlies amplitude modulation sensitivity is effective for increment detection as well. As predicted by the changes in the output of low-frequency modulation filters to unmasked signals 共Fig. 1, column C兲, the greatest masking occurred for the lowest AM rate tested. As in experiment 2, however, there was substantial masking at the highest AM rate for the short-duration signal. An explanation based on masking of spectral splatter is not plausible for a masker centered at 2013 Hz, however. In general, the change in output of a bank of modulation filters was successful at predicting the patterns of masking observed in this experiment as in the previous two. The largest changes in output again came from filters tuned to low envelope frequencies. The most striking result of this study is certainly the masking of a tone at a carrier frequency of 477 Hz by a masker two octaves higher in frequency. This result is similar to those obtained in AM detection experiments 共Yost and Sheft, 1989, 1990; Bacon and Konrad, 1993; Bacon and Moore, 1993; Oxenham and Dau, 2001; Gockel et al. 2002兲. Nonetheless, it stands quite alone in the increment detection literature and is, by itself, a compelling argument for the need to reexamine the energy model.
FIG. 9. Model predictions for a subset of the performance data 共left panel兲 from experiment 3. The models are the same as those plotted in Fig. 6. 3928
J. Acoust. Soc. Am., Vol. 119, No. 6, June 2006
F. J. Gallun and E. R. Hafter: Modulation sensitivity and increment detection
V. GENERAL DISCUSSION
In detecting increments added to ongoing tones, listener performance is substantially decreased by the presence of amplitude-modulated maskers at low modulation rates. One of the most striking findings was that in experiment 3 amplitude modulation hurt performance even when it was not present at the carrier frequency of the signal. This suggests that the AM filterbank model originally proposed by Bacon and Grantham 共1989兲 and by Houtgast 共1989兲 could be a very effective method for detecting increments. The model used in this article, based on that of Ewert and Dau 共2000兲, supports this idea in that it very effectively predicts performance for most of the experiments described. Given the success of the simple model of Ewert and Dau 共2000兲, it is possible that a more detailed model might do even better. Two additional models 共Dau et al., 1997a, b; Chi et al., 1999兲 were also explored, but neither was able to substantially improve on the performance of the current, simpler model. Chi et al.共1999兲 has the advantage that it is based upon actual physiological patterns of responding observed in the auditory cortex. Quantitatively 共and qualitatively兲, however, it was less successful than the filters proposed by Ewert and Dau 共2000兲. While it is an important goal of auditory science to bridge the gap between psychophysics and physiology, the current state of knowledge on the physiological basis of modulation sensitivity 共recently reviewed by Joris et al., 2004兲 suggests that there is still much about the physiology that is unknown. In fact, it has even been suggested that a single unit’s sensitivity to modulation can vary considerably based on the stimuli presented and time scales over which activity is analyzed 共Nelken et al., 2004兲. Future modeling work will probably need to embrace this non-linear response pattern, but currently there is little work that is capable of capturing the physiological responses let alone extending these patterns to predict psychophysical performance. Consequently, the fact that the model of Ewert and Dau 共2000兲 captured so much of the psychophysical results is certainly a remarkable result. VI. SUMMARY
Three experiments were conducted on the ability of human listeners to detect changes in the intensity of a 477-Hz tonal pedestal. In the first, increment duration was varied and listener sensitivity was found to increase with duration, with a greater change coinciding with increasing total duration from 20 to 50 ms than with increasing total duration again to 80 ms. This pattern of improvement was predicted by a model based on changes in the output of a bank of modulation-sensitive filters. In the second and third experiments, amplitude modulation was presented throughout the observation interval in order to selectively mask individual modulation filters. On-frequency AM 共at the same carrierfrequency as the signal兲 was found to mask increments with a total duration of 20 ms at rates of 4, 48, and 96 Hz, but 85-ms increments with 40-ms onsets and offsets were only masked by 4-Hz AM. Off-frequency AM 共imposed on a carrier frequency of 2013 Hz兲 was most effective as a masker when the rate was 4 Hz, but there was some effect of J. Acoust. Soc. Am., Vol. 119, No. 6, June 2006
96-Hz AM as well, especially for brief signals. The modulation-based model was more successful in predicting the masking patterns than was a model based on energy, suggesting the an “energy detector” is not the appropriate description of the mechanism by which human listeners demonstrate sensitivity to brief changes in the intensity of a tone. ACKNOWLEDGMENTS
The authors are extremely grateful to Dr. Torsten Dau and Dr. Shihab Shamma for stimulating discussions on this topic as well as for providing Matlab code. They thank Dr. Anne-Marie Bonnel for extensive discussions of the methodological and theoretical issues related to this research. Dr. H. Steven Colburn provided extremely useful analysis of the model results and parameters as well as encouragement. They are also very grateful to Dr. Andrew Oxenham, the associate editor, as well as to Dr. Christian Lorenzi and an anonymous reviewer, all of whom made comments that were central in developing the model presented here. This work was supported by Grant No. DC 000087 from NIH/NIDCD. 1
Although thresholds are often obtained with adaptive procedures, estimating threshold from psychometric functions was found to give more stable results in preliminary tests. It also allows the experimenter to ensure that the slopes of the psychometric functions are all the same. If the slopes differ, then the “thresholds” will differ depending on the point at which they are defined. In this case, the slopes were quite similar once the logarithmic transform had been applied. 2 The performance of listener three for the −1.09 dB signal and the 0-Hz masker did not involve any incorrect responses, so a d⬘ value could not be calculated. For the purpose of the analysis, this point was arbitrarily set to a value of 4.38, which was the highest measurable value obtained by that listener. Bacon, S. P., and Grantham, D. W. 共1989兲. “Modulation masking: Effects of modulation frequency, depth, and phase,” J. Acoust. Soc. Am. 85, 2575– 2580. Bacon, S. P., and Konrad, D. L. 共1993兲. “Modulation detection interference under conditions favoring within- or across-channel processing,” J. Acoust. Soc. Am. 93, 1012–1022. Bacon, S. P., and Moore, B. C. J. 共1993兲. “Modulation detection interference: Some spectral effects,” J. Acoust. Soc. Am. 93, 3442–3453. Bartlett, N. R. 共1965兲. “Thresholds as dependent on some energy relations and characteristics of the subject,” in Vision and Visual Perception, edited by C. H. Graham 共Wiley, New York兲, pp. 147–175. Bonnel, A. M., and Hafter, E. R. 共1998兲. “Divided attention between simultaneous auditory and visual signals,” Percept. Psychophys. 60, 179–190. Chi, T., Gao, Y., Guyton, M. C., Ru, P., and Shamma, S. 共1999兲. “Spectrotemporal modulation transfer functions and speech intelligibility,” J. Acoust. Soc. Am. 106, 2719–2732. Dallos, P. J., and Olsen, W. O. 共1964兲. “Integration of energy at threshold with gradual rise-fall tone pips,” J. Acoust. Soc. Am. 36, 743–751. Dau, T., Kollmeier, B., and Kohlrausch, A. 共1997a兲. “Modeling auditory processing of amplitude modulation. I. Detection and masking with narrow-band carriers,” J. Acoust. Soc. Am. 102, 2892–2905. Dau, T., Kollmeier, B., and Kohlrausch, A. 共1997b兲. “Modeling auditory processing of amplitude modulation. II. Spectral and temporal integration,” J. Acoust. Soc. Am. 102, 2906–2919. Dau, T., and Verhey, J. L. 共1999兲. “Modeling across-frequency processing of amplitude modulation,” in Psychoacoustics, Physiology and Models of Hearing, edited by T. Dau, V. Hohmann, and B. Kollmeier 共World Scientific, Singapore兲, pp. 229–234. Dooling, R. J. 共1979兲. “Temporal summation of pure tones in birds,” J. Acoust. Soc. Am. 65, 1058–1060. Ewert, S. D., and Dau, T. 共2000兲. “Characterizing frequency selectivity for
F. J. Gallun and E. R. Hafter: Modulation sensitivity and increment detection
3929
envelope fluctuations,” J. Acoust. Soc. Am. 108, 1181–1196. Garner, W. R., and Miller, G. A. 共1947兲. “The masked threshold of pure tones as a function of duration,” J. Exp. Psychol. 37, 293–303. Gerken, G. M., Bhat, V. K. H., and Hutchison-Clutter, M. 共1990兲. “Auditory temporal integration and the power function model,” J. Acoust. Soc. Am. 88, 767–778. Gockel, H., Carlyon, R. P., and Deeks, J. M. 共2002兲. “Effect of modulator asynchrony of sinusoidal and noise modulators on frequency and amplitude modulation detection interference,” J. Acoust. Soc. Am. 112, 2975– 2984. Green, D. M. 共1993兲. “Auditory intensity discrimination,” in Human Psychophysics, edited by W. A. Yost, A. N. Popper, and R. R. Fay 共Springer, New York兲, pp. 13–55. Green, D. M., Birdsall, T. G., and Tanner, W. P. Jr. 共1957兲. “Signal detection as a function of signal intensity and duration,” J. Acoust. Soc. Am. 29, 523–531. Green, D. M., and Swets, J. A. 共1966兲. Signal Detection Theory and Psychophysics 共Wiley, New York兲. Green, D. M., Nachmias, J., Kearney, J. K., and Jeffress, L. A. 共1979兲. “Intensity discrimination with gated and continuous sinusoids,” J. Acoust. Soc. Am. 66, 1051–1056. Hafter, E. R., Bonnel, A.-M., and Gallun, E. 共1998b兲. “Detection of change in an auditory stimulus: Psychophysical evidence for a central mechanism,” Abstracts of the Twenty-First Midwinter Meeting of the Association for Research in Otolaryngology, St. Petersburg Beach, FL. Hafter, E. R., Bonnel, A. M., Gallun, E., and Cohen, E. 共1998a兲. “A role for memory in divided attention between two independent stimuli,” in Psychophysical and Physiological Advances in Hearing, edited by A. R. Palmer, A. Q. Summerfield, and R. Meddis, Proceedings of the 11th International Symposium on Hearing 共Whurr, London兲, pp. 228–237. Houtgast, T. 共1989兲. “Frequency selectivity in amplitude-modulation detection,” J. Acoust. Soc. Am. 85, 1676–1680. Hughes, J. W. 共1946兲. “The threshold of audition for short periods of stimulation,” Proc. R. Soc. London, Ser. B 133, 486–490. Jeffress, L. A. 共1975兲. “Masking of tone by tone as a function of duration,” J. Acoust. Soc. Am. 58, 399–403. Joris, P. X., Schreiner, C. E., and Rees, A. 共2004兲. “Neural processing of amplitude-modulated sounds,” Physiol. Rev. 84, 541–577. Leshowitz, B., and Raab, D. H. 共1967兲. “Effects of stimulus duration on the
3930
J. Acoust. Soc. Am., Vol. 119, No. 6, June 2006
detection of sinusoids added to continuous pedestals,” J. Acoust. Soc. Am. 41, 489–496. Leshowitz, B., and Wightman, F. L. 共1971兲. “On-frequency masking with continuous sinusoids,” J. Acoust. Soc. Am. 49, 1180–1190. Macmillan, N. A. 共1971兲. “Detection and recognition of increments and decrements in auditory intensity,” Percept. Psychophys. 10, 233–238. Macmillan, N. A. 共1973兲. “Detection and recognition of intensity changes in tone and noise: The detection-recognition disparity,” Percept. Psychophys. 13, 65–75. Moore, B. C. J., Peters, R. W., and Glasberg, B. R. 共1999兲. “Effects of frequency and duration on psychometric functions for detection of increments and decrements in sinusoids in noise,” J. Acoust. Soc. Am. 106, 3539–3552. Nelken, I., Fishbach, A., Las, L., Ulanovsky, N., and Farkas, D. 共2004兲. “Primary auditory cortex of cats: Feature detection or something else?,” Biol. Cybern. 89, 397–406. Oxenham, A. J. 共1997兲. “Increment and decrement detection in sinusoids as a measure of temporal resolution,” J. Acoust. Soc. Am. 102, 1779–1790. Oxenham, A. J. 共1998兲. “Temporal integration at 6 kHz as a function of masker bandwidth,” J. Acoust. Soc. Am. 103, 1033–1042. Oxenham, A. J., and Dau, T. 共2001兲. “Modulation detection interference: Effects of concurrent and sequential streaming,” J. Acoust. Soc. Am. 110, 402–408. Tougaard, J. 共1999兲. “Receiver operating characteristics and temporal integration in an insect auditory receptor cell,” J. Acoust. Soc. Am. 106, 3711–3718. Viemeister, N. F. 共1988兲. “Psychophysical aspects of auditory intensity coding,” in Auditory Function: Neurobiological Bases of Hearing, edited by F. M. Edelman, W. E. Gall, and W. M. Cowan 共Wiley, New York兲, pp. , 213–241. Viemeister, N. F., and Wakefield, G. H. 共1991兲. “Temporal integration and multiple looks,” J. Acoust. Soc. Am. 90, 858–865. Wojtczak, M., and Viemeister, N. F. 共1999兲. “Intensity discrimination and detection of amplitude modulation,” J. Acoust. Soc. Am. 106, 1917–1924. Yost, W. A., and Sheft, S. 共1989兲. “Across-critical-band processing of amplitude-modulated tones,” J. Acoust. Soc. Am. 85, 848–857. Yost, W. A., and Sheft, S. 共1990兲. “A comparison among three measures of cross-spectral processing of amplitude modulation with tonal signals,” J. Acoust. Soc. Am. 87, 897–900.
F. J. Gallun and E. R. Hafter: Modulation sensitivity and increment detection