An Adaptive Method for Efficient Detection of Salient Visual Object from Color. Images. M. Brezovan .... where the threshold Ï is an adaptive value defined as the.
2010 International Conference on Pattern Recognition
An Adaptive Method for Efficient Detection of Salient Visual Object from Color Images M. Brezovan, D. Burdescu, E. Ganea, L. Stanescu, C. Stoica Software Engineering Department University of Craiova Craiova, Romania {mbrezovan,dburdescu,eganea,lstanescu,cstoica}@software.ucv.ro
We develop a visual feature-based method which uses a grid-graph constructed on a hexagonal structure containing half of the image pixels in order to determine a forest of spanning trees for connected component representing visual objects. Image segmentation is realized in two distinct steps: a pre-segmentation step when only color information is used to determine an initial segmentation, and a syntactic-based segmentation step when we use both color and geometric properties of regions. The novelty of our contribution concerns: (a) the hexagonal structure used in the unified framework for image segmentation, (b) an adaptive method to determine the thresholds used both in the pre-segmentation and in the final segmentation step, and (c) an automatic stoping criterion used in the final segmentation step. The rest of the paper is organized as follows. The proposed segmentation method is presented in Sect. II. Experimental results are presented in Sect. III. Section IV concludes the paper and outlines the main directions of the future work.
Abstract—This paper presents an efficient graph-based method to detect salient objects from color images and to extract their color and geometric features. Despite of the majority of the segmentation methods our method is totally adaptive and it do not require any parameter to be chosen in order to produce a better segmentation. The proposed segmentation method uses a hexagonal structure defined on the set of the image pixels ant it performs two different steps: a pre-segmentation step that will produce a maximum spanning tree of the connected components of the visual graph constructed on the hexagonal structure of an image, and the final segmentation step that will produce a minimum spanning tree of the connected components, representing the visual objects, by using dynamic weights based on the geometric features of the regions. Experimental results are presented indicating a good performance of our method. Keywords-graph-based segmentation; color segmentation; visual syntactic features;
I. I NTRODUCTION The problem of partitioning images into homogenous regions or semantic entities is a basic problem for identifying relevant objects. There is a wide range of computational vision problems that could use of segmented images, either at intermediate-level or at higher-level. However the problems of image segmentation and grouping remain great challenges for computer vision. Image segmentation techniques can be distinguished into two groups, region-based, and contour-based approaches. Region-based segmentation methods can be broadly classified as either model-based [1] or visual feature-based approaches [2]. An important group of visual feature-based methods is represented by the graph-based segmentation methods, which attempt to search a certain structures in the associated edge weighted graph constructed on the image pixels, such as minimum spanning tree [3], or minimum cut [4]. Most graph-based segmentation approaches use color and texture models. However these homogeneity criteria have some drawbacks for object extraction in case of complex regions. In [5] a source of additional information denoted by the term of syntactic features is presented, which represent geometric properties of regions and their spatial configurations. 1051-4651/10 $26.00 © 2010 IEEE DOI 10.1109/ICPR.2010.574
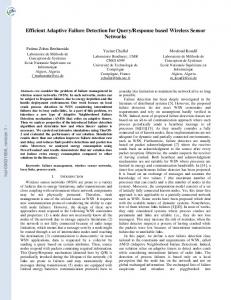
II. P ROPOSED A PPROACH In order to optimize the running time of segmentation algorithms we use a hexagonal structure constructed on the image pixels, as presented in Fig. 1. Each hexagon represents an elementary item and the entire hexagonal structure represents a grid-graph, G = (V, E), where each hexagon h in this structure has a corresponding vertex v ∈ V . The amount of memory space associated to the graph vertices is considerably reduced. As in other graph-based approaches [3] we use the notion of segmentation of the set V . A segmentation S is a partition of V such that each component C ∈ S corresponds to a connected component in a spanning subgraph GS = (V, ES ) of G, with ES ⊆ E. For each determined component C some color and geometric features will be determined and stored by the segmentation algorithms such as: the dominant color of the region associated to C, the set of the hexagons contained in the region, and the set of hexagons located at the boundary of the component. 2338 2350 2346
Figure 1.
Algorithm 1 Color-based segmentation 1: Determine Eπ = �eπ1 , . . . , eπ|E| � the sorting of E in order of non-increasing weight 2: for all k ← 1, |E| do 3: ⊲ Let eπk = (hi , hj ) be the current edge in Eπ 4: ti ← FIND S ET(hi ) 5: tj ← FIND S ET(hj ) 6: if ti �= tj then 7: if w(hi , hj ) ≤ INT VAR(ti , tj ) then 8: UNION(ti , tj , w(hi , hj )) 9: end if 10: end if 11: end for
The triangular grid constructed on the hexagonal structure
A. Color-Based Segmentation The first step of the segmentation algorithm uses a colorbased region model and will produce a forest of maximum spanning trees corresponding to the determined regions. In this region model the evidence for a boundary between two regions is color-based and it represents the difference between the internal contrast of the regions and the external contrast between them. We decided to use the RGB color space because it is efficient and no conversion is required. We use the perceptual Euclidean distance with weightcoefficients as proposed in [6], P ED(e, u) = � wR (Re −Ru )2 +wG (Ge −Gu )2 +wB (Be −Bu )2 , where the weights for the different color channels, wR , wG , and wB verify the condition wR + wG + wB = 1. Both notions of internal contrast of a component, and external contrast between two components are based on the dissimilarity between colors: ExtV ar(C ′ , C ′′ ) = IntV (C) =
max
(hi ,hj )∈cb(C ′ ,C ′′ )
max
(hi ,hj )∈C
The running time of the color-based segmentation algorithm is O(n log n), where n represents the number of the hexagons from the triangular grid, n = |V |. B. Syntactic-Based Segmentation The syntactic-based segmentation algorithm uses a new graph, G′ = (V ′ , E ′ ), which is extracted from the segmentation produced in the pre-segmentation step. This graph has a single vertex for each connected component determined by the color-based segmentation algorithm. The final segmentation step uses a syntactic-based region model and will produce a forest of minimum spanning trees corresponding to the determined salient regions. The syntactic-based region model contains in this case in addition to color information some geometric properties of each region, such as the area of the region and the region boundary. The dissimilarity function between the components is a weighted sum of four dissimilarity criteria, which can be written in vectorial form as wk (C ′ , C ′′ ) = � k T d(C ′ , C ′′ ), � where k is the normalized vector associated to a some vector of weights, k ∈ W 4 , with W a some finite set of weights, and d(C ′ , C ′′ ) is the vector of dissimilarities between two components, containing four components: the color dissimilarity dcl as presented in the color-based model, the homogeneity dissimilarity dnh , the regularity dissimilarity dnr , and the compactness dissimilarity dco :
w(hi , hj ),
w(hi , hj ),
(1)
where cb(C ′ , C ′′ ) represents the common boundary between the components C ′ and C ′′ . The maximum internal contrast between two components is defined as, IntV ar(C ′ , C ′′ ) = max(IntV (C ′ ), IntV (C ′′ )) + τ, (2) where the threshold τ is an adaptive value defined as the sum between the average of the color distances associated to edges and the standard deviation. The comparison predicate between two neighboring components, C ′ and C ′′ , determines if there exists an evidence for a boundary between them by comparing the values IntV ar(C ′ , C ′′ ) and ExtV ar(C ′ , C ′′ ). The color-based segmentation algorithm builds a maximum spanning tree for each determined region of the input image based on a modified form of the Kruskal’s algorithm, as presented in Alg. 1. The functions FIND S ET and UNION used by the segmentation algorithm implement the classical operations for disjoint set data structures with union by rank and path compression. In addition the function UNION realizes specific operations for merging regions.
min(a(C ′ ), a(C ′′ )) , max(a(C ′ ), a(C ′′ )) min {r(C ′ ), r(C ′′ )} , dnr (C ′ , C ′′ ) = max {r(C ′ ), r(C ′′ )} cb(C ′ , C ′′ ) , dco (C ′ , C ′′ ) = 1 − min(p(C ′ ), p(C ′′ ) dnh (C ′ , C ′′ ) =
(3)
where a(C) represents the area of the component C, p(C) its perimeter, and r(C) is the factor of the regularity of C, r(C) = pp(C) , with pc (C) representing the perimeter of a c (C) circle having the area a(C). In order to define the pairwise comparison predicate between two components an adaptive weighted threshold is 2347 2351 2339
Algorithm 3 Generate a new sequence of partitions 1: function GEN PART (G, tth , newP artition) 2: newP artition ← f alse 3: repeat 4: i←0 5: for i ← 1, G.n do 6: Determine e the lightest edge 7: adjacent to G.V [i] 8: if e.w ≤ thk then 9: i←i+1 10: e.inM ST ← true 11: end if 12: end for 13: if i > 0 then 14: G′ ← CONTRACT G RAPH(G) 15: newP artition ← true 16: end if 17: until i = 0 18: return G′ 19: end function
computed. For each segmentation this threshold is associated to the average values of the four dissimilarity functions. Denoting the vector of average values by f ∈ R4 the weighted threshold, thk , associated with a weighted vector k can be written in vectorial form as thk = � k T f . The comparison predicate between two neighboring components, C ′ and C ′′ , is defined now as the difference between the values wk (C ′ , C ′′ ) and thk . Algorithm 2 implements the syntactic based segmentation. At each iteration the function GEN PART is used to generate the subsequences of segmentations that use the same vector of weights k and the same threshold thk . This function is presented in Alg. 2 and it is a generalized Greedy algorithm for constructing minimum spanning trees based on a modified form of the Bor˚uvka’s algorithm [7] . At each iteration the contraction of the tree over all the edges that appear in the minimum spanning tree is performed by the function CONTRACT G RAPH. Algorithm 2 Syntactic-based segmentation 1: count ← 0 2: repeat 3: G ← GEN PART(G, thk , newP art) 4: if newP art then 5: count ← 0 6: k ← [1111]T end if 7: 8: thk ← MODIFY W EIGHTS(G, k) 9: count ← count + 1 10: NEXT KV ECTOR (k) 11: until count = |W |4
precision-recall metric [8]. We include for comparison the segmentation results obtained with other three alternative segmentation algorithms: Mean-Shift [9], Local Variation [3], and Normalized Cuts [10]. These algorithms were chosen because they are representative for current methods in image segmentation, and because implementations of the algorithms are available. We evaluate the performance of the selected algorithms on the Berkeley Segmentation Database (BSD) [11]. We implemented our precision-recall framework instead of use the segmentation benchmark of Berkeley because the contours of the visual objects determined by our method are binary images while Berkeley segmentation benchmark encourage soft boundary representation where pixels have attached a probability of membership to object contours. Let B represent the boundary point set derived from a segmentation and GB the boundary ground truth. Denoting by matchǫ (B) the number of pixels from B that have a suitable match in GB within a circle with a radius ǫ, and with matchǫ (GB ) the number of pixels from GB that have a suitable match in B, the following values are deterB ǫ (B) ǫ (G ) , and Rǫ = match . Precision mined: Pǫ = match |B| |GB | and Recall can combined in a single quality measure, the ǫ Rǫ F −measure, defined as their harmonic mean, Fǫ = P2P . ǫ +Rǫ We use for evaluation the test set of 100 images. Because our method is adaptive we determine the average values for P and R for the test set of images. Because the other evaluated methods are parameterized we use 15 different values for parameters as follows: For Normalized Cuts we tested the input parameter (the desired number of regions) within [3; 15]. For Local Variation we tested the
Because the last graph generated by GEN PART can not be further contracted the dissimilarity vectors of functions associated to the edge weights are not modified. In order to restart the process the function MODIFY W EIGHTS is used to recalculate the new weighted threshold. The values for the weighted vector k are sequential determined by NEX T KV ECTOR in the lexicographic order in order to realize a stopping criterion for the algorithm: the last graph can not be modified for all distinct values of the weighted vectors k ∈ W 4 and another partition can not be determined. As in the case of color-based segmentation, the running time of the syntactic-based segmentation algorithm is O(n′ log n′ ), where n′ represents the number of the components determined by the color-based step. Syntactic-based segmentation step allow to automatically segment images into large, salient, regions that generally correspond to objects or images, avoiding the creation of regions spanning more than one semantic object. III. E XPERIMENTAL R ESULTS The evaluation of the proposed segmentation method is performed with a quantitative contour-based measure, the 2348 2352 2340
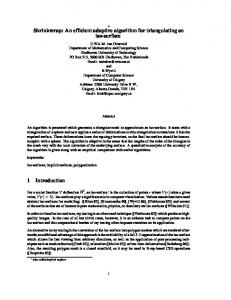
input parameter k (that controls the size of the regions in the resulting segmentation) within [100; 1000]. Mean-Shift algorithm has two main parameters: the spatial bandwidth, and the range bandwidth. We tested this algorithm with two values within [8; 20] for range bandwidth and for five values within [4; 10] for spatial bandwidth. We obtained one curve in the Precision-Recall diagram for each of the three methods and we retained for each curve one point (P, R) which represents the best F − measure. For the Performance measure we retained also the maximum value for each sequence of values. Figure 2 represents the precision-recall diagram associated with the evaluated segmentation methods using the radius ǫ = 3. It can be observed that the F value of our method (denoted by SOD) dominates all the maximum F values of the others methods.
the good performance of the proposed method. Future work will be carried out in the direction of integrating syntactic visual information into a semantic level of a semantic image processing and indexing system. ACKNOWLEDGMENT This research was supported by CNCSIS − UEFISCSU under a grant PNII−IDEI 535/2008. R EFERENCES [1] C. Carson, S. Belongie, H. Greenspan, and J. M. J, “Blobworld: Color- and texture-based image segmentation using em and its application to image querying and classification,” IEEE Transactions on Pattern Analysis and Machine Intelligence, vol. 24, no. 8, pp. 26–37, 2002. [2] J. Fauqueur and N. Boujemaa, “Region-based image retrieval: Fast coarse segmentation and fine color description,” Journal of Visual Languages and Computing, vol. 15, no. 1, pp. 60– 95, 2004. [3] P. Felzenszwalb and W. Huttenlocher, “Efficient graph-based image segmentation,” International Journal of Computer Vision, vol. 59, no. 2, pp. 167–181, 2004. [4] J. Shi and J. Malik, “Normalized cuts and image segmentation,” in Proceedings of the IEEE International Conference on Computer Vision and Pattern Recognition, San Juan, Puerto Rico, 1997, pp. 731–737. [5] C. Bennstrom and J. Casas, “Binary-partition-tree creation using a quasi-inclusion criterion,” in Proceedings of the Eighth International Conference on Information Visualization, London, UK, 2004, pp. 259–294.
Figure 2.
[6] A. Gijsenij, T. Gevers, and M. Lucassen, “A perceptual comparison of distance measures for color constancy algorithms,” in Proceedings of the European Conference on Computer Vision, ser. Lecture Notes in Computer Science, vol. 5302, Marseille, France, 2008, pp. 208–221.
Global evaluation using precision-recall for ǫ = 3
Our method works well on the images from BSD. Table I presents averages values for running time in the case of the four evaluated methods.
[7] O. Bor˚uvka, “O jist´em probl´emu minim´aln´ım,” Pr´aca Moravsk´e Pˇrirodoˇedeck´e Spoleˇcnosi, vol. 3, pp. 37–58, 1926, in Czech.
Table I AVERARGE RUNNING TIME Algorithm Avg. time (seconds)
SOD 0.7
LV 0.5
MS 1.9
[8] C. Fowlkes, D. Martin, and J. Malik, “Learning affinity functions for image segmentation: combining patch-based and gradient-based approaches,” in Proceedings of the IEEE Conference on Computer Vision and Pattern Recognition, Madison, Wisconsin, 2003, pp. 54–61.
NC 22.6
[9] D. Comaniciu and P. Meer., “Robust analysis of feature spaces: Color image segmentation,” in Proceedings of the IEEE Conference on Computer Vision and Pattern Recognition, 1997, pp. 750–755.
IV. C ONCLUSION In this paper we presented a new graph-based method for determining of visual objects from color images. The distinctive features of our approach are the the following: (a) the hexagonal structure used in the unified framework for image segmentation, (b) an adaptive method to determine the thresholds used both in the pre-segmentation and in the segmentation step, and (c) an automatic stoping criterion used in the segmentation steps. Our experiments demonstrate
[10] J. Shi and J. Malik, “Normalized cuts and image segmentation,” IEEE Transactions on Pattern Analysis and Machine Intelligence, vol. 22, no. 8, pp. 888–905, 2000. [11] D. Martin and C. Fowlkes. (2002) The Berkeley Segmentation Dataset and Benchmark. [Online]. Available: http://www.cs.berkeley.edu/projects/vision/grouping/segbench/
2349 2353 2341