170
IEEE TRANSACTIONS ON VEHICULAR TECHNOLOGY, VOL. 50, NO. 1, JANUARY 2001
An Algorithm for Detecting Roads and Obstacles in Radar Images Kesav Kaliyaperumal, Sridhar Lakshmanan, and Karl Kluge, Member, IEEE
Abstract—This paper describes an algorithm for detecting roads and obstacles in radar data taken from a millimeter-wave imaging platform mounted on a stationary automobile. Such an algorithm is useful in a system that provides all-weather driving assistance. Road boundaries are detected first. The prior shape of the road boundaries is modeled as a deformable template that describes the road edges in terms of its curvature, orientation, and offset. This template is matched to the underlying gradient field of the radar data using a new criterion. The Metropolis algorithm is used to deform the template so that it “best” matches the underlying gradient field. Obstacles are detected next. The radar returns from image pixels that are identified as being part of the road are processed again, and their power levels are compared to a threshold. Pixels belonging to the road that return a significant (greater than a fixed threshold) amount of incident radar power are identified as potential obstacles. The performance of the algorithm on a large all-weather data set is documented. The road edges and obstacles detected are consistently close to ground truth over the entire data set. A new method for computing the gradient field of radar data is also reported, along with an exposition of the millimeter-wave radar imaging process from a signal-processing perspective. Index Terms—All-weather vision, Bayesian detection, collision avoidance, radar backscatter, 77-GHz radar.
I. INTRODUCTION
T
HIS paper addresses the problem of detecting roads and obstacles from radar data images obtained from an automobile mounted imaging platform. Such radars, operating at millimeter wavelengths, have the ability to penetrate through rain, fog, snow, darkness, etc., and provide an “alternate” image of the scene in front of a vehicle. Fig. 1 shows two road scenes: one obtained in clear weather and the other under foggy conditions. Note that even though the road edges and the cars are difficult to discern in the foggy visual image, they are quite distinct in the corresponding radar image. The radar image, however, is difficult to interpret because its modality, resolution, and perspective are very different from visual images. Without expert training, the position of the roads and obstacles in the radar image cannot be quickly determined. Therefore, the ability to automatically identify and extract roads and obstacles from the radar data and project them onto the normal human plane of Manuscript received May 20, 1999; revised February 25, 2000. This work was supported by the Department of Defense under DoD-DAAH04-95-1-0449 and DoD-DAAE07-96-C-150 and by the National Science Foundation under NSF-CDA9413862 and NSF-EEC9531589. K. Kaliyaperumal and S. Lakshmanan are with the Department of Electrical and Computer Engineering, University of Michigan–Dearborn, Dearborn, MI 48128-1491 USA (e-mail:
[email protected];
[email protected]). K. Kluge is with the Artificial Intelligence Laboratory, University of Michigan, Ann Arbor, MI 48109-5439 USA (e-mail:
[email protected]). Publisher Item Identifier S 0018-9545(01)04230-X.
view is an enabling technology for all-weather driving assistance systems. Automotive radar imaging is a very active area of research and development within the intelligent transportation systems community and has been the central theme in a number of recent publications [6], [7], [9], [11], [14]–[16], [21]–[23]. In order to appreciate why the problem of extracting roads and obstacles from radar images is a difficult one, a close examination of such images is necessary. Images obtained from millimeter-wave radars inherently have poor contrast. This is a direct consequence of the fact that the power level of the radar returns from much of the road scene is relatively small, except for a few isolated points.1 1) The road itself forward scatters much of the incident radar signal and hence returns very little power back to the radar. 2) The sides of the road, because they are of a coarser structure than the road, return a slightly higher amount of power, and 3) Man-made obstacles, such as automobiles, sign posts, fences, etc., which contain sharp polyhedral corners. return a large amount of the incident power. Fig. 2 shows the radar image of a typical road scene. The lack of contrast difference between the road and the sides in the image is especially evident in comparison to the accompanying visual image of the same scene. This already meager contrast further degrades as the range from the radar increases. So, discerning which portion of the radar image corresponds to the road is difficult. Although the radar image consists of large patches of homogeneous radar returns, there are many isolated points where the returns are very high. Several of these points are off the road and hence possess no potential danger to the driver. Therefore, what points constitute a legitimate obstacle to the vehicle is difficult to decide because of the associated risk of high false alarm. This paper presents an algorithm that finds roads and obstacles in millimeter-wave radar images of typical road scenes. It consists of four components. 1) Deformable Template: The shape of a typical road is modeled using a parabolic template, which parameterizes the road edges in terms of its curvature, slant, and offset. Various instances of the roads shape are obtained by varying these parameters. 2) Matching Function: A new likelihood function is formulated to favor deformations of the template that place them 1We refer the reader to [12], [25], and [26] for studies of the electromagnetic phenomenology that underlie the radar imaging process and for a precise mathematical explanation as to why various material surfaces reflect incident millimeter-wave radiation differently.
0018–9545/01$10.00 © 2001 IEEE
KALIYAPERUMAL et al.: DETECTING ROADS AND OBSTACLES IN RADAR IMAGES
Fig. 1.
171
Two road scenes under different weather conditions
Fig. 2. The contrast problem.
and properly orient them over portions of the radar data that possess a sharp and spatially continuous discontinuity. 3) Optimization Algorithm: The template deformation that fits the observed radar data the best (according to the above matching criteria) is obtained by using a Metropolis algorithm—a simulated annealing update strategy that escapes local maxima and finds the globally best fit. 4) Obstacle Detection: The radar returns from image pixels that are identified as being part of the road are processed again, and their power levels are compared to a threshold in order to identify potential obstacles. An all-weather database comprising 37 radar images collected under a variety of weather and lighting conditions was used to test the algorithm. The road edges and obstacles detected were consistently close to ground truth over the entire data set. Algorithms similar to the one described in this paper have indeed been employed previously, especially for extracting spatially structured edges from visual images [3], [5], [8], [10], [17], [18]. ARCADE in [17] uses global road shape constraints derived from an explicit model of how the features defining a road appear in the image plane. A simple one-dimensional edge detection is followed by a least median squares technique for determining the curvature and orientation of the road. Individual lane markers are then directly determined by a segmentation of the row-averaged image intensity values, without any perceptual grouping of the extracted edge points into lane edges. The RALPH system in [18] also uses global road shape constraints. The crux of RALPH is a matching technique that adaptively adjusts and aligns a template to the averaged scanline intensity profile, in order to determine the lanes curvature and lateral offsets. The LOIS lane detector in [10] is yet another example of a lane
detection system that uses global road shape constraints. However, unlike RALPH, LOIS’ match is over the entire image and not just an averaged scan line. LOIS uses a likelihood function that encodes the knowledge that the edges of the lane should be near intensity gradients whose orientations are perpendicular to the lane edge. The algorithm presented in this paper is an adaptation of LOIS in order to find road boundaries in radar images. Several researchers have investigated the use of global shape constraints for processing radar images as well. Reference [6] presents an algorithm that uses a region-homogeneity-based likelihood function to detect straight road edges. This function was constructed based on an understanding of the physical characteristics of the radar imaging process. Reference [15] provides an adaptation of the method used in [6] for curved roads. Reference [7] provides a comparison between region-based and edge-based likelihoods for the purpose of detecting straight edges from millimeter-wave images of runways. The rest of this paper is organized as follows. Section II contains a detailed description of the millimeter-wave imaging process from a signal processing perspective. Section III describes the global shape model, along with the new likelihood (template matching) function. Section IV presents experimental results. This paper concludes in Section V with a discussion of a fundamental issue pertaining to processing of ground-plane data. II. THE MILLIMITER-WAVE IMAGING PROCESS The radar data and visual images used in this paper were all obtained from an imaging platform mounted atop WOLVERINE I, a self-contained testbed vehicle. The imaging platform uses a 77-GHz frequency modulated continuous wave
172
IEEE TRANSACTIONS ON VEHICULAR TECHNOLOGY, VOL. 50, NO. 1, JANUARY 2001
Fig. 3. Radar setup.
(FMCW) radar sensor, which has a range resolution of 0.5 m, an angular resolution of 1 , a maximum range of 128 m, and an angular field of view of 64 . The imaging platform is also equipped with a video camera that is bore-sighted with the radar and captures a visual image of the same road scene. See Fig. 3 for an illustration of the setup. FMCW radar systems are a popular choice in many synthetic vision applications. Such systems operate by transmitting a frequency-modulated signal and provide very accurate information as to the range, azimuth, and velocity of a desired target. FMCW radars typically operate at 10, 24, 38, 77, or 94 GHz, as atmospheric attenuation is at a minimum at these specific frequencies. The main advantage of FMCW radar systems over others is their simplicity of design and better sensitivity. For good range resolution, conventional pulse radars need very short pulse lengths, high peak powers, and high sampling rates. In contrast, FMCW radars give very good range resolution with low transmitter power levels and low sampling rates. In addition, the analysis that needs to be performed on the measurements, in order to obtain range profiles, can be accomplished by simply using fast Fourier transform (FFT) routine and implemented on very fast and cheaply available digital signal-processing chips—see [2], [9], [11], [14], and [21]–[24] for detailed discussions. The following paragraphs provide a signal-processing perspective on the FMCW radar imaging process. The principal characteristic of FMCW radar systems is that the frequency of the transmitted signal is varied as a function of time. Let
denote such a (linearly modulated) FM wave transmitted with a carrier frequency and an instantaneous rate of change of denote the echo of the signal transmitted frequency . Let at time instant , received after a delay of :2 (2) This received signal mixed, resulting in
are (3)
, the instantaneous frequency of Note that at time instant is . . The mixed signal is passed through a low-pass filter to obtain a beat (also known as intermediate frequency) signal given by (4) ’s frequency yields , which in turn deA measurement of termines the target range . All this analysis is illustrated in is triFig. 4, which shows the case when the modulation of angular. and the maxFig. 4 also provides the range resolution imum (unambiguous) range of operation. Range is determined by measuring the beat frequency, and so its resolution is twice the beat-frequency measurement error. Beat frequency is usually measured by a frequency counter, and its associated mea, resulting in surement error is (5) 2If
(1)
and the transmitted signal
the echo is received from a target at range R, then the time delay t =
2R=c.
KALIYAPERUMAL et al.: DETECTING ROADS AND OBSTACLES IN RADAR IMAGES
Fig. 4.
173
Frequency versus time plots for the transmitted, received, and beat frequency signals.
Fig. 5. Block diagram of an FMCW radar system.
The maximum (unambiguous) range of operation is determined by the maximum value that can assume. In the case of triangular modulation, the maximum value that can assume is 1/2 because the beat-frequency signal is distinguishable only , resulting in for values of modulo [0, 1/2 (6) The radar used in this paper operates at a carrier frequency of 77 GHz. Frequency modulation is accomplished by a triangular value of 300 MHz and an value of 1.172 wave, with a MHz. Accordingly, its range resolution is 0.5 m and its maximum (unambiguous) range is 128 m. If the received radar signal is from multiple stationary targets, contains many frequencies depending on the target then ranges from which the echoes are received. In other words, would have a frequency component corresponding to each target, and a Fourier transform of it would yield the individual components and hence the range profile of the respective
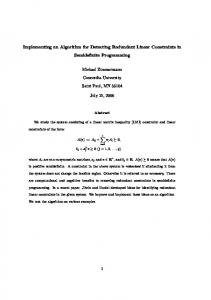
targets—see Fig. 5. If the radar were simultaneously scanning in azimuth also, we could determine the target location in azimuth in a similar way. A stationary target has been assumed up to this point. However, if the target is moving, a Doppler frequency shift due to the target motion will be superimposed on the beat-frequency signal . If the radial velocity of the target is constant, the beat frequency during the up- and down-chirps of the transmitted signal would be constant but different from each other—see [21] and [27]. Consider the visual scene in Fig. 6 that includes two trihedral corner reflectors placed on two Styrofoam pedestals at (24 m, 1 ) and (28.5 m, 7 ), respectively. The corresponding radar image is also shown in that figure. For the two targets of interest in this scene, namely, the two corner reflectors, the corresponding beat-frequency signals are shown in Fig. 7. Note that the differences in the range values of the two targets manifest themselves accurately with respect to the beat frequency. A plot of the composite beat frequency signal’s FFT is shown in Fig. 8, for the two different target azimuths. The peaks of the two signals indicate
174
IEEE TRANSACTIONS ON VEHICULAR TECHNOLOGY, VOL. 50, NO. 1, JANUARY 2001
(a)
(b)
Fig. 6. (a) Visual scene with two prominent targets. (b) Corresponding radar image.
Fig. 7. Beat-frequency signal. Green: target at 24 m range. Blue: target at 28.5 m range.
the range positions from which maximum power was returned to the radar. For each of the targets, these peaks coincide exactly with their respective range positions. The other plot in Fig. 8 is the counterpart, and it shows a plot of the composite beat frequency signal’s FFT for the two different target ranges.
(a)
III. BAYESIAN ROAD DETECTION As mentioned previously, this paper uses a global shape model for road boundaries. In the lane detection and tracking community, it is commonly assumed that roads are circular arcs on a flat ground plane—see [10] and [17]. A circular arc of radius can be reasonably well approximated by a parabola of the form (7) where curvature; slant (tangential orientation of the road); offset from the center of the road; and Cartesian ground plane coordinates. The Cartesian nature of (7) is problematic when it comes to applying it to radar images; an equivalent polar coordinate rep-
(b) Fig. 8. A plot of the composite beat-frequency signal’s FFT. (a) Range and (b) azimuth.
resentation is preferred instead. Substituting and into (7), and solving for in terms of , the cor-
KALIYAPERUMAL et al.: DETECTING ROADS AND OBSTACLES IN RADAR IMAGES
175
responding polar coordinate representation is obtained in (8), as shown at the bottom of the page. A road typically has two concentric edges, which implies that both the right and left road but differing edges satisfy (8) for the same values of and and . values of A priori knowledge exists that real roads are never too narrow, and the left edge is always offset less than the right. This prior belief is expressed via a probability density function (pdf) over values the space of if if
(9)
where denotes the conical lattice that indexes the radar image and denote set of s that comprise the left and and right road edges. In order to detect the road boundaries in a given radar image, values so we deform the boundary using various that it matches the underlying edge features in the image. The degree of match between each deformation and the underlying edge features is evaluated by a likelihood pdf. Taking clues from LOIS, a real-time lane detection algorithm that operates on visual images, it was determined that the likelihood pdf must encode the knowledge that road boundaries should be near portions of the image gradient fields whose magnitudes are significant and whose orientations are perpendicular to the boundaries. The resulting pdf comprises two components: component, which provides a measure of the 1) an magnitude of the radar gradient field along the deformed boundary; component, which provides a measure of the sim2) a ilarity in orientation between the radar gradient field and the normal to the boundary. (10) where denotes the observed radar image. and functions depends on a number The choice of of factors, including what the model/template is, what the cue/feature is, how reliably this cue/feature can be extracted, etc. See [3]–[9] for various examples. Radar images have poor resolution, low signal-to-noise ratio, texture-like local variations, and impulsive-type noise. Upon experimenting with and functions, we concluded that none of various the existing functions can handle all four of these abnormal
Fig. 9. A plot of the G(:) function used in this paper.
characteristics. So, in this paper, the following choices were made:
(11) denotes a spike-like decay function where and denote ( controls the rate of decay) and the magnitude and direction of the radar image’s gradient at . The choice of function is identical to that made pixel . The choice of by LOIS including the value of function on the other hand does not appear to have been used , the function is designed before. By carefully picking ’s contribution to the overall likelihood to exaggerate function over a certain “expected” range of magnitude values. The resulting function is plotted in Fig. 9 and closely resembles the function used in [10], although the two are functionally quite different. and the likelihood pdf The prior pdf are combined using Bayes’ rule, resulting in the road boundary estimation problem’s being cast as a maximum a posteriori (MAP) estimation problem
(12) As with many other MAP problems [1], [3], [6]–[8], [10], [16], the maximization at hand involves a nonconcave function, with several local maxima. To escape these local ones and obtain the
(8)
176
Fig. 10.
IEEE TRANSACTIONS ON VEHICULAR TECHNOLOGY, VOL. 50, NO. 1, JANUARY 2001
Road boundary estimation results on a clear day. The horizontal dark line in all the visual images marks the maximum range (128 m) of the radar.
global MAP estimate, a finite-time version of the Metropolis algorithm with a geometric annealing schedule is used. The same set of algorithm parameters is used for all of the experiments reported.
IV. EXPERIMENTAL RESULTS The algorithm presented in this paper was tested under a variety of weather and lighting conditions—clear daylight,
KALIYAPERUMAL et al.: DETECTING ROADS AND OBSTACLES IN RADAR IMAGES
Fig. 11.
177
Road boundary estimation results under poor visibility.
snow, fog, and nighttime. Images were obtained under these varying conditions from various parts of the southeast Michigan roadway network. Shown in the following figures, overlaid on top of the radar images in those figures, are the road boundary
estimation results on a clear day (Fig. 10) and under poor visibility conditions (Fig. 11). Once the road is identified, the radar returns associated with pixels belonging to the road are compared against a predeter-
178
IEEE TRANSACTIONS ON VEHICULAR TECHNOLOGY, VOL. 50, NO. 1, JANUARY 2001
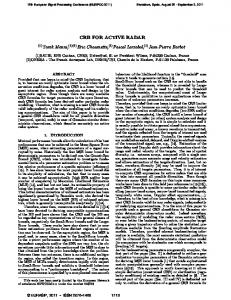
Fig. 12. Obstacle detection results. Green dots overlaid on the radar image register correctly with the position (range and azimuth) of potential obstacles (other vehicles) in the visual image.
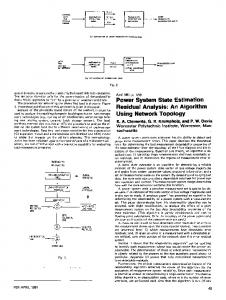
mined threshold. If the associated radar returns are greater than that threshold, then they are declared potential obstacles—see Fig. 12 for several examples. A systematic evaluation of the algorithm’s performance over an entire radar image database (37 in all) was performed. The database contained a variety of images taken on different types of roads, and under different types of weather and/or lighting (including at night). A “correct” estimate of the road boundaries was generated for each image by handpicking boundary points at 16 meter range intervals. Fig. 13 shows a plot of the root mean-squared (rms) error and the spread of the squared error for the left and right edges over the entire database, along with the and functions—the error plots for other choices of the ones in LOIS, a normalization of the LOIS functions with their and , and a logarithmic instead of the sums over
one in eq. (11). Evidently, the and functions used in this paper, significantly outperformed the other choices. The plots in Fig. 13 can also be used to assess whether the algorithm presented in this paper has the potential to meet the performance requirements distilled from the design of an actual automotive safety system. For example, the rms road boundary location error at zero distance from the host vehicle is within half a lane width and remains within a full lane width even at 50 meters distance from the host vehicle. These errors may well satisfy the performance requirements of a run-off-road warning/prevention system. The overall error in the road boundary estimate is in the angular beam width (azimuth ambiguity) same order as the of the radar. Up to 80 meters ahead of the vehicle the boundary error is equivalent to the angular ambiguity of a wide beam, and even beyond 80 meters it only increases to approximately
KALIYAPERUMAL et al.: DETECTING ROADS AND OBSTACLES IN RADAR IMAGES
179
Fig. 13. Error analysis and comparison. (a) and (b) Mean-squared error in the left and right road boundary estimates. (c) and (d) Spread in the error.
(a)
(b)
Fig. 14. (a) PPI format radar image. (b) B-scope format radar image.
. A reduction in the radar beam width (say, from down to ) would result in a further reduction in the boundary estimates’ rms errors, and perhaps make it suitable for overcoming false alarm problems in the design of radar-based forward collision warning systems of the kind described in [21], [22], [24]. In its present form (i.e., with the existing estimation errors), the road boundary estimates provide a focus of attention for ob-
stacles. Stopped and moving obstacles that can falsely be mistaken as potential collision threats, such as wire fences, road signposts, vehicles in oncoming lanes (in a divided roadway), etc., are eliminated from further consideration because they fall outside of the estimated road boundaries—see Figs. 10–12. By reducing the beam width of the radar, a further reduction the error in the road boundary estimate can be effected.
180
IEEE TRANSACTIONS ON VEHICULAR TECHNOLOGY, VOL. 50, NO. 1, JANUARY 2001
Fig. 15.
Prewitt operator. Top: Customary mask. Bottom: Modified mask.
Fig. 16.
Gradient field computation. Top: B-scope format. Bottom: PPI format.
V. CONCLUSION AND DISCUSSION An algorithm for detecting road boundaries from radar images has been developed and tested. It uses a deformable template model of the road shape, a likelihood function to relate a particular deformation of the template to the road edge features in the radar image and a Metropolis algorithm to obtain the “best” fit of the template to the image features. The template model and the image features are adapted to suit typical radar image pro-
cessing. A comparison of various likelihood models is pursued, and it is shown that the function presented in this paper does significantly better than the other previously used choices. Once the road boundaries have been determined, the radar data is post-processedtodetectotherpotential“obstacles”ontheroad.It isargued that this post-processing step can be effectively used to reduce false alarms in forward collision warning systems. This paper concludes with a discussion of an important aspect of ground-level radar images, namely, computation of the image
KALIYAPERUMAL et al.: DETECTING ROADS AND OBSTACLES IN RADAR IMAGES
gradient field. Ground-level radar images can be arranged in two different “formats” (see Fig. 14): • The PPI format: An arrangement of the radar data over a conical lattice image where each lattice point is indexed by its range and azimuth position. • The B-scope format: An arrangement of the radar data over a rectangular lattice image, where the horizontal axis represents the azimuth and the vertical axis represents the range. To compute the gradient field from a radar image, either of the two formats can be used. In all of the previously published works [6], [7] and throughout this paper the gradient field is computed by using the B-scope format. That is, the gradient field is computed using a standard gradient operator, with the range and the azimuth corresponding to the ordinate and abscissa, respectively. Computation of the gradient field using the PPI format is more involved. Estimates of the derivatives with respect to and are obtained first, and then subsequently the horizontal and vertical gradients are derived from those estimates:
(13) factor that weights the derivative w.r.t. is an important The discriminant—as increases, this derivative’s contribution to the horizontal and vertical gradients decreases proportionately. Such a range-dependent weighting is intuitive for ground-level radar images, where an increase in range for a pixel is accompanied by a proportionate increase in the pixel’s “ground print,” or analogously an increase in the distance between adjacent pixels in the ground plane. When standard convolution masks are used for derivative estimation [19], [20], the transformation in eq. (13) can be directly absorbed into the convolution operation. An example of this is shown for the Prewitt mask [20] in Fig. 15. A comparison of the gradient field magnitudes obtained by the two different computations is shown in Fig. 16. Is either one of the two more representative of the true gradient field? A more detailed comparison is necessary.
181
[6] S. Lakshmanan and D. Grimmer, “A deformable template approach to detecting straight edges in radar images,” IEEE Trans. Pattern Anal. Machine Intell., vol. 18, pp. 483–443, 1996. [7] S. Lakshmanan, A. K. Jain, and Y. Zhong, “Detecting straight edges in millimeter-wave images,” in IEEE Int. Conf. Image Processing, 1996, pp. 258–261. [8] A. K. Jain, Y. Zhong, and S. Lakshmanan, “Object matching using deformable templates,” IEEE Trans. Pattern Anal. Machine Intell., vol. 18, pp. 267–278, 1996. [9] K. Kaliyaperumal, “LEXLUTHER: An algorithm for road edge detection in radar images,” M.S. thesis, Department of Electrical and Computer Engineering, University of Michigan–Dearborn, 1997. [10] S. Lakshmanan and K. Kluge, “LOIS: A real-time lane detection algorithm,” in Proc. Conf. Information Sciences and Systems, 1995. [11] D. Langer, “Integrated MMW radar system for outdoor navigation,” in IEEE Int. Conf. Robotics and Automation, 1996, pp. 417–422. [12] A. Nashashibi, F. T. Ulaby, and K. Sarabandi, “Measurement and modeling of the millimeter-wave backscatter response of soil surfaces,” IEEE Trans. Geosci. Remote Sensing, vol. 34, pp. 561–571, 1996. [13] P. N. Strenski and S. Kirkpatrick, “Analysis of finite-length annealing schedules,” Algorithmica, vol. 6, pp. 346–366, 1991. [14] Y. Yamaguchi, M. Sengoku, and S. Motooka, “Using a van-mounted FM-CW radar to detect corner-reflector road boundary markers,” IEEE Trans. Instrum. Meas., vol. 45, pp. 793–799, 1996. [15] M. Nikolova and A. O. Hero III, “Segmentation of road edges from a vehicle-mounted imaging radar,” in Proc. IEEE Signal Processing Workshop Statistical Signal and Array Processing, 1998, pp. 212–215. [16] M. Beauvais, “CLARK: A heterogeneous sensor fusion method for finding lanes and obstacles,” M.S. thesis, Dept. of Electrical and Computer Engineering, University of Michigan–Dearborn, 1998. [17] K. C. Kluge, “Extracting road curvature and orientation from image edge points without perceptual grouping into features,” in Proc. Intelligent Vehicles Symp., 1994, pp. 109–114. [18] D. Pomerleau and T. Jochem, “Rapidly adapting machine vision for automated vehicle steering,” IEEE Expert, vol. 11, pp. 19–27, 1996. [19] J. Canny, “A computational approach to edge detection,” IEEE Trans. Pattern Anal. Machine Intell., vol. PAMI-8, pp. 679–698, 1986. [20] R. Jain, R. Kasturi, and B. Schunk, Machine Vision, New York: McGraw-Hill, 1995. [21] T. Grosch and W. Klimkiewicz, “A 24 GHz FM/CW automotive radar designed for collision warning,” in Proc. SPIE Conf. Intelligent Vehicle Highway Systems, vol. 2344, 1994, pp. 146–158. [22] H. Rohling and E. Lissel, “77 GHz radar sensor for car applications,” in IEEE Int. Radar Conf., 1995, pp. 373–379. [23] F.-J. Tospann, M. Pirkl, and W. Gruner, “Multifunction 35 GHz FMCW radar with frequency scanning antenna for synthetic vision applications,” in Proc. SPIE Conf. Synthetic Vision for Vehicle Guidance and Control, vol. 2463, 1995, pp. 28–37. [24] J. Woll, “VORAD collision warning radar,” in IEEE Int. Radar Conf., 1995, pp. 369–372. [25] K. Sarabandi and S. L. Li, “Characterization of optimum polarization for multiple target discrimination using genetic algorithms,” IEEE Trans. Antennas Propagat., vol. 45, pp. 1810–1817, 1997. [26] F. T. Ulaby, P. Siqueira, A. Nashashibi, and K. Sarabandi, “Semi-empirical model for radar backscatter from snow at 35 and 95 Ghz,” IEEE Trans. Geosci. Remote Sensing, vol. 34, pp. 1059–1064, 1996. [27] M. Skolnik, Introduction to Radar Systems. New York: McGraw-Hill, 1980.
REFERENCES [1] Y. Amit, U. Grenander, and M. Piccioni, “Structured image restoration through deformable templates,” J. Amer. Statist. Assoc., vol. 86, pp. 376–387, 1991. [2] L. Q. Bui, Y. Alon, and T. Morton, “94 GHz FMCW radar for low visibility aircraft landing system,” in IEEE MTT-S Dig., 1991, pp. 1147–1150. [3] M.-P. Dubuisson, S. Lakshmanan, and A. K. Jain, “Vehicle segmentation using deformable templates,” IEEE Trans. Pattern Anal. Machine Intell., vol. 18, pp. 293–308, 1996. [4] D. Geman and G. Reynolds, “Constrained restoration and the recovery of discontinuities,” IEEE Trans. Pattern Anal. Machine Intell., vol. 14, pp. 367–383, 1992. [5] P. J. Green, “Bayesian reconstructions from emission tomography data using a modified EM algorithm,” IEEE Trans. Med. Imag., vol. 9, pp. 84–93, 1990.
Kesav Kaliyaperumal received the B.E. degree in electronics and communications from Anna University, India, in 1995 and the M.S. degree in electrical engineering from the University of Michigan–Dearborn in 1997. His master’s thesis concerned the detection of road boundaries from radar images. He is currently a DSP Engineer with the PCS division at Motorola, Piscataway, NJ.
182
IEEE TRANSACTIONS ON VEHICULAR TECHNOLOGY, VOL. 50, NO. 1, JANUARY 2001
Sridhar Lakshmanan received the B.S. degree in electronics and communications engineering from the Birla Institute of Technology, Mesra, India, in 1985 and the M.S. and Ph.D. degrees in electrical and computer engineering from the University of Massachusetts, Amherst, in 1987 and 1991, respectively. In 1991, he joined the Faculty of the University of Michigan–Dearborn as an Assistant Professor of electrical and computer engineering. In 1997, he became an Associate Professor with tenure. His current research interests are in the areas of computer vision, image processing, and pattern recognition. He is a recipient of several research contracts that address problems in intelligent transportation systems. He is a Consultant to industry and the government on these problems as well. In 1996, he founded M-Vision Inc., a company specializing in the application of computer vision to automotive problems. Prof. Lakshmanan is an Associate Editor for the IEEE TRANSACTIONS ON IMAGE PROCESSING and also serves on the IEEE Intelligent Transportation Research Council.
Karl Kluge (S’89–M’91) received the B.S. degree in computer science from Michigan State University, East Lansing, in 1985 and the M.S. and Ph.D. degrees in computer science from Carnegie-Mellon University, Pittsburgh, PA, in 1988 and 1993, respectively. His doctoral work was on the YARF vision-based road following system. He is currently an Assistant Research Scientist in the Electrical Engineering and Computer Science Department of the University of Michigan, Ann Arbor. His research interests are computer vision, robot navigation, observation planning and sensor fusion, and planning/perception interactions.