How Handwriting Evolves: An Initial Quantitative Analysis of the Development of Indic Scripts Vinodh RAJAN School of Computer Science, University of St Andrews KY16 9SX, St Andrews, SCOTLAND
[email protected] Abstract. Indic scripts are among few scripts in the world that have had continuous development for more than two millennia. The modern forms of the scripts are the result of infinitesimal changes in handwriting being accumulated over centuries. They present us with a unique opportunity to understand various changes occurring in handwriting behavior. We have taken four major Indic scripts in six different stages of evolution and extracted features quantifying their handwriting behavior. We have derived these features by applying the principles of handwriting production and gesture analysis on a paleographic data set. We present various trends and behaviors that occurred during script development and discuss our interpretation of the results in terms of evolution of handwriting behavior. We then briefly discuss the detailed analyses that will be performed on the dataset in the future. We also consider the applications of these results in digital paleography and handwriting-driven systems.
1. Introduction
The myriad of modern Indian scripts that exist today were all derived from the same source script i.e. Brahmi. There have been several competing theories about the origins of Brahmi itself, but the general consensus is that it was largely inspired or derived from the Aramaic script (Salomon, 1998). Probably due to partial constructed nature, the initial shape of the Brahmi script was largely geometrical, but it has given rise to a wide variety of scripts over time due to inherent variations in human handwriting. Indic scripts are among the few script families around the world that have existed as a continuum for several centuries. Hence, for any Indic script, we can derive an “almost” linear evolutionary line from Brahmi. Therefore, we have a unique opportunity to analyze script developments in terms of changes in handwriting behavior. We can investigate how the different handwriting features have evolved in terms of handwriting production and visual appearance. This will also enable us to understand the variations in handwriting that occur due to the complex interplay of different features.
2. Data Set
To obtain a comprehensive view of the script development process we have taken four major scripts belonging to the Brahmic family – Devanagari, Tamil, Kannada and Grantha. These scripts represent most of the important Brahmic scripts in India. We consider the scripts in six stages of evolution. A single stage of a script can be considered to represent ~300 years covering ~1800 years of development. It is to be noted that the scripts themselves show large geographical and scribal variations even over the same time period. Ojha (1959) had presented the development of the scripts by normalizing the shapes, which is utilized by us. However, some characters have had fewer distinct variations compared to others. In such cases we have normalized the number of characters in each script by carrying over the stabilized characters to subsequent developments. We have also considered only glyphs that have had consistent development from Brahmi and ignored secondary developments that have occurred later (such as characters getting derived from other characters using diacritical signs). Grantha, Devanagari and Kannada have ~40 characters each in their repertoire while Tamil has ~20 characters. In total, we have 20 (4 × 5) distinct stages consisting of ~730 distinct glyphs with Brahmi as the source script. (All four scripts share Brahmi as their initial form.)
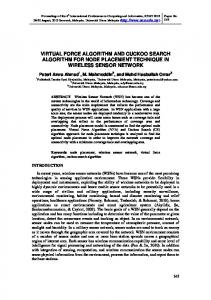
Figure 1. Devanagari Character KA in six different stages of development (Ojha, 1959)
3. Data Extraction
The scripts were digitized using the script analysis framework that was proposed in Rajan (2014a). Characters were first converted into splines, followed by reconstruction of their trajectories and then finally decomposed into their respective strokes. At the end of the process we had the stroke structure of the characters digitized and ready for feature extraction. Rajan (2014b) also proposed a set of objective features that quantify various aspects
of handwriting. From this normalized stroke structure we extract two types of features, geometric features and production features, which were used for subsequent quantitative analyses. The geometric features consisted of 9 different features based on the static shape of characters and the production features consisted of 12 different features based on the written trajectories.
Figure 2. Script Repository
Figure 3. Digitized Character
Figure 4. Decomposed Character
4. Trends in Features
Figure 5. Trends in geometric features
Figure 5 shows the general trend in the averages of various geometric features of scripts across the timescale of development. We can see that the size and length of the glyphs steadily increased over time. Also, the LBIndex (the ratio of width & length) indicates that the glyphs were becoming more and more wide. The outline shapes of the glyphs approached an ideal geometric shape as noted by the increase in circularity and rectangularity. This may be ascribed to the latent human nature to idealize the overall glyph outlines into symmetric shapes. In terms of pen positions, divergence (the difference between starting and ending position of
the pen) increased over time. This appears to be a consequence of a corresponding increase in length of characters. As a result, it would take more effort to maintain the starting and ending positions of the writing instrument near each other. With respective to total length, however the pen positions became closer as shown by the decrease in openness (the ratio of divergence to length). Compactness (the ratio of length and area) also appears to have dropped significantly. Brahmi had more strokes constricted into the same area with scribes further spreading out the strokes. In terms of curvature, the latent trend is towards highly curved glyphs. This is understandable, as it has been suggested that it is easier for humans to produce curved segments as compared to straight lines (Altmann et al., 2008), because the latter requires more effort. To summarize, in terms of the geometric appearance, the general trend appears to be towards “long”, “large”, “symmetric”, “divergent”, “wide”, “curved”, “closed” and “loose” glyphs.
Figure 6. Trends in production features
Figure 6 shows the general trends for the production features. The split in pen count is due to the fact that Devanagari and Kannada developed an additional pen stroke uniformly in all characters. If this is factored in, all the scripts have maintained their characters as effectively requiring a single pen stroke. The average disjoint count (strokes with sharp velocity break during handwriting production), though seen to be increasing, apparently bounds itself, fluctuating between 3.5 and 4.5. This is slightly higher than the proposed average stroke count of three by Changizi et al. (2005). There also seems to be some fluctuation in retraces but at the end it averages to one retrace per character. In terms of the length of upstrokes and downstrokes, it again shows a uniform increase as one would expect based on the increase in the length and size of the characters in Figure 5. Also, Brahmi starts with very low stroke changeability but as scripts developed it increased. This appears to contradict the initial diversification of scripts. (Changeability here refers to the ratio of up and down strokes and hence implies changes in glyphs occurring due to the instability of fundamental strokes, since up strokes are less stable than down strokes (Teulings et al., 1993)). We can assume that such instability effectively contributed the least (if at all) to the diversification, with other factors probably contributing more. Entropy of writing is also shown to be increasing but tending to reach a limit ultimately. In terms of stroke features, length of basic strokes fell initially and then showed a slow growth. In terms of complex strokes (major strokes), there is a more or less uniform increase. In terms of stroke angles, there seem to be a general increase in angles with both the mean and the sum corresponding to the increase in disfluency. In Figure 5 and Figure 6 we can see that many features show logarithmic or “near” logarithmic growth with compactness and openness showing a negative logarithmic growth. Most of these are major features that define handwriting behavior. This shows that characters after an initial period of diversification began to stabilize slowly. Explicit logarithmic growth is seen in cognitively related features like disfluency and entropy, which we consider as significant. One would expect that humans tend to reduce disfluency to increase writing speed but on a large scale it appears not to be the case. Writing appears to have gathered more disfluency, more disjoint strokes and a
corresponding increase in entropy. As discussed earlier, in terms of static features, characters have also gained length and size as time progressed. It also points to the fact that characters show a logarithmic increase in complexity in terms of production and appearance, which is counter-intuitive. Our interpretation is that this is due to “information” being continuously added albeit in minute amounts in terms of production and static appearance. In the end this resulted in complex glyphs that had resulted from what started out as simple geometric figures. But the logarithmic profile of many features points to the fact that the rate of new information being injected into the characters slows down after some time and scripts tend towards stability.
5. Diversifying Features
Discriminant analysis is a frequently used multivariate statistical technique to find aggregate variables that best discriminate groups in a given set of data. This technique when applied to the entire script development data results in discriminants that identify/label characters as belonging to a particular script. These discriminants can be interpreted as the major factors on the basis of which different scripts are identified and differentiated. Consequently, in terms of script development these can be further elaborated as the factors, which caused diversification. The analysis was performed separately with geometric and production features. Table 1. Coefficients of geometric linear discriminants Features Length Size LBIndex Circularity Rectangularity Divergence Openness Avg. Curvature Compactness
LDG1 -0.00059865341 0.00009528834 1.28843838989 -3.48149787949 8.27051387586 -0.00159561490 -0.06621315085 9.73404814509 34.75293555964
LDG2 0.007731254 -0.000115424 0.186680755 8.526610933 -14.373985382 0.008506504 0.124090255 -27.513799916 -30.978259631
With geometric features, we find that the first two linear discriminants - LDG1 and LDG2 - contribute up to ~85% of the discriminatory power. LDG1 discriminates scripts using mostly compactness with minor contributions from average curvature and rectangularity. LDG2 on the other hand discriminates based on nearly equal contribution from average curvature and compactness and significant contribution from rectangularity and circularity. It follows that scripts have diversified based on the following major geometric features compactness, average curvature, circularity and rectangularity. Characters’ curvature and their shape outlines have together played a major role in diversification. However, the fact that compactness has turned out to be a major factor that determines a script is rather surprising. If we consider compactness as related to the arrangement of strokes in a character, it is indeed one of the diversifying factors during script development. Table 2. Coefficients of productive linear discriminants Features Pen Count Disjoint Count Retrace Count Disfluency Up Strokes Down Strokes Changeability Entropy Sum of Disjoint Angles Mean of Disjoint Angles Mean of Fundamental Stroke Lengths Mean of Major Strokes Lengths
LDP1 0.0739570676 -0.4456953605 -0.2803731156 0.0325610130 0.0066029962 0.0035771170 0.0785589768 -0.3723920326 0.0043322933 0.0019477094 -0.0047329371 -0.0000481335
LPP2 -1.2215776695 -0.2275291566 -0.1119661255 0.0350712045 -0.0001094251 -0.0018496560 -0.1844057565 -0.7759867001 0.0084563084 -0.0061158837 0.0035754377 0.0003249647
With production features, we find that the first two linear discriminants – LDP1 and LDP2 – contribute up to ~72% of the discriminatory power. Though this is not very high compared to the geometric features, it is still a reasonable amount of cumulative discrimination. LDP1 classifies characters mainly based on entropy, retrace count and disjoint count with minor contributions from pen count and changeability. LDP2 classifies mostly based on entropy and pen count with significant contributions from disjoint count and retrace count. With
production characteristics, scripts have diversified mostly based on entropy of writing and the number of major strokes in characters contained in a script.
6. Spread of Variations in Characters
Figure 7. Plot of PC1 vs PC4 for scripts in all 6 stages of development. The labels for the data points refer to the Unicode name of the characters.
In section 4, we discussed the general trends in various features of scripts during the script development process. In this section, we analyze the individual character variations that occurred. The original feature set consisting of 9+12 features is too large for individual character-wise analysis. Hence, we proceeded to perform Principal Component Analysis (PCA), which reduced the feature set and also resulted in descriptive aggregate features. Table 3. Loadings of Principal Components Features Length Size LBIndex Circularity Rectangularity Divergence Openness Avg. Curvature Compactness
PC1 -0.476 -0.324 -0.244 -0.478 -0.463 0.350 -0.204
PC2 0.183 0.493 0.253 -0.245 -0.269 0.485 0.256 0.261 -0.399
PC3 -0.300 0.299 0.274 0.348 0.512 0.526 -0.131 0.244
PC4 0.449 0.171 -0.246 -0.237 0.230 -0.139 -0.473 0.597
Table 3 shows the first four principal components derived by applying PCA to geometric features in the dataset. The shown principal components account for nearly 78% of all variance in the dataset and hence are sufficient to abstract the multivariate dataset. PC1 is a comparison between openness and mainly circularity, rectangularity, and length. Characters that are “open”, “short” and “asymmetric” have positive scores, while “closed”, “long” and “symmetric” characters will have large negative scores. PC2 compares compactness, circularity and rectangularity with mostly size and divergence. Characters with negative PC2 scores are typically “compact” and very “symmetric”. Positive scores indicate characters that are “large” “loose” “divergent”. For PC3, high negative scores indicate “large” and highly “curved” characters. For PC4, large negative scores point to highly “curved” and “symmetric” characters with positive scores pointing to characters that lack those characteristics.
We specifically discuss the plots of PC1 vs PC4 for illustration. It can be clearly seen from Figure 7 that Brahmi characters had very similar geometric profiles initially (evident by the crowded overlap of characters). But as time passed by, the characters did diverge significantly as discussed earlier. Here we can see a particular pattern in the diversification process. In Brahmi, the characters are primarily around the first and fourth quadrant boundary. The characters are just “open” “short” and “asymmetric” During the second stage of diversification characters gain more “symmetry” “closure” and “length” moving towards other quadrants but mostly dispersing towards the first and third quadrants with ultimately many of the characters moving into the second and third quadrants thus gaining “curved symmetry” along with “lengthy closure”. We can clearly see the interplay of features that cause the variations. Other principal components were also compared to derive information on other aspects of variations that occurred. We performed similar analysis on the production features.
6. Future Work
The nature of distribution of features and their corresponding changes are very interesting phenomena, which needs to be analyzed. The influence of usage frequency on character properties is also to be studied in detail. We are currently analyzing the change in stroke inventory and their impacts on character self-similarity within the scripts. We also plan to extract specific feature sets that have produced fairly stable characters. The very important interaction between the geometric and production features behavior is to be studied in the future.
7. Applications
Paleography has mostly been a subjective field. The quantitative techniques and feature sets used by us contribute towards a more objective and quantitative paleographic analysis. Although, the results presented here are specific to Indic scripts, the techniques can be duplicated and expanded for other kinds of paleographic scripts. Findings from paleography can also be applied to Human-Computer Interaction. If Brahmi is considered as an archetypical “constructed” set, many of the results presented here (and the results of our future work) can be used to construct “optimal” gesture sets. Learning from such paleographic patterns and behavior, we can attempt to construct gesture sets that are natural, easy to use and stable.
7. Conclusion
We have presented our initial quantitative analysis of the development of Indic scripts using Devanagari, Kannada, Tamil and Grantha as archetypes. We have presented the general trends in handwriting that occurred during script development and our analysis and interpretation of those trends. We also found the major features on the basis of which the scripts diversified over the years. Additionally, we analyzed the variations acquired by individual characters using aggregate features. We briefly discussed future work and possible practical applications of this analysis in the fields of Digital Paleography and HCI.
References
Altmann, G., and Fan F. (2008). (Eds.). Analyses of script: properties of characters and writing systems. Vol. 63. Walter de Gruyter. APA Changizi, M. A., and Shimojo, S. (2005). Character complexity and redundancy in writing systems over human history. Proceedings of the Royal Society B: Biological Sciences, 272(1560): 267-275. Ojha, G. H. (1959). Bharatiya Prachina Lipimala. New Delhi Rajan, V. (2014a). Framework for Quantitative Analysis of Scripts. Proceedings of Digital Humanities, DH 2014. Rajan. V. (2014b). Quantifying Scripts: Defining metrics of characters for quantitative and descriptive analysis [Manuscript submitted for publication, arXiv:1501.01894] Salomon, R. (1998). Indian Epigraphy. A Guide to the Study of Inscriptions in Sanskrit, Prakrit, and the Other Indo-Aryan Languages. Teulings, H. L., and Schomaker, L. R. (1993). Invariant properties between stroke features in handwriting. Acta psychologica, 82(1): 69-88.