use of an ant colony optimization (ACO) algorithm to solve ... RWA algorithms under test in terms of blocking probability .... (ACS) algorithm by Dorigo et al. [10].
542
IEEE JOURNAL ON SELECTED AREAS IN COMMUNICATIONS, VOL. 28, NO. 4, MAY 2010
An Ant-Based Algorithm for Distributed Routing and Wavelength Assignment in Dynamic Optical Networks Joan Triay, Student Member, IEEE, and Cristina Cervell´o-Pastor Abstract—Future optical communication networks are expected to change radically during the next decade. To meet the demanded bandwidth requirements, more dynamism, scalability and automatism will need to be provided. This will also require addressing issues such as the design of highly distributed control plane systems and their associated algorithms to respond to network changes very rapidly. In this work, we propose the use of an ant colony optimization (ACO) algorithm to solve the intrinsic problem of the routing and wavelength assignment (RWA) on wavelength continuity constraint optical networks. The main advantage of the protocol is its distributed nature, which provides higher survivability to network failures or traffic congestion. The protocol has been applied to a specific type of future optical network based on the optical switching of bursts. It has been evaluated through extensive simulations with very promising results, particularly on highly congested scenarios where the load balancing capabilities of the protocol become especially efficient. Results on a partially meshed network like NSFNET show that the ant-based protocol outperforms other RWA algorithms under test in terms of blocking probability without worsening other metrics such as mean route length. Index Terms—Optical fiber communication, algorithms, communication system routing.
I. I NTRODUCTION PTICAL communication networks play a key role in today’s Internet. They provide huge capacity through fibre links thanks to the bandwidth available on the optical channel. Furthermore, with the rising in the late 90’s of the Wavelength Division Multiplexing (WDM) technology, the optical channel capacity has been increased by several orders of magnitude. So far, these networks have been somewhat static and fixed. Obviously, the fixed characteristic has its origins on the network infrastructure composed of fixed underground fibre links and channeled pipes that do not allow the mobility of the network nodes. However, the static characteristic of today’s networks is more a technological constraint than a physical constraint. Currently, the provisioning of communication channels in these networks is done per connection, that is, prior to the transmission of data, the control plane initiates the reservation of resources along the path between the communication peers, and it remains reserved even though no real transmission of data is present. As a result, this type of networks, commonly known as Optical Circuit-Switched (OCS) networks, are somewhat inefficient. Therefore, to overcome this inefficiency we need a more dynamic optical network able to share the optical
O
Manuscript received 1 March 2009; revised 18 October. The authors are with the Department of Telematics Engineering, Universitat Polit`ecnica de Catalunya (UPC), Esteve Terradas, 7, 08860, Castelldefels, Spain (e-mails: {joan.triay;cristina}@entel.upc.edu). Digital Object Identifier 10.1109/JSAC.2010.100504.
channel among different traffic sources still keeping a high efficient resources provisioning. Optical Burst Switching (OBS) [1] and Optical Packet Switching (OPS) [2] are two such optical network technologies that offer statistical multiplexing capabilities. OBS provides granularity in between wavelengths and packets and it is seen as an intermediate step between the current OCS and the future OPS. Nevertheless, it is worth mentioning that due to the use of one-way signaling systems and the lack of efficient and cost-effective optical buffering architectures for these two technologies, contentions can occur in the optical domain, hence producing, even at low loads, a large number of data losses. This is, perhaps, one of the most important issues on this type of networks. Bursts and packets are quite short in comparison to the reserved optical channels that OCS provides, thus the network becomes more dynamic and flexible, requiring to run agile algorithms in the provisioning phase. In addition, networks can grow to dozens or maybe hundreds of nodes, making centralized algorithms unfeasible. Therefore, we need to design and engineer efficient distributed algorithms. The routing and wavelength assignment (RWA) process is perhaps the most challenging task in optical networks, particularly on those that the selection of the wavelength must be done according to the wavelength continuity constraint (i.e. the same lambda must be used from the origin to the destination node). The RWA has to be efficient in order to avoid – or minimize– the number of data losses in the core of the network or optimize the network resources utilization. Some past approaches devise centralized control planes in which the assignment of routes and wavelengths is carried out by a central node [3]. This node is in charge of keeping an updated view of the network state, and using this information, performs the provisioning of resources for the rest of network nodes. However, this approach does not seem very realistic, specially for the case of dealing with very dynamic environments. Ant Colony Optimization (ACO) [4] comprises a set of algorithms used for the optimization of several problems. In essence, ACO algorithms try to emulate the biological behavior of ant colonies on their task of foraging for food. In the real world, ants initially wander randomly. Upon finding food, they return to their colony, and on this way back to the colony, ants lay down pheromone trails which can be used by other ants to find more food. Eventually, if these ants also find food, they return back to the colony reinforcing the same trail. Over time, the pheromone trails tend to evaporate, thus reducing their attractive strength. However, if the ants use
c 2010 IEEE 0733-8716/10/$25.00 � Authorized licensed use limited to: UNIVERSITAT POLIT?CNICA DE CATALUNYA. Downloaded on April 30,2010 at 09:11:26 UTC from IEEE Xplore. Restrictions apply.
´ TRIAY and CERVELLO-PASTOR: AN ANT-BASED ALGORITHM FOR DISTRIBUTED ROUTING AND WAVELENGTH ASSIGNMENT
shorter paths, they can come back to the colony more rapidly, thus reinforcing this kind of paths in comparison with longer ones. Due to its distributed nature, ACO can be an interesting solution to support the control plane mechanisms on dynamic networks. In this article we contribute on two main aspects: (1) we apply an autonomous ant-based colony algorithm into the RWA process of a future dynamic optical network with wavelength continuity constraint; and (2) we extend and adapt the conventional path-scoring methods of ACO algorithms using both switching congestion information and path length to efficiently choose the optimum route and wavelength for every optical transmission. An inherent advantage of using the proposed architecture is that the routing and wavelength assignment is now totally distributed. The remainder of the paper is organized as follows. In section II, some previous works that make use of ACO algorithms on current and next-generation optical networks are introduced and the motivations behind the present work pointed out. Section III presents in detail the ACO protocol proposal, while section IV describes the implementation issues of the ant-based protocol on OBS networks. Section V is devoted to the analysis of the protocol through simulation and finally, section VI summarizes the main conclusions of the paper. II. BACKGROUND ON ACO ALGORITHMS FOR O PTICAL N ETWORKS AND MOTIVATION Ant colony optimization algorithms have an advantage over simulated annealing and genetic algorithm approaches on similar problems when the graph or the network state changes dynamically. As the ACO algorithm can run continuously, it can adapt better to changes in real time. This is a very interesting feature for highly dynamic future optical networks, as it will be in this case. The use of ant-based algorithms is not new on optical communication networks. In particular, some ant-based routing algorithms have already been proposed for solving RWA algorithms in WDM networks [5][6]. However, these proposals are not suitable for dynamic WDM OBS and OPS networks as they are devised for the static wavelength-routed RWA scenario. Regarding the implementation of ACO algorithms in OPS, the most famous work is probably [7]. In the paper, the authors present an ant-based protocol to support the traffic engineering and restoration processes in OPS networks. Nevertheless, the implementation is restricted to an scenario with fullwavelength conversion capability at each node. So far, the only work about ant-based algorithms in OBS networks is [8]. Shi et al. present for the first time an antbased algorithm applied to an OBS network using forward and backward control packets. The backward control packets are responsible for updating the pheromone trail using an ant density approach. Ant colonies are defined for each origindestination pair. The work provides a first introduction of this kind of bio-inspired algorithms for this specific type of networks. However, they only use the algorithm to search for the best routes, not taking into account the wavelength
543
selection. In fact, the wavelength assignment runs randomly and the authors assume full wavelength conversion in each network node. There exist other similar works that simulate the behavior of biological ant-based algorithms in OBS; however, they do not mention anywhere this fact. For instance, in [9] the authors describe a scenario where each node receives feedback packets announcing whether the transmission of a burst is successful or not. According to this result, the probabilities to transmit through a certain route are incremented or decremented. They improve the search space by means of self-learning searching packets sent in parallel to the real control packet that carries the burst information. Their results show that in some scenarios an improvement of nearly a decade can be achieved in comparison with the shortest path algorithm. Nevertheless, we can identify two main problems. The first is probability stagnation when the number of transmissions are quite large. This implies that the probabilities vary only through very short increments-decrements, thus changing slowly the lookup and updating of the best routes. And second, there is no real collective behavior between the feedback packets from different origin nodes, and therefore, the protocol does not take any advantage of the distributed approach. The results obtained by previous works are very promising. They demonstrate the feasibility of using such type of algorithms in the RWA process. However, most of the cited works assume full availability of wavelength converters (WC) in every network node, not taking into account the high cost of this type of equipment. Likewise, the absence of WC imposes a great constraint so new types of information and algorithms are needed to calculate the next hop towards the destination of data. This fact, together with the need of provisioning totally distributed algorithms able to cope with the dynamics of future optical networks, motivate the present work. III. A NT C OLONY ROUTING AND WAVELENGTH A SSIGNMENT FOR DYNAMIC O PTICAL N ETWORKS In this section, the proposed ant-based RWA algorithm, Ant Colony Routing and Wavelength Assignment (ACRWA), is described in detail. The main purpose of ACRWA is to run a globally distributed optical resources assignment. Thus, one of the main advantages of the protocol in comparison to previous works is that the ant-based approach is used in a way that permits ants from different colonies interact and share information among them with the common objective of improving the overall network performance. ACRWA is based on the well-known Ant Colony System (ACS) algorithm by Dorigo et al. [10]. ACS is, originally, a solution for resolving problems such as the Traveling Salesman Problem (TSP). In the following subsections, we go through all the changes and improvements in order to apply the algorithm to the routing and wavelength assignment in wavelength continuity constraint optical networks. A. Pheromone trails: choosing the right information In ACRWA, the pheromone concentrations, τ , are computed according to two sources of information. The first type is the congestion level, which is a measure of the number of
Authorized licensed use limited to: UNIVERSITAT POLIT?CNICA DE CATALUNYA. Downloaded on April 30,2010 at 09:11:26 UTC from IEEE Xplore. Restrictions apply.
544
IEEE JOURNAL ON SELECTED AREAS IN COMMUNICATIONS, VOL. 28, NO. 4, MAY 2010
TABLE I P HEROMONE TABLE .
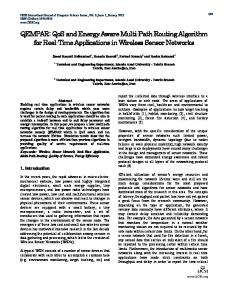
Input Link Link1 Fig. 1.
Switch diagram with 2 links and 4 wavelengths.
contentions that have happened through a specific output port. The greater the number of contentions, the smaller the pheromone deposition should be. In comparison to other ant-based algorithms for WDM networks, in a wavelength continuity constraint network the number of free wavelengths is no longer a good measure for the congestion level due to the absence of wavelength converters in the network nodes. The second source of information is the path length. Short paths imply less allocation of optical resources for a single transaction, and as a consequence, more resources can be available for other transmissions. Therefore, shorter paths can decrease the congestion level among different traffic flows, as long as these flows, in turn, are correctly balanced and distributed over a number of paths. So, the shorter the path, the greater the pheromone deposition through a given output port will be. In the forwarding process of the ant, ACS also provides an extra value, called desirability and represented by η. This value gives heuristic information about the attractiveness or desirability of a certain move of the ant. For example, for problems where the distance (or cost) of a path needs to be minimized, the desirability may take a value inversely proportional to the distance (or cost) between the nodes. In ACRWA, the meaning of this value is kept using the same type of information. However, in this specific case, the distance refers to the shortest path length from the current node –the one that is processing the ant– to the destination node using a certain output port. Thus, the desirability is defined as, ηnj =
1 f (x)
(1)
where f (x) is equal to the length of the shortest path from node n, through output port j to destination m, as defined by Eq. (2), f (x) = | xm+ n,j (t) |
(2)
B. Pheromone table Every network node has a pheromone table (PT). Both updating and transition rules make use of it. Each pheromone value is associated with a particular switching/routing configuration, that is, for every input switch port, output port and wavelength there exists a pheromone in the PT. As it can be inferred, the number of switching configurations depends on the number of links connected to the network node and the switching matrix capacity. The space complexity of the algorithm related to the amount of storage space required by the pheromone table is O(V 2 W ), where V is the number
Link2
Wave 1 2 3 4 1 2 3 4
Output link Link1 Link2 τ1,1,1 τ1,2,1 τ1,1,2 τ1,2,2 τ1,1,3 τ1,2,3 τ1,1,4 τ1,2,4 τ2,1,1 τ2,2,1 τ2,1,2 τ2,2,2 τ2,1,3 τ2,2,3 τ2,1,4 τ2,2,4
of vertices (nodes) in the network, and W is the number of wavelengths. It should be noted that this represents the worst case in which a node is linked to all the remaining nodes of the network. Table I shows a pheromone table example of the nonblocking switch from Fig. 1 with 2 input and output ports and 4 wavelengths. The subindexes of the pheromone value, τijk , have the following meaning: i is the input port (link), j represents the output port, and k is the wavelength switched between the two ports. C. ACRWA algorithm The ACRWA protocol is composed of two main algorithms. The algorithm shown in Fig. 2 is responsible for running the first stages of the protocol such as the initialization of the parameters values and routing tables. A routing protocol is used in order to get the list of k-shortest routes to every remaining network node using for each route a different output port at the node running the routing protocol. Using these routing tables, each node n –that will forward ants in the future using the state transition rule– builds the candidates list Nnm of available neighbor nodes for every destination node m. The tables are also used to calculate the desirability values ηnj of Nnm . Likewise, the list of wavelength candidates Wnm is also initialized in this process, which for simplicity is set to W , the total number of wavelength available in the network. Once all these steps are over, the network nodes are ready to process data transmissions. Next algorithm in Fig. 3 shows the specific behavior followed by the ant (data) on its task of foraging for food, i.e. the destination node of the data packet. Initially, the node runs the RWA process to select the next node and wavelength on which the data is going to be transmitted. After this initial stage, the ant (data) is routed to its destination using the antbased algorithm. At every hop, the ant runs the transition rule. The first step in this process is the computation of a random number which is used to decide if the ant is going to exploit previous pheromone deposits or try to look for new possible routes. If the node exploits, it checks the list of candidates to forward the ant and calculates the next node using Eq. (4). Either using the exploration with Eq. (5), or the exploitation of results, the aim is to get a suitable output port (i.e. next hop) towards the destination node. Once the next output port is selected, the node controller schedules and reserves resources
Authorized licensed use limited to: UNIVERSITAT POLIT?CNICA DE CATALUNYA. Downloaded on April 30,2010 at 09:11:26 UTC from IEEE Xplore. Restrictions apply.
´ TRIAY and CERVELLO-PASTOR: AN ANT-BASED ALGORITHM FOR DISTRIBUTED ROUTING AND WAVELENGTH ASSIGNMENT
variables: W wavelengths, N nodes; Initialize parameters α1 ,ρ1 ,β,ω,φ,r0 ; for each node n ∈ N do Initialize routing tables; m ← N − {n}; for each possible destination m do Initialize candidate nodes list Nnm ; Compute initial ηnj using Nnm ; Initialize candidate lambdas list Wnm ← W ; end for end for loop if data to transmit then create ant and run ACRWA algorithm; end if end loop Fig. 2.
Initialization algorithm.
to transmit the ant (data). Eventually, a collision can happen using this port. In this case, the ant is blocked and the global updating rule is initiated using a negative feedback on the reverse path. Otherwise, if the ant finally arrives to destination, it means that the transmission of data has been successful, so that the global updating rule is started, but now using a positive feedback. The global updating rule (see Eq. (6)) is used by the feedback ants on the reverse path followed by the forward ant (data). The algorithm finishes when the feedback ant arrives the data source. Regarding the complexity of the algorithm, consider the network modeled by an undirected graph G = (V, E, W ) where V represents the set of vertices (nodes), and E represents the set of edges (links) each one with W wavelengths. The worst case algorithm complexity added by an ant throughout its traveling period will be O(V W +2V 2 ) ∼ (V 2 ), if V ∼ W , calculated as follows: the initial wavelength assignment, which implies the lookup of the best wavelength and output port to transmit the ant (data), adds a cost of O(V W ). Once the lambda is assigned, the computational complexity added at every hop of the ant is O(V ), taking into account that the transition and updating rules imply an operation that can be run in constant time (O(1)), but must be applied at every possible node of the candidates list, which at the most can be in the order O(V ). As a result, the forward and backward processing of the ant adds a complexity of O(2V 2 ). Next subsections describe in detail every equation used in the algorithm. Hereafter we use the notation (t) on some of the protocol parameters to remark the possibility that the values can change throughout time.
545
xm (t) ← �; Antblocked ← f alse; if xm (t) = � then run initial RWA using Eq. (3); end if repeat if ∃j ∈ Nnm (t) then r ← random(); if r ≤ r0 then for all j ∈ Nnm (t) do Choose u ∈ Nnm (t) using Eq. (4); end for else for all j ∈ Nnm (t) do Calculate empirical probability distribution FJm (j) using Eq. (5); end for Choose u ← FJm (j); end if xm (t) ← xm (t) ∪ {link(n, u)}; if ant reservation on link(n, u) is false then Antblocked ← true; end if if Antblocked is false then run positive local updating rule using Eq. (9); end if else Antblocked ← true; end if until (ant arrives destination) OR (Antblocked is true); repeat xm (t) ← xm (t) − {link(n, u)}; run global updating rule using Eq. (6); until xm (t) = � OR reverse ant arrives origin node; Fig. 3.
ACRWA algorithm.
is not only to calculate the best possible output port, but also to choose the best wavelength. In ACRWA, the wavelength selection makes use of the same pheromone tables, as in the forwarding of ants (data), but now considering the input port the node itself. The algorithm chooses the lambda (λ) and output port (u) following a formula very similar to the state transition rule. As it can be seen on Eq. (3), the result of the RWA is the greatest value of the product between the pheromone deposition (τijk ) of a certain output port and wavelength and the desirability (ηnj ) of using such output port.
D. Initial wavelength assignment The routing and wavelength assignment algorithm is run by the nodes for each new data transmission query. Due to the wavelength continuity constraint on the optical network, the RWA must be run carefully as the switching efficiency in the core of the network strongly depends on it. Thus, the objective
β (t)} | j ∈ Nnm (t), k ∈ Wnm (t)} {u, λ} = {arg max{τijk (t)ηnj (3) To emphasize the use of shorter paths, the β value can be changed to favor the use of certain output ports, e.g. an output port that belongs to the shortest path.
Authorized licensed use limited to: UNIVERSITAT POLIT?CNICA DE CATALUNYA. Downloaded on April 30,2010 at 09:11:26 UTC from IEEE Xplore. Restrictions apply.
546
f
IEEE JOURNAL ON SELECTED AREAS IN COMMUNICATIONS, VOL. 28, NO. 4, MAY 2010
1
1
0.8
0.8 0.6
0.6
τ(t+1) 0.4
0.4
0.2
0.2 1 0
0.8
0.6 τ
0.4
0.2
0
5
4
f1 = τijkηnj1.0
Fig. 4.
0 0
1 2 3 path length
f2 = τijkηnj
0.2
0.4 ρ1
0 0.6
0.8
1
2 3
1 Δl (-0.75Δl)
τ(t+1) = (1-ρ1)0.1+ρ1e(-0.75Δl) τ(t+1) = (1-ρ1)1.0+ρ1e
2.0
Evaluation of Eq. (4) with β = 1.0 and β = 2.0.
Fig. 5.
Global updating rule analysis with two different pheromones.
E. State transition rule
F. Global updating rule
The state transition rule is responsible for choosing the next hop (output link) in the ant (data) routing process toward its destination node. The chosen ACO transition rule is a pseudo-random-proportional action rule [10] developed to explicitly balance the exploration and exploitation abilities of the algorithm to look for a suitable path. A forward ant from input port i and wavelength k located at a node n, selects the next node u (or output link) to switch to using the rule,
The global updating rule is performed by feedback ants. This kind of ants carry information about the success of the data delivery to the destination. The feedback ants follow the reverse path followed by the forward ant and on their way back to the origin of the data they update the pheromone trails using the global updating rule. In contrast with the original ACS algorithm, here, all the feedback ants are allowed to reinforce or weaken pheromone concentrations. Eq. (6) shows the updating rule used by all feedback ants,
� u=
β arg maxj∈Nnm (t) {τijk (t)ηnj (t)} J
if r ≤ r0 if r > r0
τijk (t + 1) = (1 − ρ1 )τijk (t) + ρ1 γij Δτijk (4)
where r ∼ U (0, 1), and r0 ∈ [0, 1] is a user-specified parameter. τijk is the pheromone concentration of a given switching configuration. β is another user-specified parameter that controls the potential benefit of choosing the output link j with a desirability value of ηnj . Fig. 4 shows the evaluation β (t) when β = 1.0 and β = 2.0. We can see of τijk (t)ηnj that for a fixed pheromone concentration, the shorter the path length through a given output port, the greater the value of the function, specially for large values of τijk . As well as this, the greater the value of β, the more varied the values for different path lengths (“dotted surface”) at a fixed pheromone value. Therefore, depending on β, the transition rule in Eq. (4) creates a bias toward the nodes which are members of the shortest paths with a large amount of pheromone. Nnm is the set of valid nodes to forward the data (a candidate list to favor specific nodes), avoiding loops or ports without a feasible route to destination. r0 is the parameter used to balance between exploration and exploitation: if r ≤ r0 , the algorithm exploits favoring the best output port for the current data; otherwise, if r > r0 the algorithm explores choosing u from the candidates list Nnm (t) with an empirical distribution with pmf fJ (j) = Pr(J = j) = Pr{u ∈ Nnm (t) : J(u) = j} = piuk (t), where, piuk (t) = �
β (t) τiuk (t)ηnu
j∈Nnm
β τijk (t)ηnj (t)
(5)
(6)
where ρ1 is again a user-specified value. If ρ1 is small, then the pheromone concentrations evaporate slowly, and if it is greater, the previous experience (pheromone) is neglected in favor of more recent experiences. γij is a value that depends on the success of the ant (data) reception as well as on the path, xm (t), traveled by the ant. ⎧ m ⎪ ⎨+1 if link(n, j) ∈ x (t) and success = true γij = −1 if link(n, j) ∈ xm (t) and success = f alse ⎪ ⎩ 0 if link(n, j) ∈ xm (t) (7) The amount of new pheromone deposited by the returning ant is calculated assuming an ant-cycle implementation, where pheromone deposits are subject to exponential decay, that is, the deposit decreases at a rate proportional to a given value that depends on the length of the path followed by the feedback ant so far, Δτijk = e−ωΔl
(8)
where Δl = |xrn (t)| − |x+ n (t)|, being respectively the values of the substraction, the length of the reverse path followed by the returning ant so far and the length of the shortest path to the origin of that ant from the current node that processes it. Thus, if the route followed to reach the destination is the shortest (or equivalent) and the reception of the ant (data) is correct, the value of Δl is 0 and Δτijk = 1, depositing the maximum possible amount of pheromone. The parameter ω is the decay constant; the greater its value, the faster the
Authorized licensed use limited to: UNIVERSITAT POLIT?CNICA DE CATALUNYA. Downloaded on April 30,2010 at 09:11:26 UTC from IEEE Xplore. Restrictions apply.
´ TRIAY and CERVELLO-PASTOR: AN ANT-BASED ALGORITHM FOR DISTRIBUTED ROUTING AND WAVELENGTH ASSIGNMENT
exponential vanishes. Therefore, ω can be used to control the amount of deposition. Fig. 5 shows two examples of how the value of Δl strongly affects the final updated pheromone value as a function of ρ1 . Thus, if ρ1 is large and the previous pheromone value is also large, a bad solution using a longer path than the shortest (or equivalent) can decrease the value of the pheromone concentration considerably. G. Local updating rule The last rule used in the protocol is the local updating rule. The main goal of this rule is to diversify the search performed by subsequent ants and probabilistically favor good switching solutions (ant movements). The local updating rule is only applied after a successful switching reservation, before forwarding the ant to the next node. For the output port where the reservation has been scheduled, the pheromone trail is updated as follows, τijk (t + 1) = τijk (t) + α1 e−φΔl
(9)
Here, α1 is another user-specified parameter. Care must be taken to make sure that for positive reservations the pheromone value is not incremented too much so that local good solutions (i.e. a successful output reservation) but global bad solutions (i.e. using this next output link leads to a congested network node) are not favored in excess. The parameter φ is the decay constant and it has the same meaning as ω in Eq. (8). IV. A LGORITHM IMPLEMENTATION FOR OBS Optical Burst Switching is a promising network technology for the future optical Internet. As it can be sensed by its name, it is based on the transport and optical switching of bursts. OBS is highly dynamic due to the fact that reservations are made per burst, so that traffics from different sources share the channel capacity. At the edge of the network, data packets are assembled into a bigger data unit, a burst. Many different assembly schemes are possible, from time-based to size-based assembly algorithms, through a great variety of hybrid algorithms that mix both time and size thresholds. Originally, in OBS the transmission of the burst is delayed by an offset time which normally depends on the burst route length. During this time, a burst control packet (BCP) is transmitted and processed electronically by the intermediate nodes along the path from the origin to the destination of the burst. It is worth mentioning that this process involves an optical-to-electrical-to-optical (O-E-O) conversion in order to process the BCP as it is shown in Fig. 6. When the offset time elapses, the burst is transmitted and switched all-optically without acknowledging that the optical resources have been reserved by the BCP. Due to this one-way signalling system, losses can occur in the core of the network. In OBS without any means of contention resolution, a burst contention occurs if two bursts, from two different input ports and on the same wavelength need to leave the optical switch through the same output port at the same time. Recall that the bursts are switched without any O-E-O conversion, as it is shown in Fig. 6. In the current design of the ant algorithm for OBS the functionalities of the forward ant are implemented into the BCP,
547
and the feedback ants use a new type of acknowledgement control packet (BCP-ACK). As pointed by the connectionless approach of OBS [11], BCP-ACKs are not used to confirm the reservation of resources prior to the transmission of the burst. In the present case, this kind of packets are only used to acknowledge the positive or negative delivery of the burst to its destination. In ACRWA, the end-to-end path from the origin OBS node to the destination node is not known a priori. During the burst forwarding, the next output port is calculated hop by hop. In such a case, the path may comprise the least number of possible hops using the shortest path or take a long route. Therefore, in some cases, the path may be longer than expected, so making it difficult to calculate the best offset time in order to reduce the end-to-end delay of the burst, and at the same time, to avoid the burst loss due to the expiration of the offset. Consequently, to enable the protocol on an OBS network, an offset time-emulated scheme [12] is implemented along with the extra processing and scheduling tasks of ACRWA. As a result, with the emulated scheme, the offset value no longer depends on the route length, so that, a specific time value is not needed. However, in order to give enough time to the switching and reservation controllers to reserve the optical resources, the upcoming burst is delayed at each input port of the network node by means of a Fiber Delay Line (FDL) of a length equivalent to the BCP processing time. Fig. 6 shows a diagram of a core OBS network node. As it can be seen, a pool of FDLs are placed at the input data ports in front of the WDM demultiplexers to delay the bursts and give time to the control packet to be processed. Previously, before the data channels get into the FDLs, the control wavelength is filtered out to the O/E converter in order to process the control packets electronically. In any case, the architecture of this type of node does not greatly differ from the common architecture, and in this work does not only fulfill the purposes of ACRWA, but also provides many other benefits. For instance, it also enhances fairness in resource allocation for the bursts as the offset time is constant and not decreased along the path. For more information about the offset time-emulated architecture readers are refereed to [12]. Finally, in OBS the availability of lambdas over an output port is no longer a good measure for the goodness of a linkwave, specially in the wavelength continuity constraint case. Congestion level or the number of burst contentions through a specific switching configuration on a given output port provide a more useful measure. Therefore, in OBS ACRWA, the pheromone trails keep track of the contentions and positive burst deliveries, as it has been introduced in section III-A. V. N UMERICAL RESULTS In this section, the network performance of the ACRWA protocol implementation on optical burst switching is evaluated through simulation. To this end, two different network scenarios have been used. The first one is the fish-like network composed of 8 OBS nodes shown in Fig. 7, and the second scenario is the NSFNET network with 14 nodes and 21 links in Fig. 8. The objective is twofold: first, to test in a simple
Authorized licensed use limited to: UNIVERSITAT POLIT?CNICA DE CATALUNYA. Downloaded on April 30,2010 at 09:11:26 UTC from IEEE Xplore. Restrictions apply.
548
IEEE JOURNAL ON SELECTED AREAS IN COMMUNICATIONS, VOL. 28, NO. 4, MAY 2010
Fig. 6.
OBS core node architecture with offset time emulation.
Fig. 7.
Fish-like network with 8 nodes.
and easy-to-manage network the operation of the algorithm, and second, to evaluate it on a more realistic scenario. In order to compare ACRWA results, three other RWA protocols are also used throughout the simulations, namely: shortest path routing with random wavelength selection (SR), random path routing and wavelength assignment (RR) and shortest path routing with first-fit Traffic Engineering wavelength selection (FFTE). In the specific case of RR, every node calculates three (when possible) different routes for each destination node, and among them, it uniformly selects one of these routes and one wavelength for transmitting the burst. In the FFTE case [13], every node has a list of assignable wavelengths, but in a different order, and from that list, it selects the first one (first-fit) that suits the burst transmission. In all the scenarios, a wavelength capacity of 10 Gbps is assumed, however the number of wavelengths on the network vary between the two chosen scenarios, as it will be explained later. Regarding the setup of the hardware devices, the control packet processing time and the non-blocking matrix switching setup are set to 10 μs and 5 μs, respectively. Moreover, an initial burst query processing of 1 μs is added between the generation of the burst and its transmission scheduling. Following one of the motivations of this present work, we devise a network without wavelength conversion, thus, the data transmissions must fulfill the wavelength continuity constraint. With regard to the traffic characteristics, a size-based algorithm [14] is used in the burst assembly with a packet arrival distribution following a Poisson process. The average packet size is set to 485 bytes. Bursts are of fixed size and equal to 100,000 bytes, which on a 10 Gbps channel is equivalent to 80 μs. With such short burst size, the network runs on a very dynamic environment, so that the dynamic properties
Fig. 8.
NSFNET with 14 nodes and 21 links.
of the ACRWA protocol can be evaluated in detail. Many different works [15] deal with OBS network scenarios with burst sizes in this order of magnitude. Nevertheless, it is worth mentioning that there are also a number of works that devise burst sizes in the order of ms, specially on Grid over OBS [16]. The simulation method changes between the two network scenarios. On the fish-like network, the results have been gathered by repetition (30 simulation runs), and on the NSFNET, the batch means method has been used instead. In both cases the results have been averaged over at least 30 measures in order to obtain 95% confidence intervals for all the results. However, the intervals are so narrow that they are omitted in order to improve the readability of the figures. The value of the ACRWA parameters ω and φ has been set constant (both = 0.75) taking into account that Δl will not be very large for the network topologies considered in the simulations. Thus, for different values of α1 and ρ1 we will get a varied range of pheromone depositions for the global and local updating rules. The parameters (r0 , ρ1 , α1 , and β) vary among the different simulations in order to analyze how they influence the performance of the protocol. Table II shows the values used throughout the different simulation runs. A. Results on the fish-like network The scenario we consider here is a fish-like network composed of eight OBS network nodes as shown in Fig. 7. Our aim here is to specifically validate the operation of the routing
Authorized licensed use limited to: UNIVERSITAT POLIT?CNICA DE CATALUNYA. Downloaded on April 30,2010 at 09:11:26 UTC from IEEE Xplore. Restrictions apply.
´ TRIAY and CERVELLO-PASTOR: AN ANT-BASED ALGORITHM FOR DISTRIBUTED ROUTING AND WAVELENGTH ASSIGNMENT
α1=0.001,β=1.0,ρ1=0.1
0.5
1
SR RR ACRWA
Link and wavelength load
Burst blocking probability
0.6
0.4 0.3 0.2 0.1 0
LinkN4-N5,WL1 LinkN4-N5,WL2 LinkN4-N6,WL1 LinkN4-N6,WL2
0.8
0.6
0.4
0.2
0 0
20
40
60
80
100
0
20
40
Time (ms)
0.35
Burst blocking probability
0.4
ρ1=0.01 ρ1=0.1 ρ1=0.25 ρ1=0.50 ρ1=0.75 ρ1=0.99
α1=0.001,β=1.0
0.3
α1=0.001,β=2.0
0.35
0.25 0.2 0.15 0.1 0.05
100
0.3
ρ1=0.01 ρ1=0.1 ρ1=0.25 ρ1=0.50 ρ1=0.75 ρ1=0.99
0.25 0.2 0.15 0.1 0.05
0
0 0
10
20
30
40
50
60
70
Time (ms) (c) Burst blocking of ACRWA with α1 = 0.001 and β = 1.0.
0
10
20
30
40
50
60
70
Time (ms) (d) Burst blocking of ACRWA with α1 = 0.001 and β = 2.0.
Simulations on the fish-like network with 2 wavelengths. TABLE II PARAMETERS VALUES USED IN THE SIMULATIONS .
Parameter r0 ω and φ ρ1 α1 β
80
(b) Link and wavelength utilization of the ACRWA protocol.
Burst blocking probability
0.4
60
Time (ms)
(a) Burst blocking comparison of different RWA protocols.
Fig. 9.
549
Fish-Like 0.8 0.75 0.01, 0.1, 0.25, 0.5, 0.75, 0.99 0, 0.005, 0.01, 0.1 0, 0.5, 1.0, 1.5, 2.0
NSFNET 0.9 0.75 0.001, 0.01, 0.1 0.001 1.0, 2.0, 3.0
and wavelength assignment of ACRWA and its performance throughout time. To this end, three heavy hitter traffic flows of 0.66 Er. each (adding up 2 Er. in total) are transmitted from three different traffic sources (nodes N1, N2 and N3) to the same destination node (N8). In this scenario, all the traffic has to be switched/routed at a common node (N4), hence this node becomes a possible bottleneck. The simulation starts with the network empty, and at time 0.5 ms the three flows are inserted from their correspondent source nodes. The number of lambdas is intentionally reduced to only two in order to make easier the analysis of results.
Fig. 9(a) shows a comparison between ACRWA, SR and RR in terms of burst blocking probability (BBP). The x-axis represents the time elapsed from the beginning of the simulation run. A clear differentiation can be observed regarding the blocking performance between the three protocols. As expected, SR gets the worst BBP due to the fact that the three traffic source nodes (N1, N2 and N3) use the shortest path through N5 for delivering the bursts so that nearly half of them get blocked at N4. In a similar way, RR does not overcome the congestion state at N4 though making use of the two possible routes between the sources and node N8. On the contrary, in ACRWA we have some burst losses at the beginning of the simulation, but then, the protocol overcomes the situation canceling the contentions for the rest of the simulation run. ACRWA balances the traffic load between the two possible routes and wavelengths according to the pheromone values and the state transition rule. Thus, after an initial period of time within the ants (BCPs) forage for the best route-lambda, the protocol stabilizes the pheromone values that permit to cancel the contentions. In ACRWA, bursts are no longer transmitted over the shortest path, but balanced, not only over different routes,
Authorized licensed use limited to: UNIVERSITAT POLIT?CNICA DE CATALUNYA. Downloaded on April 30,2010 at 09:11:26 UTC from IEEE Xplore. Restrictions apply.
550
IEEE JOURNAL ON SELECTED AREAS IN COMMUNICATIONS, VOL. 28, NO. 4, MAY 2010 400 300 α1=0
time (ms)
200 100 0 0.2
2 0.4 ρ1
1.5 0.6
1 0.8
0.5
β
0
(a) As a function of ρ1 and β with α1 = 0. 400 300 α1=0.001
time (ms)
200 100 0 0.2
2 0.4 ρ1
1.5 0.6
1 0.8
0.5
β
0
(b) As a function of ρ1 and β with α1 = 0.001.
many transmissions through the shortest path, which increases the number of burst collisions and negative updates of the pheromone trail for the shortest route, hence switching to the other path more rapidly. As we have seen, the parameters setting of the ACRWA has a great impact on the BBP and the time to cancel it. Next we provide a deeper analysis about the parametrization of ACRWA. Table II shows the values given to ρ1 , α1 and β for the fish-like simulation scenario resulting in 90 different simulation cases. Due to this parameter and value variability the results are now shown in 3D-format. The z-axis represents the converge time to cancel further burst collisions within a time-frame of 400 ms. Figs. 10(a), 10(b), and 10(c) show a comparison of the parametrization of α1 as a function of ρ1 and β. We can see how, in general, the smaller the value of ρ1 , the more time the protocol needs to cancel the contentions, as it has been described in Fig. 9(c). Likewise, on the comparison among the three graphs we can see that the greater the value of α1 , the shorter the convergence time for medium values of ρ1 . So, when using large values of α1 in the local updating rule, successful burst switchings update the pheromone values with greater increments, and as a consequence they remark more rapidly the link-wave that the upcoming bursts shall take.
400 300 α1=0.01
time (ms)
200 100 0 0.2
2 0.4 ρ1
1.5 0.6
1 0.8
0.5
β
0
(c) As a function of ρ1 and β with α1 = 0.01. Fig. 10. Time to cancel burst collisions on the fish-like network with 8 nodes and 2 wavelengths using ACRWA.
but also over different wavelengths. Fig. 9(b) shows the link and wavelength utilization for the ACRWA case in the same network simulation scenario. The link between N4 and N5, which belongs to the shortest path is more loaded than the link N4-N6. The pheromone scoring method takes into account the length of the path and the congestion level, and for that reason, in front of two possible paths with different path lengths and the same congestion level, it takes the shortest. The next two graphics in Fig. 9(c) and Fig. 9(d), show the performance of the protocol under different parameters values of β (1.0 and 2.0) and 0 < ρ1 < 1.0. From these two figures, we are interested in evaluating the convergence time that ACRWA takes to cancel further burst collisions. It can be seen, in general, that either large or small values of ρ1 tend to prolong the contention period. When ρ1 is small, the pheromone trail is updated in small steps (depositions), hence more positive/negative burst deliveries are needed in order to foster a certain switching configuration at N4. Interestingly, we can also see that increasing the value of β, as in Fig. 9(d), the convergence time also decreases faster. A large value of β triggers, especially at the beginning of the simulation,
B. Results on the NSFNET network In addition to the previous results, in this section the performance of the protocol under a more realistic scenario, such as the NSFNET network, is also evaluated. In this specific case there are 16 wavelengths on the network, with a capacity of 10 Gbps per channel. This number of wavelengths is already a representative value for the deployment of partially meshed WDM networks. As in the previous subsection, the burst length is limited to 100,000 bytes. Now the simulation uses the batch means method for gathering the results about burst loss probability and mean route length. In Fig. 11 the burst blocking probability is represented for different ACRWA parameterizations as a function of the total offered traffic load in Erlangs per wavelength. Fig. 11(a) depicts the results for different values of ρ1 when α1 = 0.001 and β = 3.0. Interestingly, at low loads, when the value of ρ1 is very small, the burst contention rate remains higher with respect to greater values of ρ1 . Due to the lesser number of bursts to transmit at low offered loads, with small values of ρ1 the pheromone trail changes over time at a lower rate which causes the switching configurations between different alternatives to be less emphasized. A similar pheromone value in the state transition rule (Eq. 4) with exploration (r > r0 ) does not strenuously boost the use of a certain routing decision using the empirical distribution, so that BCPs (ants) wander at a higher rate, which can cause more burst collisions. However, at high loads, with a greater number of bursts transmissions, and thus, on a more dynamic scenario, a smaller value of ρ1 provides better results in comparison with ρ1 = 0.01 or ρ1 = 0.1. In this case, the exploitation of the pheromones is fostered instead of the exploration done by the BCPs, and therefore the past good knowledge of certain routing/switching configurations is kept. With the value of ρ1 that provides the best results, Fig. 11(b) shows the blocking probability for different values of
Authorized licensed use limited to: UNIVERSITAT POLIT?CNICA DE CATALUNYA. Downloaded on April 30,2010 at 09:11:26 UTC from IEEE Xplore. Restrictions apply.
´ TRIAY and CERVELLO-PASTOR: AN ANT-BASED ALGORITHM FOR DISTRIBUTED ROUTING AND WAVELENGTH ASSIGNMENT
1
Burst blocking probability
Burst blocking probability
1
0.1
0.01
0.001 ρ1=0.1 ρ1=0.01 ρ1=0.001
0.0001 0
2
4
6
8
0.1
0.01 β=1.0 β=2.0 β=3.0
0.001 10
0
2
Offered load (Er/wl)
8
10
(b) As a function of β with α1 = 0.001 and ρ1 = 0.001.
1
3.5
0.1
3
Mean number hops
Burst blocking probability
6
ACRWA burst blocking probability evaluation on the NSFNET with 16 wavelengths.
0.01
0.001
RR SR FFTE ACRWA
0.0001 0
2
4
6
8
RR SR FFTE ACRWA
2.5
2
1.5 10
0
2
Offered load (Er/wl)
4
6
8
10
Offered load (Er/wl)
(a) Burst blocking probability. Fig. 12.
4
Offered load (Er/wl)
(a) As a function of ρ1 with α1 = 0.001 and β = 3.0. Fig. 11.
551
(b) Mean number of hops.
Comparison of the network performance for different RWA protocol on the NSFNET with 16 wavelengths.
β. Although at high loads, the plots almost converge to the same point, at low and medium loads we can see that the best performance is achieved for β = 3.0. When β is increased, shorter routes are boosted with respect to others and as the network load is not very high, short routes can still provide the best results. In conclusion, the protocol parametrization has a great impact on the performance perceived under different network scenarios. Table III summarizes some of the main conclusions described so far. The two fixed parameters are given in the first column, whereas in the second the best performance is described when the remaining parameter from the triple {α1 , β, ρ1 } is changed. The uparrow, ↑, indicates that the best result is achieved when the specified parameter is increased, whereas ↓ is used if the value is decreased. Finally, Fig. 12 compares the burst blocking probability and the mean route length (in number of hops) of ACRWA and the other three aforementioned RWA protocols: SR, RR and FFTE. The ACRWA plots correspond to the case in which α1 = 0.001, β = 3.0 and ρ1 = 0.001. As it can be seen in Fig. 12(a), ACRWA almost outperforms the rest of the protocols for the whole considered offered load. Only at very low loads
TABLE III PARAMETER PERFORMANCE ON NSFNET.
Fixed parameters α and ρ1 α and β
Best performance if parameter β ↑. Depending on network load: - if low load ⇒ ρ1 ↑, - if high load ⇒ ρ1 ↓
does FFTE get the best results due to the fact that with 16 wavelengths on the network, each one of the 14 nodes has at least a first-fit preferred lambda that it uses and no other node does. Recall that in the FFTE protocol, each node has an ordered list of wavelengths to use, but with a different start index order. RR obtains the worst performance as the random selection of the route not only increases the average traveled length of the delivered bursts, but also makes use of the network resources inefficiently, leading to a congestion state sooner. To support this, Fig. 12(b) shows the mean route length in which RR also gets the greatest values. All plots
Authorized licensed use limited to: UNIVERSITAT POLIT?CNICA DE CATALUNYA. Downloaded on April 30,2010 at 09:11:26 UTC from IEEE Xplore. Restrictions apply.
552
IEEE JOURNAL ON SELECTED AREAS IN COMMUNICATIONS, VOL. 28, NO. 4, MAY 2010
present an almost liner decreasing tendency, very noticeable in the RR case. However, in ACRWA the decreasing rate is slowed down due to the fact that the routes followed by the bursts are more balanced as the protocol enhances the burst delivery rate even over paths that are not necessarily the shortest ones. Results obtained from other simulation scenarios, such as the pan-European network with 28 nodes and 41 links [17], with the same parameter values used on the NSFNET, show a very similar protocol comparison performance. Nevertheless, in the former case the average path length is increased with regard to the NSFNET, which causes for all the protocols under study a general increase of the BBP. VI. C ONCLUSION Future optical networks will be particularly different to the networks known so far, demanding for more dynamism, scalability, robustness and autonomous capabilities. In this paper, an Ant Colony Optimization algorithm, ACRWA, has been successfully applied to improve the performance of the routing and wavelength process on highly dynamic optical networks with wavelength continuity constraint. For instance, in optical burst switching the forward ants are implemented as burst control packets, whereas feedback ants, which gather information about the positive or negative delivery of the bursts, are a special type of acknowledgment control packet. The algorithm takes into account both the path length and the congestion in the network to update the values of the pheromone trails. The protocol has been evaluated through simulation and from the results we can conclude that ACRWA outperforms the rest of the protocols considered in this work on scenarios where the load balancing among different routes and lambdas is possible. Likewise, it has been shown that ACRWA is highly parameterizable, so that different parameter values can enhance the network performance on many different scenarios. ACKNOWLEDGMENT Work supported by the Government of Spain and FEDER through project TEC2009-13901-C02-01, the i2CAT Foundation’s project TARIFA, the EC-FP7 EURO-NF NoE and by the Government of Catalonia and the European Social Fund through a pre-doctoral scholarship (FI). The authors would also like to thank the anonymous reviewers and Chinwe E. Abosi for their comments and improvements to the paper. R EFERENCES [1] Y. Chen, C. Qiao, and X. Yu, “Optical Burst Switching: A New Area in Optical Networking Research”, IEEE Network, 18(3):16–23, May 2004. [2] S. Yao, B. Mukherjee, and S. Dixit, “Advances in photonic packet switching: an overview”, IEEE Commun. Mag., 38(2):84–94, Feb. 2000. [3] M. D¨user and P. Bayvel, “Analysis of a Dynamically Wavelength-Routed Optical Burst Switched Network Architecture”, IEEE J. Lightwave Technol., 20(4):574–585, Apr. 2002. [4] M. Dorigo and T. Sttzle, Ant Colony Optimization, The MIT Press, Massachusetts, 2004. [5] R.M. Garlick and R.S. Barr, “Dynamic Wavelength Routing in WDM Networks via Ant Colony Optimization”, In Proc. of the 3rd International Workshop on Ant Algorithms. Lecture Notes in Computer Science (LNCS), volume 2463, pp. 240–255, Sep. 2002.
[6] S.H. Ngo, X. Jian, and S. Horiguchi, “An ant-based approach for dynamic RWA in optical WDM networks”, Photonic Network Communications, 11(1):39–48, Jan. 2006. [7] G.S. Pavani and H. Waldman, “Traffic Engineering and Restoration in Optical Packet Switching Networks by means of Ant Colony Optimization”, In Proc. of the 2006 3rd Int. Conf. on Broadband Communications (BROADNETS), pp. 1068–1077, San Jos´e (CA), USA, Oct. 2006. [8] Z. Shia, Y. TinJin and Z. Bing, “Ant algorithm in OBS RWA”, In Cedrid F. Lam, Wanyi Gu, Norbert Hanik, and Kimio Oguchi, editors, Proc. SPIE, Optical Transmission, Switching and Subsystems II, volume 5625, pp. 705–713, Feb. 2005. [9] D. Ishii, N. Yamanaka, and I. Sasase, “Self-learning route selection scheme using multipath searching packets in an OBS network”, OSA J. Optical Networking, 4(7):432–445, Jul. 2005. [10] M. Dorigo and L.M. Gambardella, “Ant Colony System: A Cooperative Learning Approach to the Traveling Salesman Problem”, IEEE Trans. Evol. Comput., 1(1):53–66, Apr. 1997. [11] M.A. Aydin, T. Atmaca, H. Zaim, O.C. Turna, and V.H. Nguyen, “Performance study of OBS reservation protocols”, Proc. 2008 4th Advanced Int. Conf. on Telecommunications (AICT08), pp. 428–433, Athens, Greece, Jun. 2008. [12] M. Klinkwoski, Offset Time-Emulated Architecture for Optical Burst Switching - Modelling and Performance Evaluation, PhD Thesis. Department of Computer Architecture. Universitat Polit`ecnica de Catalunya (UPC), Nov. 2007. [13] J. Teng, and G.N. Rouskas, “Wavelength Selection in OBS Networks using Traffic Engineering and Priority-Based Concepts”, IEEE J. Sel. Areas Commun., 23(8):1658–1669, Aug. 2005. [14] A. Rostami, and A. Wolisz. “Modelling and Synthesis of Traffic in Optical Burst-Switched Networks”. IEEE J. Lightwave Technol., 25(10):2942–52, Oct. 2007. [15] J.A. Hern´andez, P. Reviriego, J.L. Garc´ıa-Dorado, V. L´opez, D. Larrabeiti, and J. Aracil, “Performance Evaluation and Design of Polymorphous OBS Networks With Guaranteed TDM Services”, IEEE J. Lightwave Technol., 27(13):2495–2505, July 2009. [16] G. Zervas, Y. Qin, R. Nejabati, D. Simeonidou, F. Callegati, A. Campi, and W. Cerroni, “SIP-enabled Optical Burst Switching Architectures and Protocols for Application-aware Optical Networks”, Computer Networks, 52(10):2065–2076, July 2008. [17] R. Hulsermann, A. Betker, M. Jager, S. Bodamer, M. Barry, J. Spath, C. Gauger, and M. Kohn, “A Set of Typical Transport Network Scenarios for Network Modelling”, ITG Fachbericht, no. 182, pp. 65-72, 2004. Joan Triay received a BEng and a MEng in Telecommunications Engineering, and a MSc in Telematics Engineering at the Universitat Polit`ecnica de Catalunya (UPC), Spain, in 2004, 2006 and 2007, respectively. In 2007, he was awarded with a 4-year pre-doctoral scholarship through the Research Training Program (FI) from the Government of Catalonia, and since then he is a PhD candidate and research assistant in the Department of Telematics Engineering at UPC. He was a visiting fellow at University of Essex, United Kingdom, from June 2009 to February 2010 thanks to a BE-DGR fellowship. His research interests include, but not limited to, future optical network architectures and the provisioning of multi-service capabilities on high-speed networks. Cristina Cervell´o-Pastor received her MSc degree in Telecom Engineering in 1989 and Ph.D degree in Telecommunication Engineering in 1998, both from the Escola T`ecnica Superior d’Enginyers de Telecomunicaci´o, Universitat Polit`ecnica de Catalunya (UPC), Barcelona, Spain. She is currently an Associate Professor in the Department of Telematics Engineering at UPC, which she joined in 1989, and leader of the optical networks research group within the BAMPLA group. Her research trajectory has been centered on the field of routing in high speed networks and the development of new protocols and services in OBS/OPS, taking part in diverse national and European projects (FEDERICA, ATDMA, A@DAN, Euro-NGI, Euro-FGI, EURO-NF) and being responsible of various public and private funding R&D projects, some of them with the i2CAT Foundation. In parallel she has presented several patent proposals about OBS networks.
Authorized licensed use limited to: UNIVERSITAT POLIT?CNICA DE CATALUNYA. Downloaded on April 30,2010 at 09:11:26 UTC from IEEE Xplore. Restrictions apply.