important. Emanuel (1959) derived a set of procedures ..... according to the methods of Emanuel. Figure 3 .... Apte, C. and Weiss, S., "Data mining with decision ...
Proceedings of the 11th WSEAS International Conference on COMPUTERS, Agios Nikolaos, Crete Island, Greece, July 26-28, 2007
56
An application of data mining technique in Engineering to facilitate production management of garments Hai-Fen Lin 1, Chih-Hung Hsu 2, Mao-Jiun J. Wang 3 Department of Industrial Engineering and Engineering Management, National Tsing Hua University, Hsinchu 300, Taiwan, R.O.C. 2 Department of Industrial Engineering and Management, Hsiuping Institute of Technology, Taiwan, R.O.C. 13
Abstract: - In the field of garment manufacturing, the planning and control of production and inventory are very difficult. Thus, establishing standard sizing systems are necessary and important for manufacturers. Because standard sizing systems need anthropometric data for reference, so we first construct a large anthropometric database. Data mining has been extensively used in many fields. Little research has been conducted on establishing sizing systems. This study aims to establish systems for determining the sizes of garments for army soldiers using a data mining technique. The newly developed sizing systems can correctly predict the requirements for different sizes of uniforms, and thus to generate a realistic production planning. Unnecessary inventory costs due to sizing mismatches between number of soldiers and produced garments can be minimized. Key-Words: - Anthropometric data, Data mining, Sizing systems, Production management, Garment manufacturing
1 Introduction Garment manufacturing is the highest value-added industry in the textile industry manufacturing chain [1]. Mass production by machines in the garment industry has replaced manual manufacturing, so the planning and control of production and inventory are very important for manufacturer. . Moreover, this type of manufacturing follows certain standards and specifications and each country has its own standard sizing systems for manufacturers to follow and fit in with the figure types of the local population. Standard sizing systems can correctly predict manufacturing quantity and proportion, resulting more accurate production planning and control of materials [2] [3]. The standard sizing systems have been used as a communication tool among manufacturers, retailers, and consumers. It can provide manufacturers with size specification, design development, pattern grading and market analysis. Manufacturers, basing their judgments on the information, can produce different type of garments with various allowances for specific market segmentation. Thus, establishing standard sizing systems are necessary and important. Emanuel (1959) derived a set of procedures for formulating standard sizes for all figure types. According to his system, people with any type of
figure were first classified into one of four bodyweight groups. These groups were subdivided into two categories specified by body height - short and tall [4]. People were thus divided into eight categories of similar heights and weights. The sizing systems in other countries were also similar, and classifications were based on two or three sizing variables. The sizing variables most commonly used for males’ clothing are body height, chest girth and waist girth; the sizing variables for females’ clothing are typically body height, bust girth and hip girth [5] [6]. McCulloch et al. (1998) proposed criteria by which sizing systems could be evaluated [7]. z The fewest number of sizes, z The greatest number of people can be covered by the sizing system. These criteria sometimes conflict with each other. Which should take higher priority depends on the type of garment and the needs of the customer.
2 Data mining and decision trees Fayyad (1997) defined knowledge discovery in databases (KDD) as the nontrivial process of identifying valid, novel, potentially useful and ultimately understandable patterns in data [8]. Berry and Linoff (2000) defined data mining as the analysis of a huge amount of data by
Proceedings of the 11th WSEAS International Conference on COMPUTERS, Agios Nikolaos, Crete Island, Greece, July 26-28, 2007
automatic or semi-automatic means to identify significant relationships and rules. Data mining has been extensively used as a major step of KDD [9]. It has been successfully applied in many fields, such as manufacturing [10], job shop schedule [11], biomedicine [12], health insurance [13], finance [14] and the prediction of country investment risk [15]. However, research on establishing sizing systems using data mining is lacking. The decision tree technique is an important method of data mining. Its main function is to classify data according to the rules deduced from input variables, displaying them in a tree-shaped form and then exploring factors of significant influence. The technique is strongly suited to data mining. Data can be divided into two types: discrete and continuous. Different decision tree algorithms suit different types of data. Among the available algorithms, the classification and regression tree (CART) is the most appropriate method for generating a decision tree for processing continuous data [16] [17]. Since anthropometric data is continuous, this research employs CART as the classification tool used in data mining. CART uses a tree-shaped structure to classify data into categories. Its basic principle is to put the pre-processed data into the root of a tree, and then, by performing a series of classifications, finds the best separating points, forming a tree-shaped structure. The classification rules separate the data according to the purity or impurity of the child nodes. These rules incorporate the valuable information gleaned by mining the data and they can be fully used in data classification [18]. The most important property of CART is that it can reduce the complexity of the decision tree, including its depth and the number of child nodes, while enhancing the accuracy of classification. The key to a CART algorithm is to identify important attributes - predictive variables - by considering which target variables can be divided into a number of child nodes. Each splitting reduces the impurity of the child nodes, until the samples in every child node are of the same type [19]. This study attempts to explore and analyze a large amount of anthropometric data using decision tree based data mining. In particular, the CART technique is used to identify significant patterns based on which the figures of Taiwanese military personnel can be classified and establish
57
the standard sizing systems. The newly developed sizing systems will be established according to the four working cycle of data mining.
3 The Data Mining Procedure 3.1 First step of data mining: defining the problem Because standard sizing systems for soldier’s uniforms were outdated and incomplete, a large anthropometric database was constructed in Taiwan. The database includes anthropometric data of 610 samples. For each person, 265 static anthropometric variables were measured, resulting in a total of 161,650 data. This study analyzes a large amount of data by applying the decision tree approach to data mining, and identifies systematic patterns in bodily dimensions. Based on these patterns, the representative figure types of Taiwanese military personnel are classified, and the standard sizing systems can be established. The army soldiers’ database is selected for developing sizing systems because of the urgent need for accurate sizing systems for producing army uniforms. This work will be beneficial to the production of military uniforms in Taiwan.
3.2 Second step of data mining: preparing and analyzing data The processing and transformation of the data increase the efficiency and ensure the accuracy of its analysis. Before the data are mined, they must be examined and purified. In this study, all the missing or abnormal data were omitted. Consequently, among the 610 samples of army soldiers, the 8 samples with missing or abnormal data were excluded, leaving a total of 602 valid samples for further processing. Because all these dimensions are measured in millimeters with decimals, and so were transformed into integers in centimeters, for comparison with commonly used international garment-sizing units. Additionally, the two anthropometric variables, body weight and body height, were transformed into a new variable, the body mass index (BMI). This was used as the target variable of the decision tree, to facilitate data mining. The World Health Organization defines BMI as body weight divided by body height squared. It is used in medical science as a reference for judging obesity-related diseases and whether a figure type is standard or not. The Taiwan military officials also take BMI between 16.5 and 32 as a
Proceedings of the 11th WSEAS International Conference on COMPUTERS, Agios Nikolaos, Crete Island, Greece, July 26-28, 2007
The results of factor analysis presented in Table I show that, besides body weight, the top Table 1. Factor loading after varimax rotation Factor 1 Factor 2 Chest girth 0.887* 0.103 Waist girth 0.885* 0.113 Hip girth 0.867* 0.229 Neck girth 0.712* 0.107 Chest width 0.859* 0.113 Back width 0.530 0.114 Shoulder width 0.859* 0.110 Body height 0.138 0.943* Cervical height 0.142 0.940* Back waist length 0.192 0.531 Arm length 0.215 0.719* Body weight 0.874* 0.317 Variance 5.472 2.798 explained Total proportion 0.456 0.233 * Marked loadings are > 0 .7
three anthropometric variables that were most closely correlated with the girth factor were chest girth, waist girth and hip girth. Chest girth is the anthropometric variable most closely correlated with the girth factor, in the field of garment making, chest girth is also the most important variable in establishing sizing systems. Therefore, chest girth is selected to represent the girth factor. Body height is the anthropometric
variable correlated most closely with the height factor so body height was selected to represent the height factor.
3.3
Third step of data mining: data mining by a decision tree technique
Following Step 2, the chest girth and body height were selected as the most important sizing variables. Then, data were mined by applying the CART decision tree technique. BMI is a comprehensive index of body weight and body height. This study adopts BMI as the target variable. Chest girth and body height are the predictive variables for classifying the target variable. The following stopping rules are set as follows. z The greatest depth of the tree extends to the third level beneath the root node. z The minimum number of samples in the parent node is 100, and that in the child node is 40. The results of CART analysis from which the classification rules can be identified. The root node was split according to the chest girth, resulting in the first level. A total of 401 samples whose chest girth were smaller than or equal to 88.5 cm were grouped into Node 1, and 201 samples with chest girth greater than 88.5 cm were grouped into Node 2. Then Node 1 was split according to chest girth to yield the second level of the tree. One hundred fifteen samples with chest girth of less than or equal to 82.5 cm, were grouped into Node 3, and the other 286 samples, whose chest girth exceeded than 82.5 cm, were grouped into Node 4. Node 2 was also split similarly: 133 samples with chest girth of less than or equal to 94.5 cm were grouped into Node 5, and the other 68 samples with chest girth of over than 94.5 cm, 110
100
Waist girth (cm)
criterion to select qualified military personnel. Not all of the 265 anthropometric variables are useful for establishing garment- sizing systems; therefore, the bodily dimensions commonly adopted in garment manufacturing are first considered. Domain experts were consulted to identify 12 anthropometric variables that are strongly associated with garment production. Using all 12 anthropometric variables to establish sizing systems would be very complicated. Therefore, factor analysis was applied herein to extract the important factors. According to Kaiser’s eigenvalue criterion, two factors whose eigenvalues of over one were selected [20]. Then, factor loadings were calculated to determine the correlation coefficients between the two factors and the anthropometric variables. The anthropometric variables with factor loadings of over 0.7 were found to be clustered in Factors 1 and 2, as shown in Table 1.
58
90
80 Node 6 Extra Larg Node 5 Large
70
Node 4 Medium 60 70
Node 3 Small 80
90
100
110
Chest girth (cm)
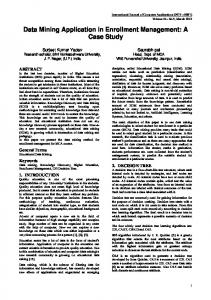
Figure 1. Scatter plot of chest girth vs. waist girth for four figure types
Proceedings of the 11th WSEAS International Conference on COMPUTERS, Agios Nikolaos, Crete Island, Greece, July 26-28, 2007
were grouped into Node 6. The first 2 levels were according to chest girth. From the third level, body height was used for splitting. However, only the four nodes generated at the second level were selected to represent the four figure types and thus to reduce the number of figure types. Figure 1 plots a distribution graph of chest girth as the X-axis against waist girth on the Y-axis to demonstrate the distribution of all figure types. Waist girth is also an important variable for sizing male garments in many countries and it significantly correlates with the girth factor. This study identifies the figure type of 115 people with smaller chest girth and waist girth as Small; that of 286 samples as Medium; that of the 68 samples with larger chest girth and waist girth, as Extra Large, and that of the remaining 133 samples, as Large. Table 2 presents these results. Table 2. Definitions of four figure types Node Figure Classified rule type Node 3 S Chest girth 82.5 cm
Number 115
Node 4
M
82.5 cm Chest girth 88.5 cm
286
Node 5
L
88.5 cm Chest girth 94.5 cm
133
Node 6
XL
3.4
94.5 cm girth
Chest
68
Fourth step of data mining: discussion and application of results 180 160
( c m
)
140 120
Va l u e s
100 80 60 40 20 C hest H ip C hh S est go g i C u i r er l t rd w h t ver i A hd r cal t m h w id h lt ei en hgh th t Wai N st eck B ack B gB ack io g ri d tr w y ht w ih d ai ei t st hght l engt h
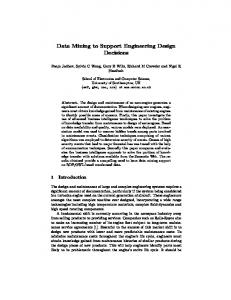
A line graph was plotted to yield a better insight into the differences among the four figure types classified by CART. The average anthropometric variable values was drawn for the four figure types. As shown in Figure 2, the four figure types exhibit by clear differences in chest girth, waist girth and hip girth. The four figure types also follow the order XL>L>M>S. The ANOVA results and Duncan’s multiple range tests also indicated the significant differences among the four figure types.
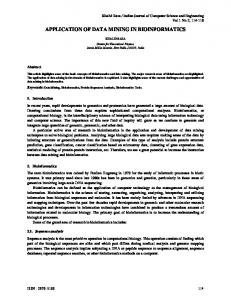
3.5 Establishing the sizing systems Once the four figure types were classified by CART, this section shows the relevant scatter plots of chest girth on the X-axis against waist girth on the Y-axis and the interval was 4 cm. The chest girth are set as follows. z 78 cm and 82 cm for the S figure; z 86 cm for the M figure; z 90 cm and 94 cm for the L figure; z 98 cm and 102 cm for the XL figure. The four figure types are discussed separately, to establish respective sizing systems according to the methods of Emanuel. Figure 3 presents a scatter plot for the S figure of waist girth on the Y-axis against chest girth on the X-axis; the range of chest girth was from 74 cm to 82 cm. Most countries use 4 cm as the interval of chest girth [21]; so the chest girth of 78 cm and 82 cm were used for the S figure. Figure 3 shows a scatter plot of 115 samples of the S figure. The scatter plots of the other types of figures are similar to that of the S figure type. Sum 3 78 77 76 75 74 73 72 71 70 Waist girth 69 (cm) 68 67 66 65 64 63 62 61
5 1
1 1 1
8
6
1
13 16 25 36 115 1 1 1 1 1 1 1 1 1 5 2 3 2 1 3 6 12 5 3 1 2 2 3 4 11
14 12 6 20 2 1 5 6 1 1 8 2 2 1 8 1 1 2 1 2 1 1 1 75 76 77 78 79 80 81 82 Sum Chest girth (cm) 1
74
Figure 2. Four figure types and corresponding anthropometric variables
3
Figure 3. Scatter plot for S-figure
1 1 1 1
1 2
1 1 1 2 1 1 2
1 1 6 1 1 1 1
1 3
10 3 2 2 2
59
Proceedings of the 11th WSEAS International Conference on COMPUTERS, Agios Nikolaos, Crete Island, Greece, July 26-28, 2007
Table 3 presents complete sizing systems for all four figure types. Among all of the 602 samples, only 24 samples were excluded. Therefore, the coverage of the proposed “chest girth and waist girth” sizing systems was 96%. When three sizing variables - chest girth, waist girth and body height - are taken into account, the total coverage of the military garment-sizing systems is 89%. The army soldiers’ garment-sizing systems that use three variables of chest girth, waist girth and body height can be established as shown in Table 3. Table 3. Garment-sizing systems for army soldiers with four types of figures Body measurements in cm Figure type
S
M
L
XL
1.2 1.9 0.5 4.9 6.1 3.8 0.5 4.9 15.3 9.5 2.1 2.6 7.9 4.9 0.5 2.3 3.5 2.1 0.9 3.1 5.4 3.5 1.6 0.5 0.7 2.3 2.1 1.7 0.7 0.9 0.5 0.9 0.7
(1) High coverage rates and few sizing groups As stated above, the coverage of the sizing systems that use the two sizing variables (chest girth and waist girth) is 96%. If body height is added to each figure type, the total coverage rate is still 89%. The obtained sizing systems include 53 groups, fewer than those in many other countries, such as 60 in Germany; 72 in Japan; 102 in Finland; 202 in England and 307 in France (Jongsuk and Jasper, 1993). (2) Regular patterns and rules
Body height in cm
Short Tall Chest girth Waist girth (162 -169) (170 -178) 174 78 64 68 166 174 72 174 166 174 82 66 70 166 174 74 166 174 78 174 166 174 86 68 72 166 174 76 166 174 80 166 174 166 174 88 70 74 166 174 78 166 174 82 174 166 174 90 72 76 166 174 80 166 174 84 166 166 174 94 74 78 166 174 82 166 174 86 166 174 90 174 174 98 76 80 174 84 166 174 88 166 174 92 174 174 102 78 82 174 90 174 94 174
The newly developed sizing systems exhibit the following three characteristics.
Drop 14
16
18
18
18
20
22
24
3.6 Evaluating the sizing systems As described above, four figure types are obtained by using the classification rules based on the decision tree technique of data mining.
The sizing systems, like sizing systems in other countries, have regular patterns and rules. They use 4 cm as the interval for both chest girth and waist girth: the chest girth is 78 cm and 82 cm for the S figure; 86 cm for the M figure; 90 cm and 94 cm for the L figure and 98 cm and 102 cm for the XL figure. Another size of 88 cm was added because most people have M figure type. The first corresponding waist girth for each figure type is presented in order, they are 64 cm and 66 cm for the S figure; 68 cm and 70 cm for the M figure; 72 cm and 74 cm for the L figure and 76 cm and 78 cm for the XL figure type. The regularity for waist girth classification is also obvious. (3) Providing manufacturers with references to facilitate manufacturing The newly developed sizing systems fit very well with the practice of garment making. Table 3 can serve as a reference for production planning. The obtained sizing systems use ISO labeling method. For example, 82LT means that the waist girth is 82 cm, the figure type is L, and the body height is “tall” (174 cm). Table 3 shows that the corresponding chest girth is 94 cm. Thus, the details of the body dimensions of soldiers can be obtained using easy-to-understand sizing systems. Manufacturers, basing their judgments on the sizing systems, can make different type of garments with various quantities.
4 Conclusions This study applies decision tree-based data mining to develop sizing systems for army soldiers in Taiwan. The obtained systems exhibit the following merits. z The sizing systems based on the decision
60
Proceedings of the 11th WSEAS International Conference on COMPUTERS, Agios Nikolaos, Crete Island, Greece, July 26-28, 2007
tree show regular patterns and rules. The total coverage of the sizing systems is 89%, which is relatively high. z The number of the size groups is only 53, fewer than that of in many other countries. The obtained systems for sizing soldiers’ uniforms can be used as a communication tool among garment manufacturers, and the military logistic management offices. The newly developed sizing systems for sizing army soldiers’ uniforms can correctly predict the requirements of different sizes of uniforms, and thus to generate a realistic production plan. Unnecessary inventory costs due to sizing mismatches between the number of soldiers and the produced garments can be minimized. z
References: [1]. Chang, C. F., " The model analysis of female body size measurement from 18 to 22 ", Journal of Hwa Gang Textile, 6, 1999, pp. 86-94. [2]. Tung, Y. M. and Soong, S. S., "The demand side analysis for Taiwan domestic apparel market", Journal of the China Textile Institute, 4, 1994, pp. 375-380. [3]. Hsu, K. M. and Jing, S. H., "The chances of Taiwan apparel industry", Journal of the China Textile Institute, 9, 1999, pp. 1-6. [4]. Emanuel, I., "A height-weight sizing system for fight clothing", WADC Technical Report, Aero Medical Laboratory, Ohio, U.S.A., 1959, pp. 56-365. [5]. Jongsuk, C. Y. and Jasper, C. R., "Garment-sizing systems: an international comparison", International Journal of Clothing Science and Technology, 5, 1993, pp. 28-37. [6]. Ashdown, S. P., "An investigation of the structure of sizing systems", International Journal of Clothing Science and Technology, 10, 1998, pp. 324-341. [7]. McCulloch, C. E., Paal, B. and Ashdown, S.A., "An optimal approach to apparel sizing", Journal of the Operational Research Society, 49, 1998, pp. 492-499. [8]. Fayyad, U. and Stolorz, P., "Data mining and KDD: promise and challenges", Future Generation Computer System, 13, 1997, pp. 99-115. [9]. Berry, M. and Linoff, G., Mastering Data Mining, The Art and Science of Customer Relationship Management, Wiley, New
York. 2000. [10]. Feng, C. X. and Wang, X., "Development of empirical models for surface roughness prediction in finish turning", International Journal of Advanced Manufacturing Technology, 20, 2002, pp. 348-356. [11]. Koonce, D. A. and Tsai, S. C., "Using Data mining to find patterns in genetic algorithm solutions to a job shop schedule", Computer and Industrial Engineering, 38, 2000, pp. 361-374. [12]. Maddour, M. and Elloumi, M., "A data mining approach based on machine learning techniques to classify biological sequences", Knowledge-Based Systems, 15, 2002, pp. 217-223. [13]. Chas, Y. M., Ho, S. H., Cho, K. W., Lee, D. H. and Ji, S. H., "Data mining approach to policy analysis in a health insurance domain", International Journal Medical Informatics, 62, 2001, pp. 103-111. [14]. Gerritsen, R., "Assessing loan risks: a data mining case study", IT Professional, 1, 1999, pp. 16-1. [15]. Becerra-Fernandez, I., Zanakis, S. H. and Walczak, S., "Knowledge discovery techniques for predicting country investment risk", Computer and Industrial Engineering, 43, 2002, pp. 787-800. [16]. Apte, C. and Weiss, S., "Data mining with decision trees and decision rules", Future Generation Computer System, 13, 1997, pp. 197-210. [17]. Breiman, L., Friedman, J. H. and Olshen, R. A., Classification and Regression Tree, Chapman and Hall, Florida. 1998. [18]. Berry, M. and Linoff, G., Data Mining Techniques: for Marketing, Sales, and Customer Support, Wiley, New York. 1997. [19]. Moisen, G. G. and Frescino, T. S., "Comparing five modeling techniques for predicting forest characteristics", Ecological Modelling, 157, 2002, pp. 209-225. [20]. Chen, S.Y., Multivariate analysis, Hwa-Tai, Taipei. 2000. [21]. Winks, J. M., Clothing Sizes: International Standardization, Redwood, U.K. 1997,
61