Ope
Sciences
Science & Research
Open Access
Open Access Proceedings
Drinking Water
Engineering An application of ensemble/multi model approach for wind power production forecasting and Science 1
RSE, Ricerca Sistema Energetico, Milano, Italy 2 ECMWF, Reading, UK
Open Access
S. Alessandrini1 , P. Pinson2 , R. Hagedorn2 , G. Decimi1 , and S. Sperati1
Earth System
Science
Data
Received: 27 December 2010 – Revised: 18 February 2011 – Accepted: 21 February 2011 – Published: 28 February 2011
Abstract. The wind power forecasts of the 3 days ahead period are becoming always more useful and im-
portant in reducing the problem of grid integration and energy price trading due to the increasing wind power penetration. Therefore it’s clear that the accuracy of this forecast is one of the most important requirements for a successful application. The wind power forecast applied in this study is based on meteorological models that provide the 3 days ahead wind data. A Model Output Statistic correction is then performed to reduce systematic error caused, for instance, by a wrong representation of surface roughness or topography in the meteorological models. For this purpose a training of a Neural Network (NN) to link directly the forecasted meteorological data and the power data has been performed. One wind farm has been examined located in a mountain area in the south of Italy (Sicily). First we compare the performances of a prediction based on meteorological data coming from a single model with those obtained by the combination of models (RAMS, ECMWF deterministic, LAMI). It is shown that the multi models approach reduces the day-ahead normalized RMSE forecast error (normalized by nominal power) of at least 1% compared to the singles models approach. Finally we have focused on the possibility of using the ensemble model system (EPS by ECMWF) to estimate the hourly, three days ahead, power forecast accuracy. Contingency diagram between RMSE of the deterministic power forecast and the ensemble members spread of wind forecast have been produced. From this first analysis it seems that ensemble spread could be used as an indicator of the forecast’s accuracy at least for the first three days ahead period.
1
Introduction
The accuracy of short-term wind power forecasts is very important to facilitate the integration of wind power into the grid. Especially in area such the south part of Italy where a strong wind power production is associated with a poor development of the grid, not originally built to support such a kind of distributed input. Also in the day ahead market more accurate forecasts may increase the value of wind energy compared to that of more conventional sources. In this contest can become important an information about the prediction accuracy associated with a deterministic power forecast. In this work a multi model approach to improve the accuracy of deterministic forecast has been applied to a wind farm. Furthermore, considering that the more common wind power forecast systems for the three days ahead period are Correspondence to: S. Alessandrini (
[email protected]) Published by Copernicus Publications.
based on meteorological models and that a big part of systematic errors are removed by MOS (Model Output Statistics) techniques, it makes sense that the forecast error is related to the atmospheric predictability condition. In this work we report about usage of the member-spread of the ECMWF ensemble model system for prediction of deterministic forecasts accuracy.
2
Site and wind data description
The wind farm called Valledolmo is located in Sicily in a mountain area of the south Italy, with 9 equal turbines for a total 7.65 Mw of nominal power. Time series power data for the singles turbines are available for the year 2008 together with wind data measured at a height of 50 m a.g.l. (the same as the hubs) by an anemometer located inside the wind park. To increase the number of valid power data an average value over the working turbines has been computed for each hour and then considered for the following application.
10th EMS Annual Meeting and 8th European Conference on Applied Climatology (ECAC) 2010
Advances in
Adv. Sci. Res., 6, 35–37, 2011 www.adv-sci-res.net/6/35/2011/ doi:10.5194/asr-6-35-2011 © Author(s) 2011. CC Attribution 3.0 License.
Best model Multimodel
36
Index RMSE Correlation Bias RMSE Index Correlation RMSE Bias Correlation Bias RMSE Correlation Bias
Day 1 14.2% 0.76 -0.02 13.7% Day 1 0.77 14.2% -0.001 0.76 -0.02 13.7% 0.77 -0.001
Day 2 15.1% 0.72 -0.02 14.6% Day 2 0.73 15.1% -0.001 0.72 -0.02 14.6% 0.73 -0.001
Day 3 15.6% 0.69 -0.004 15.0% Day 3 0.71 15.6% -0.001 0.69 -0.004 15.0% 0.71 -0.001
Best modelapproach for wind power production forecasting S. Alessandrini et al.: An application of ensemble/multi model
1
Multimodel
Table 1. Statistical indexes for hourly power forecast evaluation
computed using measured data in Valledolmo wind farm. RMSE and BIAS are normalized by the nominal power (NP).
Best model
Multimodel
Index
Day 1
Day 2
Day 3
RMSE Correlation Bias
14.2% 0.76 −0.02
15.1% 0.72 −0.02
15.6% 0.69 −0.004
RMSE Correlation Bias
13.7% 0.77 −0.001
1
2 3 42 53
14.6% 0.73 −0.001
15.0% 0.71 −0.001
4 5
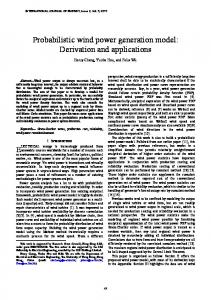
Figure 1 Rank histogram of ensemble wind forecast before (left) and after (right) the
Figure 1. Rank histogram of ensemble wind forecast before (left)
recalibration procedure. The frequency of measurements occurrences (Y axis) between the 51
and after (right) the recalibration procedure. The frequency of meamembers (X axis) of is reported. Figure 1 intervals Rank histogram ensemble wind forecast before (left) and after (right) the surements occurrences (Y-axis) between the 51 members intervals recalibration procedure. The frequency of measurements occurrences (Y axis) between the 51 (X-axis)DAY is reported. DAY 2 DAY 3 1 members intervals (X axis) is reported.
DAY 1
DAY 2
DAY 3
3 The wind power forecast system
The wind power forecast system is built by a meteorological model that provides hourly wind forecast for the three days ahead period. The wind field is then adjusted, in order to reduce systematic errors, by a MOS performed using a Neural Network (NN). Historical time series of measured power or wind data and forecasted wind data are used to train the NN. In this study three meteorological models have been used: RAMS (4 km resolution) (Pielke et al., 1992), LAMI (7 km resolution, http://www.arpa.emr.it/ SMR/archivio/downloads/ambiente/report lm verif fv.pdf), and ECMWF (25 km) deterministic forecast model. Both RAMS and LAMI use the ECMWF deterministic forecast fields as boundary conditions. 4
The multi-model application
Three independent hourly power forecasts have been performed using the three meteorological models (above mentioned) for the Valledolmo wind farm. The first 6 months have been used as a training period for three independent NN that link directly the forecasted wind with the power data. The three independent power forecasts are then regressed towards the measured power data during the training period, defining the coefficient of the linear combination to be used during the test period for the multi-model prediction. In Table 1 some statistical indexes comparing the best (between the three used) models performances with the multi model are reported. The multi-model outperforms the best model gaining 1–2% of RMSE/NP, i.e. it gains quite one day of predictability. It is also interesting to underline that, comparing the three separate power forecasts (not shown in this paper), an increase in resolution doesn’t necessary assures better performances. An explanation is that, for this wind farm, the synoptic winds are more often involved in power production rather than local thermal winds, for instance. The large scale circulation is well forecasted even with a horizontal resolution of 25 km and the attempt of forecasting smaller scales flows can be seen sometimes as a “noise” signal that decreases the NN efficacy. Adv. Sci. Res., 6, 35–37, 2011
6 7
Figure 2 ECMWF deterministic power forecast error (RMSE/NP) vs ensemble power spread
86 97
computed as a daily average for three lead times. The lines are plotted on the median. The red Figure 2 ECMWF deterministic power numbers indicate the points inside eachforecast square error (RMSE/NP) vs ensemble power spread
8
computed2. as aECMWF daily averagedeterministic for three lead times. The lines are plotted on the median. The red Figure power forecast error (RMSE/NP)
9
numbers indicate the points spread inside eachcomputed square vs ensemble power as a daily average for three lead times. The lines are plotted on the median. The red numbers indicate the points inside each square.
5
The ensemble model application
The operational initial perturbations of the ECMWF EPS are constructed using singular vectors with maximum to-5 tal energy growth. The 51 ensemble wind forecasts of the ECMWF ensemble model system are processed by a MOS trained on the control run during the training period. Ensemble forecasts of wind speed are probabilistically recalibrated. The method employed consists of: (i) taking the log-transform of wind speed forecasts so that they are closer to Gaussian; (ii) adaptively correcting the mean and variance of the transformed wind speed forecasts; and (iii) transform them back by using the inverse of the log-transform. A generalization of this method is described by Pinson (2011) for the case of ensemble forecasts of (u, v)-winds. In Fig. 1 the rank histogram before the recalibration shows an overconfident model (the measurements fall quite always outside the members spread therefore the first and the last intervals are the most populated) that is improved by the recalibration procedure, obtaining a more uniform distribution among the 51 intervals. The recalibrated wind data are used to compute an ensemble power prediction using the nominal power curve of the turbine. In Fig. 2 some plots similar to those proposed by Von Bremen (2007) are shown. The daily RMSE/NP of ECMWF deterministic forecast are plotted against the power spreads. The diagonal cases are more populated than the offdiagonal cases therefore we can say that low spread of the ensemble is more often related to low forecast errors (lower left quadrant) than to large forecast errors (upper left quadrant). www.adv-sci-res.net/6/35/2011/
5
S. Alessandrini et al.: An application of ensemble/multi model approach for wind power production forecasting 6
37
References
Conclusions
In this application the use of a multi model approach produces a more accurate deterministic power forecast. At the same time it seems that ensemble power spread could be used as an indicator of the forecast’s accuracy at least for the first three days ahead period. Acknowledgements. This work has been financed by the
Research Fund for the Italian Electrical System under the Contract Agreement between RSE (formerly known as ERSE) and the Ministry of Economic Development – General Directorate for Nuclear Energy, Renewable Energy and Energy Efficiency stipulated on 29 July 2009 in compliance with the Decree of 19 March 2009. This work was partly funded by the EU project SafeWind (EU-FP7, Grant Agreement No. 213740).
Von Bremen, L.: Combination of deterministic and probabilistic meteorological models to enhance wind farm forecast, J. Phys. Conf. Ser., 75, 1–8, 2007. Pielke, R. A., Cotton, W. R., Walko, R. L., Tremback, C. J., Lyons, W. A., Grasso, L. D., Nicholls, M. E., Moran, M. D., Wesley, D. A., Lee, T. J., and Copeland, J. H.: A Comprehensive Meteorological Modeling System – RAMS, Meteorol. Atmos. Phys., 49, 69–91, 1992. Pinson, P.: Adaptive recalibration of ensemble forecasts of (u,v)winds, Technical report, ECMWF, 2011.
Edited by: S.-E. Gryning Reviewed by: H.-T. Mengelkamp and another anonymous referee The publication of this article is sponsored by the Swiss Academy of Sciences.
www.adv-sci-res.net/6/35/2011/
Adv. Sci. Res., 6, 35–37, 2011