An Approach for Enhanced Slice Visualization utilizing Augmented Reality: Algorithm and Applications Zein Salah1,2 , Bernhard Preim1 , Georg Rose2 1 2
Department of Simulation and Graphics, University of Magdeburg
Department of Healthcare Telematics and Medical Engineering, University of Magdeburg E-mail:
[email protected]
Abstract With the introduction of medical scanners, the demand for efficient visualization of scanned data increases. Such visualization is of great importance in many medical applications. In this paper, we first introduce an optimized algorithm for extracting arbitrarily-oriented cross sectional slices from volumetric datasets, which obviously allows for an enhanced view compared to the traditional axis-oriented slice display. This algorithm is then integrated into an augmented reality system that provides enhanced visualization functionalities for the user. Finally, we present a potential application of this system in image-guided surgery by superimposing information, extracted from pre- and intraoperatively scanned patient data, with the optical image. Keywords: Medical Visualization, Volumetric Data, Augmented Reality, Image-Guided Surgery
1
Introduction
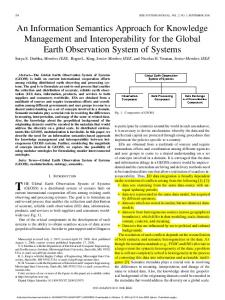
Medical data scanners (CT, MRI, etc.) usually deliver a stack of 2D images, called slices (see left side of Figure 1), which in turn is viewed as a 3D array of volumetric data elements (voxels). The demand for efficient visualization of scanned data increases over the years and is of great importance in such medical applications as diagnosis, preoperative planning, education, forensic medicine, and many others. For the visualization of volumetric datasets, there are three different method categories [9]: decompositing the dataset into points, slices, or other elements, and visualizing the individual elements, extracting isosurfaces of targeted elements and rendering the surfaces, known as indirect volume rendering, and direct semitransparent visualization of the dataset, known as direct volume rendering. Slicing is probably part of almost every computer-based medical imaging application. There are different modes for
Figure 1 Cross section computation: tomographical slices are computed at arbitrary positions and orientations. slice visualization, and medical applications usually provide options to chose between some of them. These slicing modes are axis-oriented and rely on merely fixing one of the (z, y, or x) coordinates and displaying the corresponding axial, coronal, or sagittal view. In this paper, we present an algorithm, called Cross Sectioner, for computing tomographical slices at arbitrary orientations, as Figure 1 shows. The advantage is obviously a more flexible visualization. For example, it becomes more intuitive to trace the elongation of a blood vessel or determine the shape of an anatomical structure. We then combine the Cross Sectioner into an augmented reality system that allows to flexibly browse a volumetric dataset, displaying the underlying tomography at interactively-selected positions and orientations. If the dataset is registered with the corresponding real patient , it becomes even possible to display the tomographical slices in correspondence with the patient body, which allows for direct visual inspection and localization of internal anatomy1 . Afterwards, we present a potential application for the 1 Registration is actually out of the scope of this paper and therefore not discussed here.
augmented reality based visualization system. In essence, the patient/dataset as well as other tools (e.g. pointers) are optically tracked with a camera and cross sections are computed and visualized in correspondence with the tracked pointer. In an image-guided surgery, this system will serve as a core for augmenting information, extracted from preand intra-operatively scanned patient data, with the optical image. The advantage is a better localization of targeted lesions (e.g. tumor) and the protection of hidden risk structures like blood vessels and neural connections. To provide a more enhanced visualization, interactively selected tomographical slices can be computed on the fly and blended in the real scene with correct position and orientation. The remainder of this paper is organized as follows: Section 2 provides an overview of related work. The whole approach is discussed in Section 3. Section 4 presents representative results and the paper is concluded in Section 5.
2
Related Work
As mentioned in the previous section, axis-oriented slicing is very common in medical applications. A tabular form, like in [3], is the simplest and probably most popular fashion with which radiologists are familiar. Slice viewers with single or multiple widgets are also commonly utilized, where sliders are used to move through volume slices. These viewers are useful for such applications as selecting seed points, visual evaluation of a segmentation approach, or interactively defining a region of interest within a volume [8]. On the other side, image-guided procedures also receive a continuously increasing attention. In essence, image guidance helps physicians to establish a correspondence between locations in a patient dataset and the patient’s physical body [7]. This is of great importance for surgeries that necessitates a high degree of precision, like neurosurgery. For example, in a brain surgery, it is highly important to avoid injury of critical risk structures. Therefore, surgical microscopes, in addition to medical navigation, are usually used to support the safety and accuracy of such interventions [2, 13]. By incorporating augmented reality (AR), it becomes possible to view patient data directly in the 3D context of the patient himself. This may provide an in-place insight into the patient body, which, for example, would help defining the entry point and the trajectory of a biopsy needle [12]. Other systems utilized augmented reality for imageenhanced endoscopy [6, 10]. A system for combining optical and virtual endoscopy was also introduced in [4]. Birkfellner et al. [1] presented a basic design of a head-mounted operating binocular that is equipped with projection optics to allow for data augmentation.
3
Methods
The subsequent sections describe the different components of our approach. The cross sectioning algorithm is first introduced and then its integration into the augmented reality system is presented. The last subsection briefly demonstrates a potential application of the AR-based system.
3.1
Cross Sectioning Algorithm
The first component of the system is an algorithm (Cross Sectioner) for computing tomographical slices from 3D CT/MRI datasets. The inputs of the Cross Sectioner algorithm are a 3D dataset and the parameters of the desired cross section (center, orientation, width, height, and sampling rate or spacing), and the output is the computed 2D cross section. The first algorithm implementation computes (given the abovely mentioned parameters) a 4x4 homogeneous transformation matrix Tcs , which converts from the coordinate system of the cross section to that of the volume. This matrix is derived similar to the computation of the 3D viewing matrix presented in [5]; translate the center of the cross section to the origin of the volume coordinate system, and then rotate the cross section to align its axes with those of the volume. The first step is performed by a standard translation matrix T , and the rotation is performed by the rotation matrix R whose unit row vectors (Rx , Ry , and Rz ) are given by: N kN k
(1)
U × Rz kU × Rz k
(2)
Rz = Rx =
Ry = Rz × Rx
(3)
where N is the normal to the cross section (i.e. its orientation), and U is a chosen up-direction. The previously derived transformation converts 3D positions in the volume space to the corresponding coordinates in the cross section space. The cross section transform is actually intended to do the inverse, so we finally define Tcs as: Tcs = (R.T )−1
(4)
Tcs is applied to every pixel position Index2D in the cross section coordinates, generating a continuous 3D position ContIndex3D , i.e. ContIndex3D = Tcs ∗ Index2D
(5)
The intensity at ContIndex3D is finally computed using tri-linear interpolation. Equation 4 implies 16 floating point
multiplications at every pixel position in the cross section space, which is clearly a computation bottleneck. Fortunately, if we apply only the necessary multiplications within the rotation Matrix R and perform the translation T as an addition, only six multiplications are needed and the computation is considerably accelerated. Alternatively, we propose an incremental approach in which we use ContIndex3D as an iteration counter and compute its value only at the lower-left pixel in the cross section plane. We also predefine two increment 3D vectors: IncX , which moves the counter a one-pixel step to the right2 , i.e. IncX = Rx ∗ Spacingx , and IncY which moves the iteration counter to the left-most pixel in the next row, i.e. IncY = −W idth ∗ IncX + Ry ∗ Spacingy , where Spacingx and Spacingy are the pixel distances of the cross section in the x- and y-directions, respectively. Utilizing this incremental approach, looping through the cross section pixels is achieved using vector addition while floating point multiplications are avoided, which clearly accelerates the computation process, as will be shown in Section 4.
3.2
AR-Assisted Slicer
The AR-assisted visualization system (ARVS) allows for the inspection of a tracked 3D dataset by virtually browsing it using a tracked pointer. For our system, we use an offthe-shelf web camera, which corresponds to a microscope or endoscope in an AR-assisted navigated surgery. A main challenge in the ARVS is the precise computation of the viewpoint of the camera, in order to exactly align virtual objects with real world images. We utilize the ARToolkit3 for this purpose. ARToolkit searches for predefined markers in an image and, using computer vision algorithms, computes the 3D positions and orientations (pose) of the found markers. The ARVS works as follows: A video stream is captured with the camera and displayed in the widget (right side in Figure 2). Two trackable markers are used. The pose information of the first marker is used to align the dataset (the face and bounding box in Figure 2). The pose of the second marker, which is used as pointer, is given as input into the Cross Sectioner algorithm (Section 3.1) and the corresponding cross section is generated. This tomographical slice is then used as texture for a rectangle, which is in turn rendered in the real scene with correct position and orientation. Here, the camera image serves as a background. Thereby, the spatial resolution (dimension and spacing) of the dataset and the cross section must be considered in order to ex-
Figure 2 ARVS: Rendering of the face, bounding box of a CT dataset, and a computed cross section, blended into the video stream.
actly reflect the spatial proportion with the 3D environment, whose coordinate system is represented in millimeter. From an implementation point of view, the ARVS is incomparably simpler than the system presented in [11]. Nevertheless, it is more intuitive and can practicably be used to align tomographical slices directly with the corresponding patient.
3.3
Potential Application in AR-Assisted Surgery
In this section, we present a potential application of the approach for improving visualization functionality in a surgery operation. For our simulated scenario, we rely on real patient/operation data. In essence, we segment a brain tumor from a preoperatively scanned MRI dataset, as shown in Figure 3. To construct our virtual patient, we extract the outer skin from an intraoperative MRI and construct a 3D surface model; the field of operation is textured with pictures that were captured during the real surgery. The patient model is inherently registered with the scanned dataset, which in turn is tracked by the camera. At each frame, the patient model is blended into the real image and the depth buffer is cleared, which results in having the patient rendering as part of the real image. At this step, the new rendering simulates a frame captured during a real intervention. Additional object models segmented from MRI datasets, as well as interactively selected cross sections can be superimposed on the real image with exact position and orientation, as will be demonstrated in Section 4.
4
Results
2 Conceptually,
”right” means in the cross section plane, but the movement practically results in the new 3D position in the coordinate system of the volumetric data. 3 http://www.hitl.washington.edu/artoolkit/
The slicing algorithm and the visualization tool were implemented using Visual C++. Rendering was implemented
Table 1
Representative computation time measurements for the Cross Sectioner algorithm
Dataset DS 01 DS 02 DS 03
a
Size (voxels) 228x251x84 512x512x116 512x512x88
Computation time (in ms) Matrix Mul. Only needed mult. Inc. Method 31 12 12 147 55 41 136 44 33
b
Figure 3 Preoperative planning of a brain tumor removal surgery: (a) segmentation of the tumor (green), (b) 3D reconstruction of the tumor and the head.
with OpenGL4 . A module was implemented, using FLTK5 for the user interface, to test the slicing algorithm, a snapshot is shown in Figure 4). Table 1 shows representative computation time measurements for the Cross Sectioner algorithm. The measurement were taken for computing and rendering cross sections of 512x512 pixels from volumetric datasets with 512x512 pixel axial slice size (which is a typical size of medical datasets). When direct matrix multiplication is applied, the computation runs in about 7 frames/second (fps), as the first timing column illustrates. If only needed multiplications are performed, the computation is considerably accelerated, as can be seen in the second timing columns. Using the optimized implementation, the computation and rendering rate was accelerated to about 30 fps. In our current implementation, we use marker-based tracking utilizing the ARToolkit, where multiple marker tracking is achieved in real time. Figure 2 shows a snapshot of the ARVS, which allows for intuitively inspecting 3D datasets by rendering arbitrarily located and oriented tomographical slices that are interactively selected using a tracked marker. Examples of such cross sections are demonstrated in Figure 5. Afterward, we adapt this mod4 http://www.opengl.org/ 5 www.fltk.org
Figure 4 Snapshot of the Cross Sectioner algorithm testing module.
ule to demonstrate the improved visualization functionality in an operation scenario. Figure 6a shows an augmented view of the field of operation, in which a model of the tumor to be removed is overlaid (green). This overlaid view enables the surgeon to better localize the tumor and more precisely define its boundaries. In Figure 6b, the cross section located 11 mm deeper to the outer surface and orthogonally to the view direction is computed and blended. Such an augmentation provides the surgeon with an in-depth view of the operation field. In other words, hidden anatomical structures can be inspected and evaluated in alignment with the real patient. This helps the surgeon to preserve risk structures like blood vessels, neural connections, or certain functional units.
5
Conclusions
In this paper, we have presented an optimized algorithm for computing and rendering arbitrarily oriented tomographical slices from volumetric datasets, which provides advantageous visualization quality compared to axisoriented slicing. The cross sectioning algorithm has been integrated in an AR-based visualization system that allows
Figure 5 Interactively selected tomographical slices, visualized with the ARVS. for intuitive browsing and inspection of scanned patient data. The system has then been adapted for use in a simulated operation scenario by augmenting information, extracted from scanned patient data, with optical images. This results in a better localization of targeted lesions and the preservation of hidden risk anatomical structures. We already received positive feedback regarding the usability of the system from our medical partners. In a real operation scenario, the surgical microscope will replace the camera. In addition, we will rely on an infrared tracking system. Although the system was initially designed for neurosurgery application (mainly brain surgery), the concept applies to several other surgeries and endoscopic procedures.
Acknowledgment a .
This work is funded by the German Ministry of Education and Science (BMBF) within the ViERforES project (no. 01IM08003C).
References [1] W. Birkfellner, M. Figl, K. Huber, F. Watzinger, F. Wanschitz, J. Hummel, R. Hanel, W. Greimel, P. Homolka, R. Ewers, and H. Bergmann. A HeadMounted Operating Binocular for Augmented Reality Visualization in Medicine-Design and Initial Evaluation. IEEE Transactions on Medical Imaging, 21(8):991–997, 2002.
b Figure 6 (a) Augmented view of the tumor (green), (b) a cross section from the MRI dataset (depth: 11 mm), blended over the optical image.
[2] T. Brinker, G. Arango, J. Kaminsky, A. Samii, U. Thorns, P. Vorkapic, and M. Samii. An Experimental Approach to Image Guided Skull Base Surgery Employing a Microscope-Based Neuronavigation System. Acta Neurochirurgica, 140(9):883– 889, 1998. [3] J. Fischer, D. Bartz, A. del R´ıo, Z. Salah, J. Orman, D. Freudenstein, J. Hoffmann, and W. Straßer.
VIRTUE: Ein System der navigierten virtuellen Endoskopie f¨ur die MKG- und Neurochirurgie (Poster). ¨ In Gemeinsame Jahrestagung der Osterreichischen, Deutschen und Schweizerischen Gesellschaft f¨ur Biomedizinische Technik, 2003. [4] J. Fischer, A. del R´ıo, M. Neff, S. Flossmann, F. Duffner, J. Hoffmann, W. Straßer, and D. Bartz. The ARGUS System: Surgical Mixed Reality based on Image Guided Surgery, Extensions, and Applications. In Proc. of Computer-Aided Surgery around the Head (CAS-H), 2007. [5] J. Foley, A. van Dam, S. Feiner, and J. Hughes. Computer Graphics Principals and Practice, chapter Viewing in 3D, pages 722–731. Adison Wesley, 1996. [6] R. Lapeer, M. Chen, G. Gonzalez, A. Linney, and G. Alusi. Image-Enhanced Surgical Navigation for Endoscopic Sinus Surgery: Evaluating Calibration, Registration and Tracking. The International Journal of Medical Robotics and Computer Assisted Surgery, 4(1):32–452, 2008. [7] T. Peters and K. Cleary. Image-Guided Interventions, Technology and Applications. Springer Science+Bussiness Media, 2008. [8] Z. Salah, M.Kastner, F. Dammann, E. Schwaderer, M. Maassen, D. Bartz, and W. Strasser. Preoperative planning of a complete mastoidectomy: Semiautomatic segmentation and evaluation. International Journal of Computer Assisted Radiology and Surgery, 1(4):213–222, 2006. [9] H. Schumann and W. M¨uller. Visualisierung: Grundlagen und allgemeine Methoden. Springer-Verlag, 20th edition, 2000. [10] R. Shahidi, Michael R Bax, C. Maurer, J. Johnson, E. Wilkinson, B. Wang, J. West, M. Citardi, K. Manwaring, and R. Khadem. Implementation, Calibration and Accuracy Testing of an Image-Enhanced Endoscopy System. IEEE Transactions on Medical Imaging, 21(12):1524–1535, 2002. [11] G. Shukla, B. Wang, J. Galeotti, R. Klatzky, B. Wu, B. Unger, D. Shelton, B. Chapman, and G. Stetten. A Movable Tomographic Display for 3D Medical Image. In Proc. of AMI-ARCS, 2009. [12] F. Wacker, S. Vogt, A. Khamene, J. Jesberger, S. Nour, D. Elgort, F. Sauer, J. Duerk, and J. Lewin. An Augmented Reality System for MR Image-guided Needle Biopsy: Initial Results in a Swine Model. Radiology, 238(2):497–504, 2006.
[13] G. Zheng, M. Caversaccio, R. Bchler, F. Langlotz, L. Nolte, and R. Husler. Frameless Optical ComputerAided Tracking of a Microscope for Otorhinology and Skull Base Surgery. Archives of Otolaryngology Head and Neck Surgery, 127(10):1233–1238, 2001.