An Architecture for Controlling Service Demand in ATM Networks based on Pricing Agents Nikolaos Anerousis
Aurel A. Lazar
AT&T Research 600 Mountain Avenue P.O. Box 636 Murray Hill, NJ 07974-0636 tel. (908) 582-5499 e-mail:
[email protected]
Department of Electrical Engineering and Center for Telecommunications Research Columbia University New York, NY 10027 tel. (212) 854-1747 e-mail:
[email protected]
Abstract Pricing can be used by the network manager as a control mechanism to influence the user demand for services, thereby preventing network overloads; it can also be used as a means of increasing network revenue. We introduce the concept of a “pricing agent”, an agent that is installed at the edges of an ATM network and controls the offered load according to a set of objectives. After making some assumptions on the user model for service demand, we introduce an iterative pricing scheme which is employed by these agents to calculate the optimal prices for every Source-Destination pair in the network. The agent senses the user reaction to service prices and drives the users to a point where the network maximizes its revenue while guaranteeing an upper bound for the call blocking probability. This scheme has the characteristics of a game and the final pricing solution is a Nash equilibrium. One of the main advantages of the agent architecture is that the pricing problem can be solved in a completely decentralized manner. Further, cooperation between the agents leads to pricing solutions that are characterized by network-wide optimality.
1. Introduction ATM networks are expected to offer a wide variety of services, ranging from simple unicast connections to Virtual Networks. Broadband services can be constructed using two fundamental building blocks: Virtual Circuits (in point-to-point or point-to-multipoint mode) and Virtual Paths. In our previous work [ANE95, ANE96a] we presented an integrated management and control framework for these services. Its objective was to provide the necessary monitoring and control capabilities to the network manager in order to guarantee Quality of Service both at the cell and the call level. At the call level, our control framework produces a VP distribution policy that bounds certain calllevel performance measures such as the call blocking probability and the call setup time for the VC service. However, the actual termination of the algorithm depends on the network load (the VC service demand). For some ranges of network load, the call blocking probability constraint cannot be satisfied. This motivated us to investigate control structures that can influence the service demand 1
An Architecture for Controlling Service Demand in ATM Networks based on Pricing Agents
(rather than simply trying to adjust the network configuration to absorb it). The control objective is to regulate the service request rate at the boundaries of the network. An uncontrolled network load at the call level can cause congestion within the signalling network and deterioration of the Quality of Service (QOS) observed by the users. One way of achieving this objective is by blocking a portion of the traffic that is offered to the network. This solution, however, is not practical if the network wishes to guarantee a certain level of QOS at the call level, such as the blocking probability for requesting a particular type of service. Alternatively, many researchers have proposed an economic model that can directly control user behavior. According to this model, the network manager as the service provider sets prices for various services. The users (service consumers) observe the prices and formulate their demand, by taking into account their own costs, but ignoring the congestion that they might impose on others. Economists refer to this phenomenon as a “congestion externality”. In the economy, resources can be allocated in a way that is beneficial to the network operator and, at the same time, users with diverse requirements achieve maximal benefit (individual optimality). Economists argue that prices internalize the congestion externality by making users face the costs that they impose on other users. A major argument for the service pricing approach is that prices do not only discourage service demand when congestion is present, but also generate revenue that can be used for capacity expansion [MAC94a]. Pricing mechanisms have been studied in both connectionless and connection oriented networks. An extensive survey can be found in [JOR95]. In most approaches, users are assigned a utility function (also known as the consumer surplus) which they try to maximize. The network sets prices for network resources such as bandwidth and buffer space in order to maximize a utility function. In a cooperative environment, the network would use as a utility function the total network welfare, defined as the sum of all user surpluses minus costs. This approach was taken in [LOW93] and [MUR94]. In both cases, a solution can be obtained through an iterative procedure, where the individual users optimize their demand based on the currently advertised prices, and the network calculates a set of new prices that maximize the welfare function for the current demand. The procedure will eventually converge to a set of optimum prices. [COC93] takes the same welfare maximization approach and shows how the pricing of different priority services in an Internet-like environment can lead users to choose a level of priority for their application that maximizes the total network welfare. [JIA95] assumes that the user utility functions are known. In that case, the network can find the optimal prices by solving a welfare maximization problem. Contract negotiation is performed at three levels: circuit bundle, virtual path and trunk. Each level communicates only with its adjacent levels and maximizes its total benefit as a supplier; simultaneously, it negotiates with lower network levels by setting the right prices; and maximizes its consumer surplus as it negotiates with the higher level by choosing the right demand. In contrast with the previous welfare maximization policies, the network operator can set the prices to (selfishly) maximize its own revenue. One of the first studies of this environment was presented in [PAR92]. [HON95] studies a similar environment where every user k sends packets in the network at rate of λk if his utility function based on the delay he experiences is higher than the network price P. The network discourages or encourages users to transmit packets by raising or lowering the prices. A study of the revenue vs. price curve reveals that there exists a prominent global maximum.
2
Architecture
This paper proposes an economic approach to the service demand control problem. We introduce the notion of a “pricing agent” which is installed at all entry points of the network and implements a pricing policy controlled by a centralized network management system. The pricing agent observes the service demand and possesses “intelligence” that manipulates the prices to achieve a set of control objectives. In our case, these objectives are the service blocking probability and the maximization of revenue from the provided services. This paper is organized as follows: Section 2 describes the network service interfaces and the pricing agent architecture. Section 3 looks further into the pricing optimization problem of a single agent. Finally, Section 4 presents the conclusions and directions for further study.
2. Architecture We assume a network that supports a small number of well defined service classes (e.g., voice, video, data, etc.). Each service class is characterized by a set of QOS parameters (delay, cell loss, etc.). Users select one of the available service (traffic) classes to transmit their data based on the requirements of the application. The methodology of [HYM93] allows us to characterize the capacity of every link multiplexer using the concept of the Schedulable Region and of every VP with the Contract Region (CR). The advantage of these representations is that admission control decisions can be made very much like in a circuit switched network, depending on the number of calls that can be accommodated for each traffic class and the number of calls in progress. We model users as Poisson sources that produce connection requests for traffic class k with rate λk and average duration 1/µk. The ATM network offers the two basic unicast connection services: A Virtual Circuit (VC) connection service, suitable for carrying the data of a single connection, and a Virtual Path (VP) service (the equivalent of a leased line in a telephone network). In this context, VPs are used as a user-to-user service (i.e., they are terminated within or just outside user premises). VPs can carry calls of more than one traffic class, and their capacity is represented by the Contract Region. Users are connected to the network through a network boundary node, referred to as the network Point-of-Presence (POP). Every user submits his request for service to the POP using the UNI signalling standard, and the network accepts or denies the request based on capacity availability and other constraints. VC requests are presented to the POP when a user wishes to establish a connection to a user connected to another POP using the VC service. Users with high traffic for a specific destination POP or a specific user may also request the VP service (otherwise, the VC service would be more cost effective). In this case, a VP is established between the user and the destination POP or between the two users. The user then employs the VP for establishing the connection without making a VC service request to the local POP, thereby significantly reducing the connection setup time. In this case however, the user needs to maintain utilization information about the VP and make the appropriate admission control decisions. Because the VP capacity is a logical quantity (in contrast with leased lines in telephone networks, that are “hard-wired” through the network), the VP user can dynamically renegotiate the VP capacity according to his traffic demands, and thereby operate in the most cost effective manner. This renegotiation occurs at regular time intervals, for example, when the user produces a new estimate of its traffic load. Another important application of VPs is that they can be used to form a Virtual Network (VN). A large corporation with users at different locations (where every location is served by a dif3
An Architecture for Controlling Service Demand in ATM Networks based on Pricing Agents
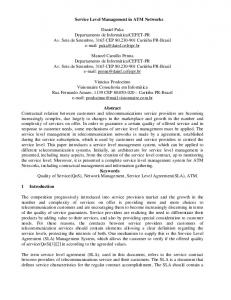
ferent POP) can establish VPs between its users to create a Virtual Network (VN). The dynamic capacity configuration capability of VPs can also be used by the VN operator to renegotiate the capacity of various VN links. When a VC service request is received at the source POP, the network attempts to establish a VC to the destination POP, and terminate it at the appropriate user. How the VC connection is routed through the network is of little importance in this context. Similarly, for a VP request, a VP is established through the network between the two POPs. Different VPs that originate and terminate at the same POPs do not necessarily follow the same route through the network. Figure 1 shows an ATM SD Pair A-B User 1
User 1
VP
User 2
User 2
POP A
B
User n
User m VC
Pricing Agent
ATM Network
D
C
Figure 1: Example of establishing VC and VP Services through the ATM Network
network with 4 POPs. n users are connected at POP A and m users at POP B. User 1 establishes a VP from POP A to user 2 at POP B. User n at POP A establishes a VC to user m at POP B. Notice that connections from A to B do not have to follow the same path through the ATM network. Every POP pair in the network for which service requests are submitted is referred to as a Source-Destination (SD) pair. The network manager assigns a pricing agent to every POP. The agent is responsible for advertising a service price to the users and measuring their demand for the service. The agent charges for the VC service per unit of time. Prices can vary between service classes. The VP service is priced based on the size and shape of its contract region. In principle, VP prices per call are lower than VC prices for the same traffic class. This is very similar to a wholesale versus a retail pricing policy. The network can profit from a large user by selling larger amounts of the service at a more attractive unit price. Prices are determined based on the source and destination of each call. Calls that share the same source and destination observe the same pricing policy.
4
Agent Pricing Optimization
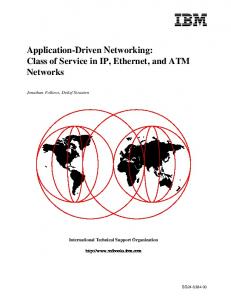
3. Agent Pricing Optimization 3.1 Characterizing user demand The first step in examining this environment is to make some assumptions on user behavior. According to our model, users can select any amount of VC or VP service based on the current prices and their traffic demands. We look at one SD pair only and assume the existence of one traffic class. The VP service is provided at price wx per “circuit” (one circuit corresponds to the networking capacity reserved to handle one call) and unit of time, and the VC service at price wy per circuit and unit of time. Let also λ be the arrival rate that the user wishes to offer to a particular SD pair in the network. The user demand for the VP and VC services is denoted by x and y respectively. Note that x represents the number of calls that can be accepted in the VP while y is the load (arrival rate) offered to the VC service. We further assume that the demand function is a decreasing function of the prices with the demand reaching 0 for some wx and wy. Since all users exhibit this behavior, there exists a set of prices ( w *x, w *y ) with which the pricing agent can achieve the desired service demand. It is worthwhile to note here that the two services (VC and VP) are not orthogonal. In fact, users may select either to carry their traffic. In economic terms, they are better described as “compatible goods”. The requested amount of each service is determined by solving an optimization problem given the current prices and the user service values (the amount that the user is willing to “pay” for the service). Without loss of generality, let us assume that the average call holding time is one time unit. Every user requests a VP with capacity x where x ≥ 0 . Call requests are first offered to the VP. If the VP is full or x=0, the user chooses to either block the call with probability 1-a or attempt to establish it using the VC service with probability a. The procedure is shown in Figure 2. λ
User
VP capacity x overflow traffic 1-a
a VC Service
Block Figure 2: The user model for establishing calls
Given the current prices and rate λ, the user must calculate the x and a such that its utility is maximized. The offered load to the VC service is given by: y = aλ E ( λ, x ) ,
(EQ 1)
where E() is the Erlang blocking formula. If the network provides the VC service for this particular SD pair with blocking probability P, the user throughput is given by: 5
An Architecture for Controlling Service Demand in ATM Networks based on Pricing Agents
γ = λ [ 1 – E ( λ, x ) [ 1 – a ( 1 – P ) ] ] .
(EQ 2)
Now assume that the user values every call that goes through the system at wu, and loses wb for every call that is blocked. The user utility function is given by: U ( x, y ) = γ w u – ( λ – γ )w b – xw x – y ( 1 – P )w y .
(EQ 3)
It can be easily verified that the utility function is concave in x and a, and therefore it exhibits a unique maximum. Since there is no closed expression for the Erlang blocking formula, the maximum can be found using numerical methods, such as the cyclic coordinate method [BAZ79]. 3.2 Pricing optimization Once the users have determined their demands, the agent measures the total demand for each service. The agent then modifies the prices in order to achieve the following objectives: 1) bound the call blocking probability and 2) maximize the revenue. If the agent knows in advance the capacity available for all the users of the particular SD pair, the call blocking probability can be determined by solving the Erlang blocking formula for the given demand. If the capacity is not partitioned on a SDpair basis, the blocking probability can still be computed using the methodology of [ANE96b]. If the blocking probability proves to be higher than desired, the agent can increase the prices by some amount, expecting that the demand will eventually drop to a level where the blocking probability is satisfactory. In order to maximize the revenue, the agent must observe the user behavior as prices change. Sometimes, when the agent raises the prices, the revenue exhibits an increasing trend even if the user demand drops. This happens because users have different service values, and as prices rise, the more cost-conscious users prefer to block their traffic. However, there still are some users that are satisfied with the price or are even willing to pay more for the service. Even if the majority of users have low service values, it is possible to increase the revenue by selling only to the users who wish to spend more. The main difficulty behind this scheme is that the determination of the optimal prices is not straightforward since the agent does not have an expression of the total service demand as a function of the prices. The agent can merely observe the demand as a result of his pricing policy. The optimal prices however can be reached through an iterative procedure where the agent makes small changes to the prices and observes the users reaction. prices wx, wy User 1 Pricing Agent
User 2
User n
total demand x, y Figure 3: User - Agent interaction
This principle is shown in Figure 3. The agent advertises the initial prices, that reflect the basic cost for the services. The users reply with their demands after optimizing their objective functions. The 6
Agent Pricing Optimization
agent measures the total demand, and employs a price adjustment scheme that calculates a new set of prices. The iteration stops when the objectives have been satisfied. A detailed description of this procedure can be found in [ANE96b]. The reader may have already observed that the above procedure has the characteristics of a game, with the agent trying to drive the users to an equilibrium. At equilibrium, users do not wish to alter their demands since these are optimal with respect to the current prices. Similarly, the network by changing the prices will either lose revenue or violate the blocking probability constraint, since the user demand will change. A question can be raised here whether this iterative scheme is realistic for use in a future broadband network. Clearly, a human user would be very frustrated if it had to negotiate a price before being able to use the service. It is possible however that the user assings an agent on his side to participate in the price adjustment process. The user in this case specifies its traffic demand, service values, and perhaps the maximum price he is willing to pay, and lets the agent negotiate the price on his behalf. The agent then decides if and how user traffic should be offered to the network. So far, we have assumed that users advertise their true VC service demand to the network. However, users can also advertise reduced call arrival rates in order to manipulate the prices. In this case, the network underestimates the demand for the VC service, and reduces the prices accordingly. It is possible, however, to enforce a truth-telling policy by actually measuring the total VC service demand for each SD pair (users cannot manipulate the VP service price because they are charged immediately upon their request). The new prices are posted at regular time intervals. When the new prices are announced, users calculate their demands. Requests for the VP service are presented immediately, while for the VC service only upon a call arrival. At the end of the interval, the network has computed the true service demand by measuring the service requests and proceeds to calculate the new prices. This implies that the new prices depend only on the true demand during the previous interval, and therefore, users cannot manipulate them. However, this scheme cannot work if a bidding (negotiation) process is employed to reach the price equilibrium, because in this case, the length of the interval between price computations is zero and prices can be calculated only from the projected user demands. The bidding scheme can be used to reach an equilibrium fast but is rather unrealistic in the telecommunications market. Mackie-Mason [MAC94b] and Kelly [KEL94] have also found that prices based on measures make truth-telling desirable for the users. 3.3 Experimental Results We have constructed an example with a medium-sized user population. We model the arrival rate λ of every user in the population as a random variable. The first 1800 users have arrival rates exponentially distributed with mean Eλ = 1 . The remaining 200 users have arrival rates also exponentially distributed with mean 20. In order to determine the wu and wb for each user, we have used the following arbitrary formulas: min
wu = w y
min
+ q ⋅ wy
λ ------- , Eλ
wu w b = ------ . 2
(EQ 4)
According to (EQ 4), high volume users are willing to pay more for the service. The constant q is 2 for the first population and 3.3 for the second (i.e., the second class of users is willing to pay even 7
An Architecture for Controlling Service Demand in ATM Networks based on Pricing Agents
min
max
more). w y was set at 1.2. There exist a total of x = 3000 circuits that can be shared between the VP and the VC service. The maximum acceptable blocking probability for the VC service is set at P
max
= 0.1 .In addition, let N
U
tot
=
∑ Un
(EQ 5)
n=1
denote the total user utility (or welfare). The network revenue can be calculated from: R ( w x, w y ) = tot
x x
tot
wx + y
max
wx ,
tot
( 1 – P )w y ,
if
x
tot
≤x
max
,
(EQ 6)
otherwise
tot
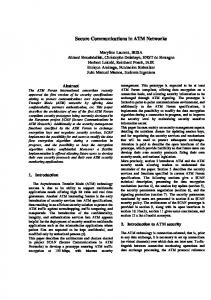
where x and y are the total user demands for the VP and VC services, and P the blocking probability experienced by the VC service. Plots for the total VP and VC demand, total user utility and revenue are shown in Figure 4. Notice that when the prices of the VP service are very low, user VP demand is higher than the total capacity available for the SD pair. For the minimum price of wx = 1.0, the users require as much as 6000 circuits of VP service, which is twice the available capacity. As a result, the blocking probability for the VC service is 1. As the VP service prices rise, the demand drops, and the VC blocking probability drops below 1 when the VP service demand drops below 3000. On the other extreme, when the VP prices are very high and VC prices very low, the demand for the VP service is zero and all user traffic requests the VC service (Figure 4b). The blocking probability in that case can be approximated by the Erlang formula for the total user load applied to a finite server system of 3000 servers. As VC prices increase, some users are discouraged from entering the system and as a result, the blocking probability is reduced. Figure 4c depicts the total user utility. Note that this is a strictly decreasing function of prices, except for a small region at the bottom right of the curve, where the VP service prices are low and the users allocate more VP service than the available capacity. The user utility is decreased in that case because users are allocated less than they have demanded. For any price vector that results in a total VP allocation less than the total capacity, the user utility function is strictly decreasing. Note that the higher user utility appears when prices are approximately at their minimum values. Therefore, a welfare maximizing policy would result in the lowest possible prices for the services such that network congestion would be avoided. On the other hand, the network revenue curve appears to be strictly increasing for small prices wx and wy. The revenue is maximized for wx = 5.9 and wy = 6.9. It is worthwhile to note that for these price values, blocking is nearly zero, i.e., the network is operating well below congestion levels. The total VP allocation is 1106 circuits and the total VC demand is 1564 Erlangs. However, as prices increase further, the network revenue drops as more users are discouraged. Although the revenue function has a general concave shape, there exist many local maxima. The reason for this is that as the prices rise, a user may leave the system, which locally decreases the revenue. However, as the 8
0
1
0
Total VP capacity 6 2 3 4 5
rate Total VC arrival 3 2 1
7
4
Agent Pricing Optimization
5 5
10
5
W 10 Wy 15
5
y
10 Wx
15
15
15
10 Wx
b) Total VC demand (Erlangs/1000)
15
1 W 0 y
1 W 0 y
5
5
ue Network Reven 15 10 5
ity Total User Util 0 5 10 15 -15 -10 -5
20
a) Total VP circuit demand (/1000)
15
15
Wx
5
c) Total user utility (/1000)
Wx
15
10
10
5
d) Network Revenue (/1000)
Figure 4: Plots of the total VP and VC demand, user utility and network revenue
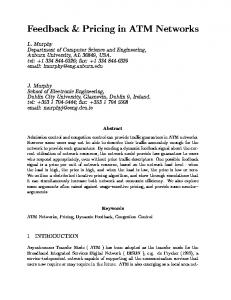
prices continue to rise, there is likely to be a price interval for which no users leave and as a result the revenue increases. When the prices are low, the increase in revenue appears to be almost linear, since all the users choose to enter the network. Figure 5 shows the behavior of the price adjustment scheme of [ANE96b] when applied to the above user population. In this figure, Plot a) shows the convergence of prices to the optimum values. Notice that convergence is attained in 20 iterations (the remaining 20 are necessary to verify the convergence criterion). Plot b) shows the total network revenue and blocking probability. Notice also that the blocking probability is equal to 1 during the initialization of the algorithm, and remains at this level until the VP capacity demand has dropped below the total number of available circuits (which happens after iteration 7). The VC demand starts from 0 and increases as VP prices become prohibitively expensive. The user utility also reaches a maximum at iteration 7 when congestion ceases to exist, and drops subsequently as prices increase. During the first 7 iterations, when the VP service demand cannot be entirely satisfied, all users have portions of their VP demand rejected. Because the network does not distinguish based on each user’s utility, the same demand percentage is rejected for each user. As a result, users with high values for the service observe the same blocking as others, and this causes the decreased utility value.
9
An Architecture for Controlling Service Demand in ATM Networks based on Pricing Agents 2.0
8 7
1.5
Price
6 5 1.0
Revenue/10000 Blocking Pr.
4 Wx 3
Wy
0.5
2 0.0
1 0
10
20
30
0
40
10
20
30
40
Iteration
Iteration
b) Network revenue and VC blocking probability
a) Prices vs. number of iterations 8000
VP Demand VC Demand
6000
Utility
4000
2000
0 0
10
20
30
40
Iteration
c) Total VP and VC demand and user utility Figure 5: Running Performance
4. Conclusions We have presented a service demand control scheme by deploying pricing agents at the edges of a public ATM network. Services are priced individually for every Source-Destination pair. Based on the knowledge that user demand is a decreasing function of the prices, the agents employ an iterative price adjustment scheme to reach an equilibrium that satisfies a set of objectives, such as bounded call blocking probabilities and maximum revenue. The SD pricing problems are completely independent and can be solved in a decentralized manner. This makes the agent architecture particularly suitable for this class of decentralized control problems. Since agents operate only with local information, further cooperation between the agents can be employed in order to achieve solutions that are characterized by network-wide optimality. Work is currently under way to provide a scheme for agent cooperation that maximizes revenue across the entire network. This scheme assigns capacity to individual SD pairs based on a measure of their “profitability”. The assigned capacity is then used by the pricing agents to determine the individual pricing policies. 10
Conclusions
References [ANE96a]
N. Anerousis and A.A. Lazar, “Virtual Path Control for ATM Networks with CallLevel Quality of Service Guarantees”, Proceedings of the 1996 INFOCOM, San Francisco, CA, March 1996. [ANE96b] N. Anerousis, “Managing Virtual Circuits and Virtual Paths on ATM Networks with Quality of Service Guarantees”, Ph.D. dissertation, Columbia University, New York, NY, 1996. [ANE95] N. Anerousis, and A.A. Lazar, “Managing Virtual Paths on Xunet III: Architecture, Experimental Platform and Performance”, Proceedings of the 1995 IFIP/IEEE International Symposium on Integrated Network Management, Santa Barbara, CA, May 15, 1995. [BAZ79] Bazaraa, M., and Shetty, C.M., “Nonlinear Programming, Theory and Algorithms”, John Wiley and Sons, Inc., 1979. [COC93] Cocchi, R., Shenker, S., Estrin, D., and Zhang, L., “Pricing in Computer Networks: Motivation, Formulation and Example”, in IEEE/ACM Transactions on Networking, Vol. 1, No. 6, December 1993. [HON95] Honig, M.L., Steiglitz, S., “Usage Based Pricing of Packet Data Generated by a Heterogeneous User Population”, in Proceedings of the 1995 INFOCOM, Boston, MA, April 1995. [HYM93] Jay M. Hyman, Aurel A. Lazar, and Giovanni Pacifici, “Modeling VC, VP and VN Bandwidth Assignment Strategies in Broadband Networks”, Proceedings of the Workshop on Network and Operating Systems Support for Digital Audio and Video, Lancaster, United Kingdom, November 3-5, 1993, pp. 99-110. [JIA95] H. Jiang and S. Jordan, “The Role of Price in the Connection Establishment Process”, European Transactions on Telecommunications, vol. 6, no. 4, July-August 1995, pp. 421-429. [JOR95] S. Jordan & H. Jiang, “Connection Establishment in High Speed Networks”, IEEE Journal on Selected Areas in Communications, vol. 13, no. 7, September 1995, pp. 1150-1161.
[LOW93]
Low, S. and Varaiya, P.P., “A New Approach to Service provisioning in ATM Networks”, in IEEE/ACM Transactions on Networking, Vol. 1 No. 5, pp. 547-553, October 1993. [MAC94a] MacKie-Mason, J.K., and Varian, H.R., “Pricing Congestible Network Resources”, Technical Report, University of Michigan, Ann Arbor, MI 48109. [MAC94b] J.K. Mackie-Mason and H.R. Varian, “Pricing the Internet”, Proceedings of the Second International Conference on Telecommunication Systems Modelling and Analysis, pp. 378-393, Nashville, Tennessee, March 24-27, 1994. [MUR94] Murphy, J. Murphy, L. and Posner, E.C., “Distributed Pricing for Embedded ATM Networks”, in Proceedings of the 14th International Teletraffic Congress, edited by J. Labetoulle and J.W. Roberts, Elsevier Science, 1994.
11
An Architecture for Controlling Service Demand in ATM Networks based on Pricing Agents
[PAR92]
[VAR78]
12
C. Parris, S. Keshav and D. Ferrari, “A Framework for the Study of Pricing in Integrated Networks”, ICSI Technical Report TR-92-016 and AT&T Bell Labs Technical Memorandum TM-920105-03, January 1992. Varian, H.R., “Microeconomic Analysis”, W.W. Norton & Company Inc., 1978.


![an open service architecture for sensor networks [PDF]](https://m.moam.info/img/260x300/an-open-service-architecture-for-sensor-networks-p_64afa60c098a9e947c8b45e9.jpg)