An Automated Component-Based Performance Experiment Environment Van Bui
Mathematics and Computer Science Division 9700 S. Cass Ave Argonne, IL 60439
[email protected]
Boyana Norris
Mathematics and Computer Science Division 9700 S. Cass Ave Argonne, IL 60439
[email protected]
ABSTRACT Performance experiments can involve multiple iterative runs where parameters such as the execution platform, measurement tools, methods of measurement, application parameters, and analysis techniques can vary. In order to manage the layers of complexity involved in setting up and running experiments, data management, and post analysis, a degree of abstraction and automation is necessary for each phase. We present an integrated component-based environment that leverages existing performance measurement and analysis technologies and automates the process of running multiple performance experiments and parameter selection of parallel scientific applications. Our component toolkit will enable application scientists to easily modify the experimental parameters over multiple execution runs and to selectively retrieve the data for analysis and generation of performance models.
1.
Lois Curfman McInnes
Mathematics and Computer Science Division 9700 S. Cass Ave Argonne, IL 60439
We employ a component-based approach1 to provide uniform infrastructure for managing performance experiments. Common interfaces enable us to encapsulate the handling of many disparate aspects of different hardware platforms and existing performance tools with similar functionality. The ultimate goal is to design a portable and extensible tool infrastructure that can make performance experiments with both component and non component applications much more streamlined and easier to perform routinely and automatically.
SCALASCA, TAU, etc…
BlueGene, Ranger, etc…
Performance Measurement 1
INTRODUCTION
PETSc, FLASH, etc…
Performance experiments typically involve several phases and often require many runs of an application with different configurations and inputs. In order to simplify the process, a more uniform interface is needed across different tools, technologies, and configuration settings. We outline here a common approach to performance experimentation, along with the tools we developed to simplify and automate this process. The first step in this process is determining what to measure. Next, the performance experiment must be set up and then executed using different tools whose selection depends on the underlying platform’s capabilities as well as the application. Once the data is collected, it can be stored to a database for later retrieval. Finally, analysis can be performed on the data to extract useful information. Figure 1 depicts the common scenario that we describe in running performance experiments.
[email protected]
Application Binary
Application Metadata
2
PerfExplorer, CUBE, PyLab, etc…
PerfDMF, MetaDB, etc…
Database
3
Analysis Visualization
Figure 1: Performance experiment workflow.
1.1
The Common Component Architecture
High-performance computing (HPC) is encountering increasing software development challenges caused by the growing complexity and size of libraries and applications and by the size and diversity of high-performance hardware platforms. The productivity costs of implementing, porting, and tuning the performance of large-scale scientific codes are rapidly rising. Component technology (e.g., [27]), which is now widely used in mainstream computing but is relatively new in HPC, builds on the ideas of object-oriented design to improve software interoperability, robustness, maintainability, and performance. Furthermore, component-based software engineering (CBSE) approaches present opportunities 1 Project website: http://trac.mcs.anl.gov/projects/ cca/wiki/performance.
for automation of many development activities, including the generation of portable build systems, automated performance instrumentation, and runtime adaptation of applications. The Common Component Architecture (CCA) Forum [7] has developed a component standard specifically targeting high-performance parallel applications. The CCA offers one possible solution to managing the complexity of software development, which in the case of HPC can involve multiple geographically distributed teams and different implementation languages. Like other component-based software engineering approaches, the CCA provides mechanisms and tools for defining interfaces that strictly determine what functionality is exposed or used by a component. The CCA specification itself is expressed in the Scientific Definition Interface Language (SIDL), and software written in accordance with the specifications must provide SIDL definitions of all interfaces and classes. Briefly, the terminology employed by the CCA specification includes ports, which are public interfaces exposed to other components, and components, which can either provide (i.e., implement) a port or use (i.e., call the methods on) a port. The work presented in this paper is applicable to both component and non component applications and is part of a component initiative on computational quality of service (CQoS) [21, 22], which helps application scientists dynamically compose, substitute, and reconfigure component implementations and parameters, taking into account tradeoffs among CQoS factors such as power usage, performance, accuracy, and reliability. The remainder of this paper is organized as follows. Section 2 briefly overviews related work. Section 3 describes the design of the performance experiment component infrastructure. Section 4 illustrates the use of the performance experiment components with two applications, and Section 5 presents some conclusions and discusses future work discussion.
2.
RELATED WORK
A number of performance tools and suites, including PAPI [5], TAU [26], Scalasca [11], Kojak [29], gprof [12], CATCH [10], and Active Harmony [28] can be used to collect, process, analyze, and visualize performance data. The Prophesy [31, 32] framework provides some level of automation for all the different phases of performance analysis: instrumentation, data collection, and model building. The focus of automation is mainly in the analysis, where optimization approaches are employed for model building based on performance data and application metadata. Prophesy relies on instrumentation. The TAU [26] and Scalasca [11] frameworks support all stages of the performance analysis process, with varying amount of manual effort required between stages. TAU supports automatic instrumentation of user code and provides a simple component for performance analysis whose interface allows the use of PerfExplorer scripts written in Jython. TAU has also proposed a component interface for performance measurement and model synthesis for both the component and
application layers [25]. Jasmine and Vasantha [19] and Woodside et al. [30], among others, describe automation of the performance model generation that relies on the use of design environments, where developers can easily specify different design scenarios and workloads. Balsamo et al. [4] have performed a survey on the role of performance prediction in software design in industry, specifically at early stages of the software design and implementation. This work is relevant to scientific software development because in many cases, design decisions and algorithmic choices can impact performance much more dramatically than more localized implementation decisions. Hrischuk et al. [15] describe performance model generation via prototypes for queueing systems. Equivalently, one can generate performance models provided with individual component performance models and application workflow information.
3.
PERFORMANCE EXPERIMENT COMPONENTS
We have defined component interfaces for each of the phases of the typical performance experiment workflow illustrated in Fig. 1. We have designed and created initial implementations of components for setting up and running a performance experiment, loading the data into a database, and assisting with certain common analysis tasks. In each phase, we rely on existing performance tools to provide the core functionality. For example, the runtime performance data gathering is supported by a number of tools, including TAU, HPCToolkit [14], Scalasca [11], and PerfSuite [23]. We introduce component interfaces to the different types of functionality provided by existing tools, which enables users to use them on a variety of platforms without having to master many individual tools. Of course, we cannot provide the full range of functionality of each individual tool under a simple common interface. Based on our experiences with multiple tools on various platforms, we have created interfaces that capture enough of the functionality to make the component infrastructure useful in the majority of typical performance experiment scenarios. Figure 2 shows the assembly of possible component instantiations for each phase. One of our main design goals is to make this infrastructure easily extensible to support many different performance tools, database formats, analysis techniques, and hardware platforms. In addition, all components provide standard ParameterPorts, which can be used to finetune their configuration. Note that the three phases we have outlined do not have to be executed in sequence or even on the same platform – we have placed them in the same graphical context simply to provide a visual summary. We discuss each phase in detail in the remainder of this section.
3.1
Experiment Setup and Data Collection
While a number of tools support the preparation of applications for performance experiments (e.g., automatic instrumentation of the source code for performance data collection), no single tool provides support for running these
Figure 2: Assembly of all performance components. experiments. Managing the experiment setup and execution are mostly manual tasks, which present a number of challenges. First, the type of data to be collected can be highly platform-dependent. For in-depth analysis, one often wishes to obtain fine-grain information about the performance of different hardware subsystems, for example, cache miss rates, floating-point instruction counts or issue rates, disk accesses, or network events. Second, the setup steps for using different tools vary, from setting environment variables to selecting one among many available configurations, each with different capabilities. Third, different tools produce data in different formats; and while utilities for translating among formats do exist, one must be somewhat familiar with the various formats and the tools themselves to use them effectively. Most platforms support hardware counters that can be used to collect fine-grained performance information. In the past, common interfaces, such as the one provided by PAPI [5], were sufficient to provide a layer of abstraction over the various hardware counter interfaces provided by vendors. In recent years, however, with the advent of multicore architectures, the common interfaces have been unable to provide access to enough underlying counters. For example, PAPI does not provide a way to access per core measurements, while most vendor APIs do. On newer architecture, a large number of common PAPI counter names are not supported, thus limiting the types of analysis that can be done without resorting to using the native counter names. Using native counters, on the other hand, results in performance models that are specific to a single architecture and cannot be easily
reused. We believe that the design of a single all-encompassing performance counter interface is a formidable, and possibly untenable, task. Thus, we have taken a different approach. Instead of providing a single interface to all possible counter types, we have defined a simple interface that can be implemented by multiple architecture-specific components whose implementation encodes any architectural idiosyncrasies. Furthermore, on most platforms, only a limited number of events can be measured during a single run, and not all combinations of events can be measured simultaneously. Hence, several experiments with the exact same input parameters may be needed in order to obtain all desired performance data. Naturally, we wish to limit the number of redundant experiments. At present the task of discovering which events can be measured simultaneously is tedious and manual, potentially resulting in running more experiments than strictly necessary. By creating architecture-specific measurement components, we can fully automate the grouping of events suitable for simultaneous measurement and thus minimize the number of required experiments. Experiment setup and data collection involve several tasks: • Composing and configuring the application, for example, specifying input parameters and algorithm choices; • Selecting the performance measurement approach and corresponding performance tool;
Figure 3: Experiment management components. • Configuring the performance tool and execution environment, for example, defining environment variables and tool options; • Collecting the performance data in a temporary staging area and relocating it to a (remote) performance database. The components for this phase are illustrated in Fig. 3 and include a driver, a component to set platform specific parameters, and a collector component. In the driver, users can set parameters such as the command for executing the application (for non component applications), the number of processes, and the number of threads. By using a platformspecific component such as XeonMeasurementEnv in Fig. 2, users can set the performance hardware events to monitor or just use the default sets of commonly used counters. The environment settings for the performance hardware events vary for each tool and even within tools. For TAU, depending on the collection mode, these can be set either by using environment variables or by using a TAU-specific command-line utility. In the latter case, the experiment driver retrieves the command line from the collector component (which is tool-specific), and similarly, the collector retrieves the set of events to monitor using the MeasurementEnvironment port, which is provided by platform-specific components, for example, XeonMeasurementEnv. Additional platforms and tools can be supported by implementing a component for the respective system or tool, e.g., BGPMeasurementEnv to support measurements on a Blue Gene/P. Invoking the go method of the driver’s GoPort manages the experiment process by configuring the environment, running the application with the specified parameters, and controlling the location where platform and tool-specific performance data for the given set of experimental parameters will be generated.
3.2
Importing Performance Data
Upon completion of an experiment, the performance data and associated metadata are normally stored on the file system in the format supported by the tool that was used to collect it during the experiment. In the importing phase, the data collected in a staged area is optionally postprocessed and eventually loaded into a remote database. At the moment we rely on the TAU-provided capability to import multiple file formats into PerfDMF [16] databases, so the implementation of the import functionality simply wraps the relevant TAU tool. In general, however, database components can be implemented in a standalone fashion. The existing CQoS infrastructure provides an implementation of a database management component, which can be extended to read different performance output formats as needed.
Because potentially large amounts of data are generated by certain types of performance experiments, the process of moving the data into the database can be overlapped with the application’s execution. The data migration requires access to remote databases and can thus run on the login nodes, or when possible, on a separate set of compute nodes. In large-scale parallel environments, the data itself is staged within the parallel file system (e.g., PVFS), enabling access by both login nodes and different sets of compute nodes. Our design also enables potential overlap of the analysis phase with the experiment phase, so in cases where very large amounts of data are generated, an analysis approach can be applied for reducing the volume of data prior to importing it into a remote database. The components handling this phase are illustrated in Fig. 4 and include a driver, a collector tool wrapper component, a database management component, and a measurement environment component (which is the same as the one that was used for running the experiment). The user can set driver parameters such as the location of the experiment and data directories and the names of the trials2 to load. The PerfDMF database component, PerfDMFDB, uses the collector component, TAUCollector, to prepare the data for loading. Such preparation can include converting the data to a format that is supported by the database component. In the database component, the user can set parameters such as the name of the configuration and the name of the loader utility in cases where an external, non component tool is exploited to import the data into a database. Other implementations of the database interface do not rely on external tool support for importing data into the database, for example the database components available as part of CQoS infrastructure [6]. This design allows the easy addition of new components to support multiple data formats, transfer protocols, and database interfaces. Our initial implementations wrap existing tools where available, for example, various PerfDMF import utilities. Future development will incorporate more possibilities, for example, using GridFTP [13] for more efficient transfers of large data sets. The actual post processing and subsequent data transfer are initiated by executing the go method in the GoPort provided by the driver. This establishes a connection to the database by using a cqos.db.DB port, provided by a database-specific component implementation, in this case, PerfDMFDB. The database component uses the cqos.perf.DataCollector port, which is implemented by a tool-specific component that encapsulates the tool-specific performance data format details. 2 We use the PerfDMF definitions of application, experiment, and trial.
Figure 4: Performance data postprocessing and database access components. In this example, the TAUCollector component is used to process data generated by the TAU suite of tools. The collector components acquire some platform-specific information through the use of a cqos.perf.MeasurementEnvironment port, which in this case is provided by the architecturespecific XeonMeasurementEnv component, which was previously used for running the experiments.
3.3
Performance Data Analysis
After the performance data has been generated and incorporated into a remote database, users have several choices. They can use performance tools such as PerfExplorer directly to study the data (if the database format is compatible), or they can perform some common types of analysis and simple visualization in a tool-independent manner using the analysis portion of our component infrastructure. In the analysis phase, the data that was loaded into a database in a prior phase is retrieved and analyzed to extract information useful to the user. Simple tool-independent visualization capabilities are also available. Note that this step need not be performed on the same platform where the experiments ran. For example, if the goal of analysis is data reduction (e.g., to avoid having to store prohibitively large amounts of data), then it should be executed on the same platform as the application, taking advantage of parallel resources if available. In other cases analysis is done at a later time, either on the machine where the database resides or on the user’s laptop or desktop computer. Similar to prior phases, the data analysis phase includes a driver and several components to support different kinds of data analysis (see the component wiring diagram in Fig. 5); the environment can be easily extended to support additional analysis techniques. The analyses that our environment currently supports include computation of several performance metrics derived from performance hardware events and a simple component (based on PyLab [24]) for charting the results over multiple trials or experiments. The parameters to be set include the trial or set of trials to analyze and information for connecting to the database. Running the driver will provide performance metrics for a given set of trials that can optionally be charted by using the plotter component. The performance data is accessible by other tools as well, since we are not reinventing performance database formats, but rather are providing import capabilities for existing database formats. For example, a TAUCollector component imports
data into a PerfDMF database, which can be analyzed by TAU tools such as PerfExplorer, which provide their own scripting and charting capabilities.
4.
EXAMPLE USE CASES
We demonstrate the functionality and intended use of the performance measurement component infrastructure by describing two use cases: a non component application from the OpenMP NAS Parallel Benchmark Suite [20] and a component implementation of a driven cavity flow simulation based on PETSc [3]. The experiments are run on an Intel Xeon workstation with dual quad-core E5462 Xeon processors (8 cores total) running at 2.8 GHz (1600 MHz FSB) with 32 KB L1 cache, 12 MB of L2 cache (6 MB shared per core pair), and 16 GB of DDR2 FBDIMM RAM, running Linux kernel version 2.6.25 (x86-64). We are also developing Blue Gene/P implementations of the architecture-specific components but do not yet have experimental results at this time.
4.1
Derived Performance Metrics
The performance metrics that we implement components for in the analysis phase of the experiments include L2 bandwidth, floating-point instructions per second (FLIPS), and FLIPS inefficiency. In general, each metric is implemented by creating a component that provides the CQoSMetric port. In the examples below, we use notation based on the preset PAPI hardware counter names to specify the derived performance metric computed by each component. Table 1 contains a list of the performance metric parameters and a brief description for each. The L2 bandwidth is computed by [(L2 M ISS ∗ L2 CACHE LIN E)/T OT CY C] ∗ M HZ,
(1)
Floating-point instructions per second (FLIPS ) is derived by F P IN S/(T OT CY C/M HZ),
(2)
The following metric identifies the regions of code that are compute-bound and have a high level of both floating-point instructions and stall cycles (FLIPS Inefficiency): (F P IN S/T OT IN S) ∗ (RES ST L/T OT CY C),
(3)
Figure 5: Performance analysis components.
Table 1: Performance metric parameters. Name Description L2 MISS L2 cache misses TOT CYC CPU cycles FP INS Floating point instructions TOT INS Total instructions RES STL Stall cycles on any CPU resource L2 CACHE LINE L2 cache line size MHZ CPU clock speed
4.2
Non Component Use Case
To demonstrate the use of our performance experiment framework for non-component applications, we chose the Embarrassingly Parallel (EP) benchmark from the NAS Parallel Benchmarks (NPB) [2]. The NPB benchmarks are a set of programs based on computational fluid dynamics (CFD) applications that measure the performance of parallel supercomputers. EP in particular estimates the upper achievable limits for floating-point performance. For the experiment set up and data collection phases, we implemented the XeonMeasurementEnv and the PerfSuiteCollector components. PerfSuite is an open source software package for application performance analysis that interfaces to the user through command-line tools that can be used with unmodified applications or through a compact API that allows more flexibility in selective monitoring of portions of an application [23]. The ExperimentDriver component connects with XeonMeasurementEnv and PerfSuiteCollector to generate the performance data for the experiment. We wrote a Ccaffiene [1] script to automate the experiments to run EP using 1, 2, 4, and 8 threads. When each trial completes running, the performance data collected is prepared for storage and uploaded to a database using our implementation of PerfDMFDB that uses the Performance Data Management Framework (PerfDMF) database interface [17]. The DataManagerDriver is connected to PerfDMFDB, which connects to PerfSuiteCollector. A connection to PerfSuiteCollector is needed to retrieve the tool-specific data format type. The data format must be supported by the database component in order to be successfully loaded to the database. For the analysis portion, we developed a set of components
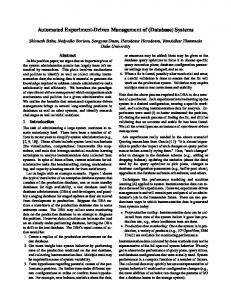
to support automatic generation of the performance metrics from Section 4.1. To support simple visualization, we implemented a Plotter component that retrieves data for a set of trials from the database to compute and plot the performance metrics. The performance data is retrieved and the performance metrics are computed by using PerfExplorer [18]. PerfExplorer provides support for parallel performance data mining and knowledge discovery. Our framework generates a PerfExplorer Python script that retrieves a set of trials from the PerfDMF database, computes the performance metrics, and generates the performance plots for each metric across trials. The Plotter component that we implement is based on PyLab [24], which includes 2-D plotting capabilities. The PyLab-based plots generated from our experiments are shown in Figure 6 and includes wall-clock time (Fig. 6(a)), memory bandwidth computed by Eq. 1 (Fig. 6(b)), MFLIPS computed by Eq. 2 (Fig. 6(c)), and FLIPS inefficiency computed by Eq. 3 (Fig. 6(d)).
4.3
Component Use Case
To illustrate the use of the performance experiment framework for component-based applications, we chose a driven cavity flow simulation, which combines lid-driven flow and buoyancy-driven flow in a two-dimensional rectangular cavity. The lid moves with a steady and spatially uniform velocity and thus sets a principal vortex and subsidiary corner vortices. The differentially heated lateral walls of the cavity induce a buoyant vortex flow, opposing the principal lid-driven vortex. The implementation uses a velocityvorticity formulation of the Navier-Stokes and energy equations, which is discretized by using a standard finite-difference scheme with a five-point stencil for each component on a uniform Cartesian mesh; see [8] for a detailed problem description. The component implementation is based on the TOPS [9] solver interfaces and their PETSc-based implementations, which are included in the PETSc software distribution. The main difference between the procedure for running performance experiments of component applications as opposed to supporting non component ones is the use of a different driver component in the first phase, in this case the CCAExperimentDriver component. Instead of specifying configuration parameters for the application’s executable and its command line, the CCAExperimentDriver simply uses a standard gov.cca.ports.GoPort, which is the main entry point to CCA applications. By connecting to the applica-
(a) Wall-clock time vs. number of threads.
(b) Memory bandwidth per thread vs. number of threads.
(c) MFLIPS per thread vs. number of threads.
(d) FLIPS inefficiency per thread vs. number of threads.
Figure 6: Example metric plots generated with the PyLab-based Plotter component for the EP benchmark.
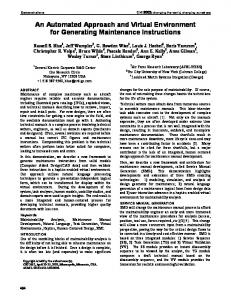
(a) Wall-clock time vs. number of processes.
(b) Memory bandwidth vs. number of processes.
(c) MFLIPS vs. number of processes.
(d) FLIPS inefficiency vs. number of processes.
Figure 7: Example metric plots generated with the PyLab-based Plotter component for the component driven cavity application.
tion’s GoPort, the CCAExperimentDriver can start the application’s execution after configuring the runtime environment. The application itself is configured exactly as it would be for a normal run; that is, all instantiations of components, port connections, and parameter configuration remain unchanged. The only difference from normal production runs is that the go method is not invoked directly on the applications own driver. We used components based on TAU for the collection of performance data and a PerfDMF database for storing it. The tool-specific components involved were TAUCollector and PerfDMFDB. We performed these experiments on a Xeon workstation and thus used the XeonMeasurementEnv component to configure the environment. We used the same analysis components as we did for the EP benchmark and plotted the results with the PyLabbased Plotter component. The resulting plots are shown in Fig. 7. which includes wall-clock time (Fig. 7(a)), cummulative memory bandwidth computed by Eq. 1 (Fig. 7(b)), cummulative FLIPS computed by Eq. 2 (Fig. 7(c)), and cummulative FLIPS inefficiency computed by Eq. 3 (Fig. 7(d)). While at this stage we are still actively developing the components and running mainly small-scale experiments, the infrastructure as a whole is intended to be lightweight and scalable. Our goal is to avoid imposing any limitations on the scalability of an application.
5.
CONCLUSION
We have described the design and initial implementation of a set of components for managing the performance experiments of HPC applications. This infrastructure leverages many existing tools, making them accessible through simplified, uniform interfaces and filling gaps in tool support for some of the phases involved in running performance experiments on modern high-performance platforms.
[3]
[4]
[5]
[6]
[7] [8]
[9] [10]
The interfaces and component implementations are still evolving, and we expect to add significant new functionality in the near future to provide access to different tools and enable use on multiple architectures of interest, including the Blue Gene/P and other IBM architectures and Linux clusters with Intel and AMD processors. We will also expand our collection of CQoS metrics components, so that other developers can use them directly or as examples for writing their own.
[11]
Acknowledgements
[13]
This work was supported by the Office of Advanced Scientific Computing Research, Office of Science, U.S. Department of Energy, under Contract DE-AC02-06CH11357.
[14] [15]
6.
[12]
REFERENCES
[1] B. Allan, R. Armstrong, S. Lefantzi, J. Ray, E. Walsh, and P. Wolfe. Ccaffeine – a CCA component framework for parallel computing. http://www.cca-forum.org/ccafe/, 2005. [2] D. H. Bailey, E. Barszcz, J. T. Barton, D. S. Browning, R. L. Carter, D. Dagum, R. A. Fatoohi, P. O. Frederickson, T. A. Lasinski, R. S. Schreiber,
[16]
H. D. Simon, V. Venkatakrishnan, and S. K. Weeratunga. The NAS Parallel Benchmarks. The International Journal of Supercomputer Applications, 5(3):63–73, Fall 1991. S. Balay, K. Buschelman, V. Eijkhout, W. D. Gropp, D. Kaushik, M. G. Knepley, L. C. McInnes, B. F. Smith, and H. Zhang. PETSc users manual. Technical Report ANL-95/11 - Revision 3.0.0, Argonne National Laboratory, 2008. S. Balsamo, A. D. Marco, P. Inverardi, and M. Simeoni. Model-based performance prediction in software development: A survey. IEEE Transactions on Software Engineering, 30(5):295–310, 2004. S. Browne, J. Dongarra, N. Garner, G. Ho, and P. Mucci. A portable programming interface for performance evaluation on modern processors. Int. J. High Perform. Comput. Appl., 14(3):189–204, 2000. V. Bui, B. Norris, K. Huck, L. C. McInnes, L. Li, O. Hernandez, and B. Chapman. A component infrastructure for performance and power modeling of parallel scientific applications. In Proceedings of Component-Based High Performance Computing Workshop, October 14-17, 2008, Karlsruhe, Germany. ACM, 2008. Common Component Architecture (CCA) Forum. http://www.cca-forum.org/. T. S. Coffey, C. T. Kelley, and D. E. Keyes. Pseudo-transient continuation and differential-algebraic equations. SIAM J. Sci. Comput., 25(2):553–569, 2003. D. Keyes (PI). Terascale Optimal PDE Simulations (TOPS) Center. http://tops-scidac.org/, 2006. L. DeRose and F. Wolf. CATCH: A call-graph based automatic tool for capture of hardware performance metrics for MPI and OpenMP applications. In Euro-Par ’02: Proceedings of the 8th International Euro-Par Conference on Parallel Processing, pages 167–176, London, UK, 2002. Springer-Verlag. M. Geimer, F. Wolf, B. J. N. Wylie, and B. Mohr. Scalable parallel trace-based performance analysis. In Proceedings of the 13th European PVM/MPI Users’ Group Meeting on Recent Advances in Parallel Virtual Machine and Message Passing Interface (2006), pages 303–312, Bonn, Germany, 2006. S. L. Graham, P. B. Kessler, and M. K. McKusick. gprof: A call graph execution profiler. In SIGPLAN Symposium on Compiler Construction, pages 120–126, 1982. GridFTP Web Page. http://www.globus.org/grid_ software/data/gridftp.php. HPCToolkit Web Page. http://hpctoolkit.org/. C. Hrischuk, J. Rolia, and C. Woodside. Automatic generation of a software performance model using an object-oriented prototype. In Modeling, Analysis, and Simulation of Computer and Telecommunication Systems, 1995. MASCOTS ’95., Proceedings of the Third International Workshop on, pages 399–409, Jan 1995. K. Huck, A. Malony, R. Bell, L. Li, and A. Morris. PerfDMF: Design and implementation of a parallel performance data management framework. In In Proceedings of the International Conference on
[17]
[18]
[19]
[20]
[21]
[22]
[23] [24] [25]
[26]
[27]
[28]
[29]
[30]
Parallel Processing (ICPP 2005). IEEE Computer Society, 2005. K. Huck, A. Malony, R. Bell, and A. Morris. Design and implementation of a parallel performance data management framework. In Proceedings of the International Conference on Parallel Computing, 2005 (ICPP2005), pages 473–482, 2005. K. A. Huck and A. D. Malony. PerfExplorer: A performance data mining framework for large-scale parallel computing. In Conference on High Performance Networking and Computing (SC’05), Washington, DC, 2005. IEEE Computer Society. K. S. Jasmine and R. Vasantha. An automated environment for design based performance prediction of component based software products. International Journal of Computer Science and Network Security, 8(8):116–120, 2008. H. Jin, H. Jin, M. Frumkin, M. Frumkin, J. Yan, and J. Yan. The OpenMP implementation of NAS Parallel Benchmarks and its performance. Technical report, 1999. L. C. McInnes, J. Ray, R. Armstrong, T. L. Dahlgren, A. Malony, B. Norris, S. Shende, J. P. Kenny, and J. Steensland. Computational quality of service for scientific CCA applications: Composition, substitution, and reconfiguration. Technical Report ANL/MCS-P1326-0206, Argonne National Laboratory, Feb 2006. B. Norris, J. Ray, R. Armstrong, L. C. McInnes, D. E. Bernholdt, W. R. Elwasif, A. D. Malony, and S. Shende. Computational quality of service for scientific components. In In Proceedings of the Int. Symp. on Component-Based Software Engineering, Edinburgh, Scotland, 2004. PerfSuite. http://perfsuite.ncsa.uiuc.edu/. PyLab Web Page. http://www.pmodels.org/. J. Ray, N. Trebon, R. C. Armstrong, S. Shende, and A. Malony. Performance measurement and modeling of component applications in a high performance computing environment: A case study. Parallel and Distributed Processing Symposium, International, 1:95b, 2004. S. Shende and A. D. Malony. The TAU parallel performance system. International Journal of High Performance Computing Applications, 20(2):287–331, 2006. C. Szyperski. Component Software: Beyond Object-Oriented Programming. ACM Press, New York, 1999. C. Tapus, I.-H. Chung, and J. K. Hollingsworth. Active Harmony: Towards automated performance tuning. In Supercomputing ’02: Proceedings of the 2002 ACM/IEEE Conference on Supercomputing, pages 1–11, Los Alamitos, CA, 2002. IEEE Computer Society Press. F. Wolf and B. Mohr. Automatic performance analysis of hybrid mpi/openmp applications. Journal of Systems Architecture: The EUROMICRO Journal, 49(10-11):421–439, 2003. M. Woodside, C. Hrischuk, B. Selic, and S. Bayarov. Automated performance modeling of software generated by a design environment. Performance
Evaluation, 45(2-3):107–123, 2001. [31] X. Wu, V. Taylor, J. Geisler, X. Li, Z. Lan, R. Stevens, M. Hereld, and I. R. Judson. Design and development of the prophesy performance database for distributed scientific applications. In Proc. the 10th SIAM Conference on Parallel Processing for Scientific Computing, Virginia, March 2001. [32] X. Wu, V. Taylor, C. Lively, and S. Sharkawi. Performance analysis and optimization of parallel scientific applications on CMP cluster systems. Scalable Computing: Practice and Experience, 10(1):188–195, 2009.
The submitted manuscript has been created by UChicago Argonne, LLC, Operator of Argonne National Laboratory (“Argonne”). Argonne, a U.S. Department of Energy Office of Science laboratory, is operated under Contract No. DE-AC0206CH11357. The U.S. Government retains for itself, and others acting on its behalf, a paid-up, nonexclusive, irrevocable worldwide license in said article to reproduce, prepare derivative works, distribute copies to the public, and perform publicly and display publicly, by or on behalf of the Government.