An Environment for Automated Test Case Generation from Statechart-based and Finite State Machine-based Behavioral Models Valdivino Santiago, N. L. Vijaykumar, Danielle Guimarães, Ana Silvia Amaral, Érica Ferreira National Institute for Space Research São José dos Campos, SP, 12227-010, Brazil
[email protected],
[email protected],
[email protected],
[email protected],
[email protected]
Abstract Automated test case generation from behavioral models like Finite State Machines (FSMs) and Statecharts has long been studied. Environments that enable a test designer to model a real complex software and to obtain test cases to validate such a software are mandatory in an automated test approach. This paper presents an environment, GTSC, which enables test sequences to be obtained from both Statechart-based and FSM-based behavioral models. The environment supports test case generation from some test methods for FSM, such as switch cover, DS and UIO methods, and also from some test criteria for Statecharts based on the SCCF family. Two case studies involving embedded software developed for two computers of scientific experiments of a satellite under development at National Institute for Space Research (INPE) are presented in order to show the usefulness of the environment.
1. Introduction Model-Based Testing (MBT) has drawn lot of attention in both industrial and academic areas in which several models have been used in order to guide test process activities like test case generation and test result analysis. Testing community tends to consider MBT as a type of functional testing (black box testing) in which tests are derived from a software behavioral specification model [1]. However, Utting et al. [2] proposed a Taxonomy of MBT split into seven distinct dimensions that allows the characterization of different approaches. In such taxonomy there is a dimension, Test Selection Criteria, in which many structural (white
box) coverage criteria could be adapted to work on models. So, one could assume that MBT can also be considered as a type of structural testing (white box testing) based on, for instance, Control Flow Graphs and Data Flow Graphs structural models. With respect to software behavioral models, some of them have been using for testing, like Finite State Machines (FSMs) [3], Statecharts [4] and Markov chains [5]. Simplicity is one of the key advantages in using FSM as a modeling technique and it has been in use for modeling reactive systems and protocol implementations for such a long time. Once a Implementation Under Test (IUT) is modeled as a state-transition diagram representing an FSM, several methods like T, DS, UIO, W [6], switch cover [7] and state counting [8] can be used to generate test cases. Also, comparisons of fault detection effectiveness of some of these methods have been demonstrated in [6]. Parallel activities and hierarchy are features usually present in modern complex software. These features are really hard to represent using FSMs, so this leads to considering higher-level techniques as Statecharts. Several approaches have been proposed to generate test cases from Statecharts models. Hong et al. [9] provides a way to derive Extended FSMs from Statecharts to devise test criteria based on control and data flow analysis. Binder [10] adapted the W method to a UML context and named it round-trip path testing, in which flattening a Statechart is a pre-requisite before using the method itself. Santiago et al. [11] proposed a methodology to transform hierarchical and concurrent Statecharts into FSMs with the support of the PerformCharts tool. Souza [12] proposed a family of testing coverage criteria, Statechart Coverage Criteria Family (SCCF), for models in Statecharts. Test requirements established by the SCCF criteria are obtained from the Statecharts reachability tree [13].
2008 IEEE International Conference on Software Testing Verification and Validation Workshop (ICSTW'08) 978-0-7695-3388-9/08 $25.00 © 2008 IEEE
Using simulation, Briand et al. [14] analyzed the costeffectiveness of Statechart-based testing coverage criteria. Despite all these test criteria, as well as comparisons among them in terms of cost-effectiveness, for both FSM and Statecharts models, it seems that environments for automating the test case generation activity taking into account real complex software are not very common and most of them, when they do exist, are proprietary. The community that is involved in testing critical software must be able to count on such environments in order to develop the product in a reliable manner with a higher degree of quality. Scenario where a test designer can model the behavior of an entire IUT in such an environment and, applying several different test criteria, can obtain test cases ready to be applied is a desirable aspect specially when considering complex software. Problems of test case explosion using FSM-based tools have to be addressed before applying the tests. Also, flexibility to model the IUT in several techniques is interesting in order to deal with the heterogeneity of test designers. This paper presents an environment, Geração Automática de Casos de Teste Baseada em Statecharts (GTSC – Automated Test Case Generation based on Statecharts). It allows test designers to model a software behavior using FSM and/or Statecharts in order to generate test cases automatically based on some test methods for FSM, like switch cover, DS and UIO methods, and also from some test criteria for Statecharts based on the SCCF family. The core of the GTSC environment is the PerformCharts tool [11] developed, at first, for performance evaluation and, then, adapted for test case generation. This paper is organized as follows. Section 2 describes the methodology used for automated test case generation within a research project at National Institute for Space Research (INPE) before the development of the GTSC environment. Section 3 describes GTSC and its present status. Section 4 describes the SCCF testing coverage criteria family. Two case studies involving embedded software developed for two computers of scientific experiments of a Brazilian satellite are shown in section 5 in order to show the use of the environment. Section 6 concludes the paper and addresses future research directions.
2. Previous methodology The previous methodology used for automated test case generation within a research project at INPE from Statechart-based models can be summarized in Figure
1, in which the rectangles represent separate tools. The main support for this methodology is the PerformCharts tool used primarily for performance evaluation [15] by converting a Statecharts specification into a Markov chain (for performance evaluation) or an FSM (for test case generation). In case of Markov chain, the tool also calculates steadystate probabilities. In PerformCharts, events are interpreted as: internal (or immediate) that are sensed and triggered automatically (not explicitly stimulated) taking zero time when enabled; or external events (these are stochastic and follow an exponential distribution, for performance evaluation) and are explicitly stimulated. Statecharts specification is converted into a Markov chain or FSM by: from an initial configuration (BASIC states of each orthogonal component at the initial instant), enabled immediate events are triggered and a new configuration is obtained; for this new configuration, enabled external events are stimulated yielding new configurations; for each of these configurations, internal events, if enabled, are triggered, firing transitions to yield a new configuration; this stimulation goes on until all the configurations have been expanded. The result is a set where each element consists of a source configuration, stimulated external event (along with its transition rate with exponential distribution, for performance evaluation), and the target configuration. This set is an FSM (or a Markov chain and when solved steady-state probabilities are obtained). Figure 2(a) shows an example with three parallel components that correspond to two machines (E1 and E2) and a supervisor (Supervisor) to repair any eventual failure of the machines. The corresponding Markov chain is shown in Figure 2(b). Statecharts specification is written in an XML-based PerformCharts Markup Language (PcML) [11] and a script developed in Perl interprets PcML and generates a main program in C++ language that creates the necessary data structures to hold the specification and calls to methods to produce the Markov chain or the FSM. ConData [16] is a test case generation tool for FSMbased specifications. ConData stems from “control” and “data”. The control aspect is related to the valid sequences of events that the machine represents. The data aspect allows parameters of events to be generated. ConData implements the switch cover method [7] in which a switch is a transition-totransition pair. The method generates test cases to cover all pairs of transitions in the model. ConData requires its input data described as a Prolog base of
2008 IEEE International Conference on Software Testing Verification and Validation Workshop (ICSTW'08) 978-0-7695-3388-9/08 $25.00 © 2008 IEEE
A
B
PcML Specification
Perl Script
C FSM (XML format)
PerformCharts
C++ Program
E Test Cases
D
Condado
XSLT Parser
Base of Facts
Figure 1. Previous methodology for automated test case generation.
W1,W2,WS a1
a2 r2
r1 P1,W2,WS
W1,P2,WS
a2
f1
s1
a1
s2
f2 r2
B1,W2,C1
r1
W1,B2,C2
P1,P2,WS
a2
a1
f2
f1
r2
r1 B1,P2,C1
s1
s2
f2
P1,B2,C2 f1
B1,B2,C1
B1,B2,C2 s1
s2
(a) (b) Figure 2. Statecharts modeling. (a) A system with two machines and a repairer; (b) Resulting Markov Chain. facts [16]. To summarize and referring to Figure 1, the previous methodology to convert Statechart-based specification of a software into test cases can be described in the following steps [11]: (A) the software specification is written in PcML; (B) by using a Perl script, the PcML specification is converted into a text file containing the C++ main program; (C) PerformCharts tool is executed and the corresponding FSM, in XML, is generated; (D) FSM generated by PerformCharts must be written as a Prolog base of facts required by ConData. FSM in XML format is translated by using XSLT into the input required by ConData; (E) finally, the ConData tool generates the test cases for the software initially specified in Statecharts. As all the tools used for test case generation were not integrated, the methodology just described demanded a lot of effort from the test designer because all the steps require manual intervention in order to make the proper adjustments for an output from a tool to be used as input to another tool.
3. The GTSC environment In order to make the process of generating test cases from Statechart-based models easier, GTSC environment was proposed. Figure 3 shows the conceptual view of GTSC. Using GTSC, test designers can model the IUT using Statecharts and FSM techniques. For Statecharts modeling, GTSC provides an editor so that the user can write the specification in PcML language. Also, a Graphical User Interface (GUI) is under development so that the model in Statecharts can be drawn and the corresponding PcML specification is automatically obtained. The Statecharts Flattener in Figure 3 was developed to integrate the Perl script and the PerformCharts tool shown in Figure 1. This is an important feature because previously the test designer had to spend some time to adjust the output of the Perl Script to be used by PerformCharts. At present, it is only necessary to generate the PcML specification to directly obtain the flat FSM.
2008 IEEE International Conference on Software Testing Verification and Validation Workshop (ICSTW'08) 978-0-7695-3388-9/08 $25.00 © 2008 IEEE
PcML Editor
Statechart-based
PcML Specification
Statecharts Flattener
...
Statechart-based GUI State 0
a [x > 10] / done
FSM-based
FSM (XML format)
State 1
FSM methods: T Switch Cover DS UIO W State Counting
b [y = 5] / end State 2
Test Cases
Reachability Tree Generator
Statecharts criteria: SCCF family Round-trip Path
Figure 3. Conceptual view of GTSC environment. Once an FSM is obtained, the test designer can choose between generating test cases from Statechartbased test criteria or from FSM-based test methods. FSM-based methods available, at present, in GTSC are switch cover, DS and UIO. Statechart-based test criteria implemented in GTSC are based on the SCCF family [12]. Up to now, alltransitions criterion from SCCF is implemented in GTSC but this criterion strictly includes three other criteria from this family. GTSC test case generation from this testing coverage criteria family is a threefold process: firstly, GTSC generates Statecharts reachability tree [13]; based on this tree, test requirements established by a selected SCCF test criterion is obtained; finally, according to this test criterion, test sequences are then generated to exercise these requirements. Section 4 will discuss the SCCF family and the reachability tree in more detail. Naturally, it is possible to model the entire IUT with a single technique, but certain features can be modeled by Statecharts and others using FSM. Although a flat Statecharts is in fact an Extended FSM, a test designer may be used with FSM modeling without any “transformation”. In other words, using Statecharts specification in GTSC, the model will be flattened before the FSM test methods can be applied and this process may be undesirable for some professionals. This feature of GTSC tries to address the diversity of different behavioral models that may be used in MBT. Note that, for FSM-based modeling, GTSC shall translate the specification directly to the XML output format shown in Figure 3. Modeling the behavior of a particular software can
be accomplished in many different ways. For instance, a test designer can model the entire software using different abstraction levels. High-level modeling is useful when it is necessary to figure out the entire software. But, low-level modeling is extremely important to specify the details related to the software, like method names, parameters and variable values. For test sequence generation, at some point, a low-level modeling should be done in order to generate input data ready to be applied by a tester during the test case execution activity within a test process. For instance, considering communication protocols testing, a lowlevel modeling is required so that variable values related to different fields of the frame, packet, segment can be pointed out. The assignment of test input data is a non-trivial problem related to test case generation. At this moment, GTSC addresses this problem in two different ways. If a test designer models using a low-level abstraction option, usually making use of variables in guard conditions, these assignments shall be created according to a test approach developed by the test designer. Traditional functional testing techniques like category-partition [17] can be used to address variables’ values generation. Once variables’ values are chosen, the test designer can explicitly assign these values in the PcML specification and GTSC will be able to generate test cases and their test input data. On the other hand, if a high-level abstraction modeling is used, without any use of variables in guard conditions, a test designer only needs to translate the Statecharts model into a PcML specification. Then, GTSC will generate test cases and their test input data
2008 IEEE International Conference on Software Testing Verification and Validation Workshop (ICSTW'08) 978-0-7695-3388-9/08 $25.00 © 2008 IEEE
automatically. Case studies presented in section 5 will address both the options: low-level and high-level modeling approaches.
4. The SCCF testing coverage criteria family SCCF family was proposed by Souza [12] to investigate test criteria applications for testing the behavior of specifications of reactive systems described in Statecharts. This family of testing criteria helps the validation process of Statecharts specifications providing mechanisms to evaluate test sequence coverage of a specification and also to drive test case generation according to these criteria. Figure 4 shows the hierarchical relation of SCCF family. From the top to the bottom layers of hierarchy following the arrows, one criterion strictly includes another. For instance, all-paths criterion strictly includes all-paths-k-configurations as well as allpaths-k-C0-configuration. Some of these test criteria are very traditional in transition-based systems like allconfigurations (all the configurations must be reached at least once) and all-transitions (all the transitions must be reached at least once) criteria. On the other hand, some criteria attempt to be more rigorous than all-configurations and all-transitions criteria but less expensive than all-paths, such as all-paths-kconfigurations in which all paths containing at most k repetitions of each configuration must be traversed at least once. Furthermore, all-history-configurations and all-broadcasting criteria address history and broadcasting features, respectively, which are inherently related to Statecharts. Another Statecharts feature, parallelism/concurrency, is covered by allconfigurations test criterion. As mentioned in Section 3, at present GTSC environment enables the user to generate test sequences based on all-transitions criterion. Although only one test criterion is implemented at this moment, it is important to realize that all-transitions strictly includes all-configurations, all-history-configurations and allbroadcasting criteria. So, the test requirements/test cases that satisfy the all-transitions criterion will definitely address these three important characteristics of Statecharts: parallelism, history and broadcasting. That is the main reason to opt for it as the first to be available in the GTSC environment. Statecharts hierarchy/depth is addressed in GTSC by the flattening process. At this point, an important consideration shall be mentioned. A reachability tree is only a behavioral representation of Statecharts [13]. The reachability tree
shows the possible configurations and paths (sequence of configurations) that the system can reach. The SCCF testing coverage criteria family requires a reachability tree in order to generate, at the end of the process, test sequences. However, the paper described here shows that PerformCharts tool converts the Statecharts specification into a state-transition diagram. The algorithm to generate the state-transition diagram has already been shown in Section 2 which is similar to the one discussed in [13]. In order to generate test sequences from PerformCharts tool based on the SCCF family, the state-transition diagram obtained from PerformCharts has been adapted to resemble a reachability tree. Due to this, the Reachability Tree Generator was developed as one component of GTSC. An example of a reachability tree generated by GTSC is shown in Figure 5. The Statecharts model from which this tree was obtained is an AND-state composed of two XOR-states. From the reachability tree and according to all-transitions criterion, test requirements are obtained. Then, test sequences are generated to exercise these test requirements. With respect to the notation of the reachability tree in Figure 5, it is important to mention that each node represents a possible configuration of states and four types of configurations were defined [12]: new, old, terminal and history. The old configuration is the one which already exists on the left side or in the upper levels of the tree. Such configuration is represented by the symbol ↑ meaning a link to the first occurrence of the same configuration in the tree. So, when the test sequence to satisfy the test requirement (C2, C4) is exercised and the node ↑C4 is reached, in fact this means that this configuration is linked to C4 on its left side and it is not a terminal node. Configurations are labeled starting from 0 in the order they were generated by GTSC implementation of the algorithm presented in [13]. Active states in a configuration are marked with 1 and inactive ones with 0. For instance, configuration C3 in Figure 5 means states UsingR1R2 and Idle2 are the ones that are active. It is relevant to point out that the reachability tree algorithm proposed in [13] does not represent within the tree the internal events caused by execution of actions because the concern is only related to external events. A similar concept is implemented in the PerformCharts tool. Furthermore, in PerformCharts it is possible to use variables within guard conditions. This feature can be very helpful in specifying complex software behavior as will be addressed in the next section.
2008 IEEE International Conference on Software Testing Verification and Validation Workshop (ICSTW'08) 978-0-7695-3388-9/08 $25.00 © 2008 IEEE
all-paths
all-paths-k-C0-configuration
all-paths-k-configurations
all-one-loop-paths all-simple-paths
all-transitions
all-loop-free-paths all-configurations
all-history-configurations
all-broadcasting
Figure 4. Hierarchical relation of SCCF family. C = [(Idle1, UsingR1, UsingR1R2), (Idle2, UsingR2, UsingR2R1)] C0 = [(1, 0, 0), (1, 0, 0)] C3 = [(0, 0, 1), (1, 0, 0)] C1 = [(0, 1, 0), (1, 0, 0)] C4 = [(0, 1, 0), (0, 1, 0)] C2 = [(1, 0, 0), (0, 1, 0)] C5 = [(1, 0, 0), (0, 0, 1)] C0
e1
e4
C1 e2
C3
C2 e4
C4
e1
e5
C4
C5 e6
e3
C0
C0
Figure 5. A reachability tree generated by GTSC.
5. Case studies This section shows the use of GTSC to generate test cases for two embedded software products under development at INPE. It is important to mention that when considering some characteristics of software products in the next sub-sections, like amount of Lines of Source Code (LOCs) and programming languages used for developing the products, such information is related to simulated versions of the software that will be embedded in real experiments. But, these simulated versions were developed according to the same specifications of the real software and thus they are similar.
5.1. Software for APEX scientific experiment The first example is the software embedded in an astrophysical experiment, APEX, computer of a
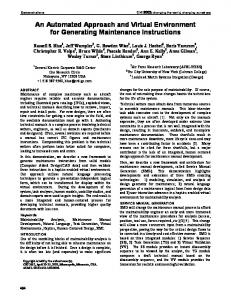
Brazilian scientific satellite. A proprietary protocol was specified for the communication between APEX and the On-Board Data Handling (OBDH) computer [18]. OBDH is the satellite platform computer in charge of processing platform and payload information and generating data to be transmitted to Ground Stations. The communication is in master-slave mode, where the experiment is totally controlled by OBDH. The APEX embedded software has 3,028 LOCs implemented in Java/C/C++ programming languages. Even though it seems the software is not so complex, it is important to consider the context of a satellite application. Software embedded into satellite’s onboard computers may be considered complex due its close interaction with the computer hardware, sensors, actuators and other devices present in the satellite, and hard to be replaced in case of faults due to the unmanned aspect of the mission. In order to show the usefulness of GTSC, the chosen IUT is only a piece of the APEX embedded software: the command recognition component. The command message format sent by OBDH to the experiment is composed of 6 fields: SYNC (EB9 synchronization value), EID (experiment identification), TYPE (specifies accepted commands), SIZE (amount of Bytes in the DATA field), DATA and CKSUM (8-bit checksum). SIZE and DATA fields are optional and depend on the type of command. The command recognition component behavior of the embedded software is shown in Figure 6. It is a low-level modeling in which it is possible to see all the specified values of the protocol frame fields. For instance, looking at the transitions leaving the Waiting Type state, the TYPE field can assume the following valid values (all expressed in hexadecimal): from 01 to 05, 07, 1A, 1B and 1F. Table 1 provides some mnemonics to help understanding the model in Figure 6. It is important to notice that TYPE values 01, 02, 03, 04 and 05 do not have the optional fields SIZE and DATA in the command message. On the other hand, TYPE values 07, 1A, 1B and 1F have such fields. The dynamics of the model is explained as follows. The initial configuration is (Idle, Waiting Sync). All fields of the command message are verified by the experiment through on-board software. For instance, assume that a command sent to the experiment with these values was received exactly as it was sent (i.e. no data corruption during the command transmission): SYNC = EB9, EID = 2, TYPE = 03, CKS = 80. Occurrence of event EB9 makes the B XOR-state to change its active sub-state from Waiting Sync to Checking Field. Waiting ExpId is the initial state of Checking Field.
2008 IEEE International Conference on Software Testing Verification and Validation Workshop (ICSTW'08) 978-0-7695-3388-9/08 $25.00 © 2008 IEEE
Figure 6. Statecharts model of the command recognition component of APEX software. Table 1. Mnemonics in Figure 6. Mnemonics EB9 rc eid tp, sz cksum x a b c d
y
Meaning Synchronism value Received. Indicates an event has happened Experiment identification Auxiliary variables Checksum x = a or b or c or d tp = 07 and (data = 00 or data = 01) tp = 1A and (initial_address = loading pointer) tp = 1F and (data = 30 or data = 31 or data = 32 or data = 33 or data = 3E or data = 3F or data = 40 or data = 45 or data = 46 or data = 47 or data = 48) type = 01 or type = 02 or type = 03 or type = 04 or type = 05 or type 07 or type = 1A or type = 1B or type = 1F
Then, the action (internal event) starting timing counting makes the A XOR-state change from sub-state Idle to sub-state Counting Time. After EB9, the eid rc[eid = 2] event is triggered because EID = 2. The B XOR-state moves from Waiting ExpId to Waiting Type. As TYPE = 03, the event type rc [type >=01 and type